

Key Insights
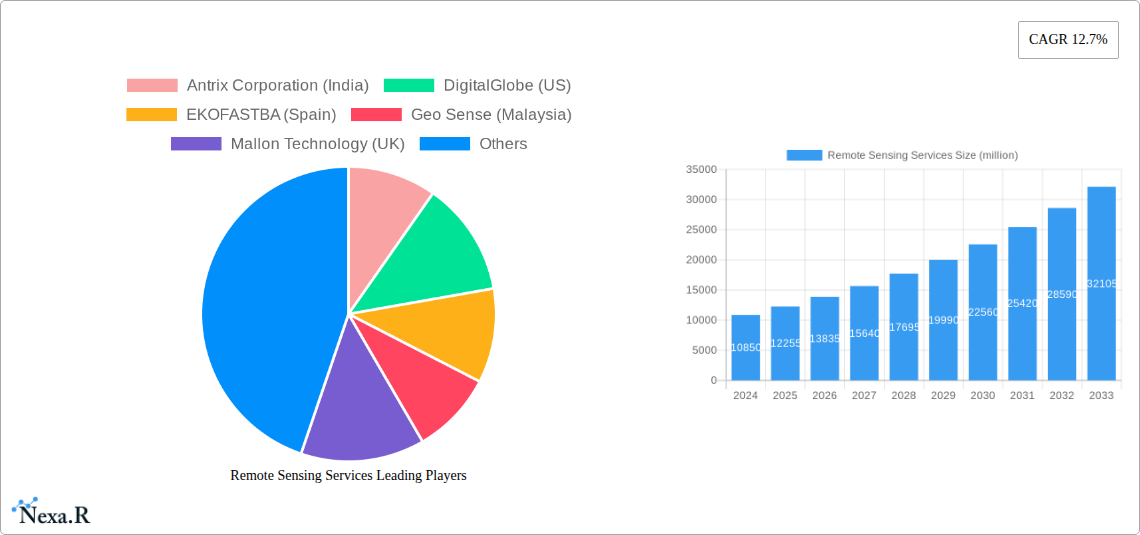
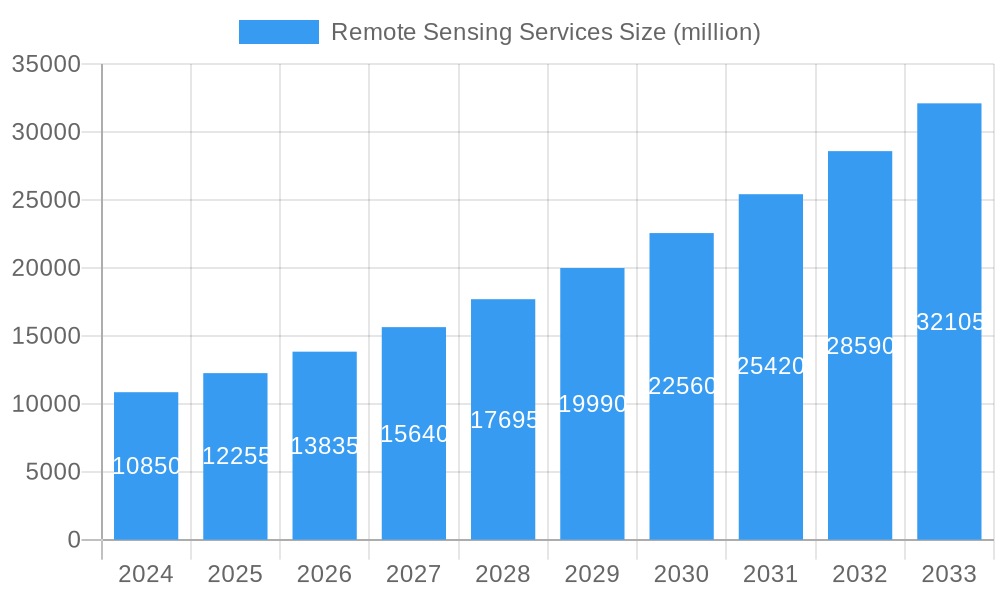
The global Remote Sensing Services market is poised for substantial growth, projected to reach $18,720 million by 2033, driven by a compelling Compound Annual Growth Rate (CAGR) of 12.7% from its estimated 2025 value. This robust expansion is fueled by escalating demand across diverse applications, particularly in civil infrastructure development, defense intelligence, and commercial operations that increasingly rely on precise spatial data. Key drivers include advancements in satellite and aerial imaging technologies, the proliferation of drone-based remote sensing, and the growing adoption of big data analytics and artificial intelligence for interpreting vast datasets. These technological leaps enable more efficient data acquisition, enhanced resolution, and sophisticated analysis, unlocking new use cases and driving market penetration. The increasing need for environmental monitoring, urban planning, disaster management, and precision agriculture further solidifies the foundational demand for these critical services.
Remote Sensing Services Market Size (In Billion)
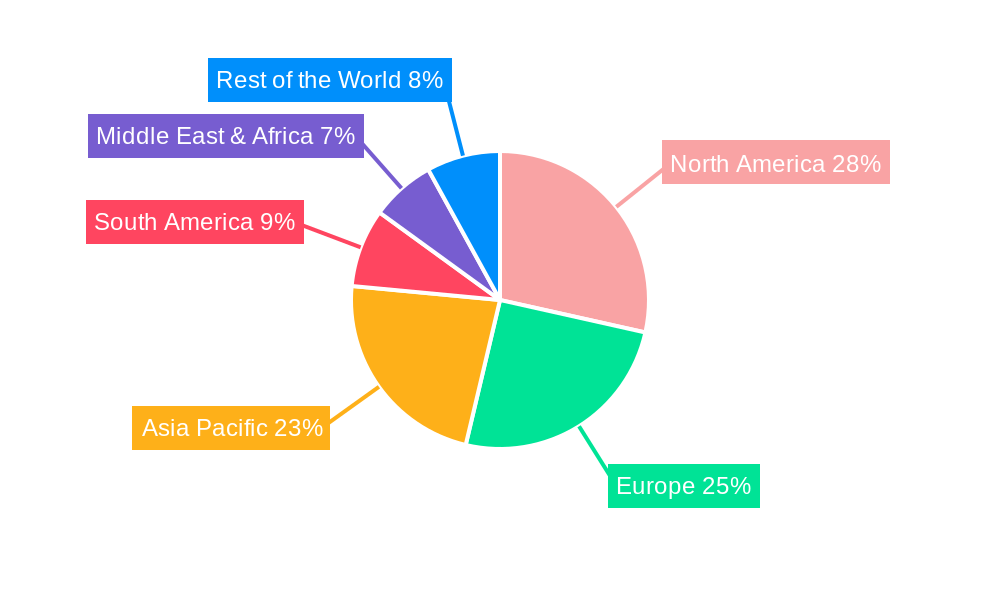
The market is segmented by application into Civil, Defense, and Commercial sectors, each presenting unique growth opportunities. Within types, Aerial Photography & Remote Sensing and Data Acquisition & Analytics are crucial components driving innovation and service delivery. Geographically, North America and Europe are established leaders, owing to their advanced technological infrastructure and significant investments in defense and infrastructure projects. However, the Asia Pacific region is anticipated to exhibit the fastest growth, spurred by rapid economic development, expanding urbanization, and increased government initiatives in smart city projects and resource management. Emerging economies in South America and the Middle East & Africa also represent significant untapped potential. Challenges such as high initial investment costs for sophisticated equipment and the need for specialized expertise are being mitigated by the increasing availability of cloud-based platforms and the development of user-friendly analytical tools, paving the way for broader market accessibility.
Remote Sensing Services Company Market Share
Remote Sensing Services Market Report: Unlocking Global Insights and Innovation (2019-2033)
Report Description:
This comprehensive report provides an in-depth analysis of the global Remote Sensing Services Market, a critical industry enabling unprecedented insights across Civil, Defense, and Commercial applications. Explore the evolving landscape of Aerial Photography & Remote Sensing and Data Acquisition & Analytics, driven by significant technological advancements and increasing demand for actionable intelligence. This report delves into market dynamics, growth trends, regional dominance, product innovations, and key challenges, offering a definitive outlook for industry stakeholders. With a forecast period extending to 2033, this research is essential for companies seeking to leverage satellite imagery, geospatial data, and aerial mapping solutions for strategic decision-making and operational efficiency.
Remote Sensing Services Market Dynamics & Structure
The global Remote Sensing Services Market exhibits a moderately concentrated structure, with a few key players dominating market share, particularly in advanced data acquisition and analytics. Technological innovation is a primary driver, fueled by advancements in sensor technology, artificial intelligence for image processing, and cloud computing platforms that facilitate massive data handling. Regulatory frameworks, primarily focusing on data privacy, national security, and spectrum allocation for satellite operations, shape market entry and operational strategies. Competitive product substitutes, such as ground-based surveys and traditional surveying methods, are increasingly being displaced by the efficiency and scale of remote sensing. End-user demographics are diversifying, with growing adoption in environmental monitoring, urban planning, agriculture, and disaster management, alongside established defense and commercial intelligence sectors. Mergers and Acquisitions (M&A) are significant, with companies consolidating capabilities, expanding geographical reach, and acquiring specialized technologies to enhance their service offerings. For instance, the defense segment represents a substantial portion of the market, estimated at over $5,000 million in 2025. The commercial application segment is projected to grow at a CAGR of approximately 15% during the forecast period.
- Market Concentration: Moderate to high in specialized analytics and high-resolution imagery.
- Technological Innovation Drivers: AI-driven analytics, miniaturized sensors, cloud-based processing.
- Regulatory Frameworks: Data sovereignty, national security, international space treaties.
- Competitive Product Substitutes: Traditional ground surveys, drone-based mapping (as a complementary service).
- End-User Demographics: Government (defense, environmental), commercial (agriculture, energy, infrastructure, insurance), research institutions.
- M&A Trends: Consolidation for scale, acquisition of AI/ML capabilities, expansion into niche markets.
Remote Sensing Services Growth Trends & Insights
The Remote Sensing Services Market is poised for robust growth, projected to reach an estimated $25,000 million by 2033, exhibiting a Compound Annual Growth Rate (CAGR) of approximately 14% from the base year of 2025. This expansion is underpinned by a significant evolution in market size, driven by increasing demand for precise and timely geospatial information across diverse applications. Adoption rates are accelerating, particularly within the commercial sector, as businesses recognize the value of satellite data for optimizing operations, managing risks, and identifying new opportunities. Technological disruptions, including the proliferation of small satellites (smallsats), advancements in synthetic aperture radar (SAR) technology for all-weather imaging, and the integration of machine learning algorithms for automated feature extraction, are fundamentally reshaping the industry. Consumer behavior shifts are evident, with a growing expectation for real-time data accessibility and sophisticated analytical tools that translate raw imagery into actionable intelligence. The Data Acquisition & Analytics segment is particularly dynamic, expected to command over 60% of the market share by 2033 due to the increasing sophistication of data processing and interpretation. The Civil application segment is also witnessing substantial growth, driven by increased government investment in infrastructure monitoring and environmental protection, projected to grow by $7,000 million between 2025 and 2033.
- Market Size Evolution: From an estimated $13,500 million in 2025, growing steadily towards $25,000 million by 2033.
- Adoption Rates: Accelerating across commercial and civil sectors due to cost-effectiveness and enhanced capabilities.
- Technological Disruptions: Smallsat constellations, advanced SAR, AI/ML for feature extraction, drone integration.
- Consumer Behavior Shifts: Demand for real-time data, predictive analytics, and user-friendly platforms.
- Market Penetration: Increasing penetration into emerging markets and non-traditional applications.
Dominant Regions, Countries, or Segments in Remote Sensing Services
The North America region is currently the dominant force in the global Remote Sensing Services Market, driven by significant investments in defense, robust commercial sector adoption, and a strong ecosystem of technology developers and service providers. The United States, in particular, leads with extensive government funding for defense and civilian space programs, alongside a thriving private sector that pioneers innovation in data acquisition and analytics. The Commercial application segment within North America is a key growth engine, with widespread use in precision agriculture, energy exploration, insurance risk assessment, and infrastructure development, contributing an estimated $7,500 million to the market in 2025.
Key drivers for this dominance include:
- Economic Policies: Favorable government policies supporting research and development, coupled with significant private sector venture capital investment in geospatial technologies.
- Infrastructure: Well-developed ground infrastructure for data reception and processing, alongside advanced telecommunications networks.
- Technological Prowess: A leading position in satellite design, sensor development, and advanced analytical software.
- Defense Spending: High levels of defense expenditure necessitate advanced surveillance and reconnaissance capabilities offered by remote sensing.
- Research & Development: Strong presence of research institutions and universities driving innovation in remote sensing science and applications.
Within the Application segment, the Commercial sector is expected to exhibit the highest growth rate, projected at a CAGR of 16% from 2025 to 2033. In the Types segment, Data Acquisition & Analytics is anticipated to capture the largest market share, estimated at $10,000 million in 2025, due to the increasing complexity and value of processed geospatial information. The Civil application segment is also a significant contributor, with governments globally utilizing remote sensing for urban planning, disaster management, and environmental monitoring, representing an estimated $5,500 million market in 2025.
Remote Sensing Services Product Landscape
The Remote Sensing Services product landscape is characterized by continuous innovation, offering sophisticated solutions for diverse client needs. Key advancements include high-resolution optical satellite imagery with sub-meter accuracy, enabling detailed feature identification for urban planning and infrastructure monitoring. Synthetic Aperture Radar (SAR) imagery is increasingly prevalent, providing all-weather, day-and-night imaging capabilities crucial for disaster response and resource management. Furthermore, the integration of artificial intelligence (AI) and machine learning (ML) algorithms into data processing pipelines allows for automated object detection, change analysis, and predictive modeling, transforming raw data into actionable insights. The unique selling proposition lies in the ability to provide comprehensive geospatial intelligence, from raw data acquisition to advanced analytics, tailored for specific industry challenges. For instance, services focusing on change detection analysis for environmental monitoring are seeing significant demand.
Key Drivers, Barriers & Challenges in Remote Sensing Services
Key Drivers:
- Technological Advancements: Miniaturization of satellites, improved sensor resolution, AI/ML for data analysis, and cloud computing enable more efficient and insightful remote sensing. The increasing availability of high-frequency data from constellations of small satellites is a significant driver.
- Growing Demand for Geospatial Intelligence: Diverse industries, including agriculture, defense, environment, and urban planning, increasingly rely on precise spatial data for decision-making, risk management, and operational efficiency.
- Government Initiatives & Investments: National space programs and funding for defense, environmental monitoring, and infrastructure projects fuel market growth. For example, increased funding for climate monitoring is driving demand for satellite-based environmental data.
Barriers & Challenges:
- High Initial Investment Costs: The development, launch, and maintenance of satellite constellations and advanced ground infrastructure require substantial capital, creating a barrier for new entrants. The cost of launching a satellite can range from $5 million to over $100 million.
- Data Processing and Storage Demands: The sheer volume of data generated necessitates significant investments in processing capabilities, storage solutions, and skilled personnel, impacting operational costs.
- Regulatory Hurdles and Data Governance: Navigating complex international regulations, data sovereignty laws, and data security protocols can be challenging and time-consuming.
- Skilled Workforce Shortage: A lack of adequately trained professionals in remote sensing, geospatial analysis, and AI/ML can hinder market expansion and service delivery.
- Competition from Free Data Sources: The availability of some free satellite imagery can create pricing pressure for commercial service providers.
Emerging Opportunities in Remote Sensing Services
Emerging opportunities in the Remote Sensing Services Market are abundant, particularly in the expansion of precision agriculture for optimizing crop yields and resource management. The growing global concern for climate change is driving demand for enhanced environmental monitoring, including deforestation tracking, carbon emission assessment, and disaster prediction and response. The development of sophisticated digital twin technologies, powered by real-time geospatial data, presents a significant opportunity for infrastructure management and urban planning. Furthermore, the increasing adoption of edge computing in remote sensing allows for real-time data processing and analysis closer to the data source, opening avenues for applications in autonomous systems and the Internet of Things (IoT). The untapped potential in emerging economies for infrastructure development and resource exploration also presents a substantial growth area.
Growth Accelerators in the Remote Sensing Services Industry
Several key catalysts are accelerating growth in the Remote Sensing Services Industry. The ongoing miniaturization and cost reduction of satellite technology, particularly the rise of smallsat constellations, are democratizing access to space-based data. Strategic partnerships between satellite operators, data analytics firms, and end-user industries are fostering innovation and creating integrated solutions. Market expansion strategies, including the development of user-friendly platforms and application-specific solutions, are broadening the customer base. Furthermore, advancements in AI and machine learning are significantly enhancing the speed and accuracy of data interpretation, unlocking new insights and applications previously unattainable. The increasing adoption of remote sensing by insurance companies for risk assessment and damage evaluation is another powerful growth accelerator.
Key Players Shaping the Remote Sensing Services Market
- Antrix Corporation
- DigitalGlobe
- EKOFASTBA
- Geo Sense
- Mallon Technology
- Remote Sensing Solutions
- SpecTIR
- Satellite Imaging
- Terra Remote Sensing
- Airborne Sensing Corporation
- The Sanborn Map Company
Notable Milestones in Remote Sensing Services Sector
- 2019: Launch of several new commercial satellite constellations with enhanced resolution and revisit rates.
- 2020: Increased use of satellite imagery for monitoring global supply chains and agricultural yields amidst pandemic disruptions.
- 2021: Significant advancements in AI algorithms for automated object detection and change analysis in satellite imagery.
- 2022: Growing adoption of SAR imagery for disaster response and infrastructure monitoring across various regions.
- 2023: Introduction of integrated drone and satellite data platforms for comprehensive geospatial intelligence.
- 2024: Increased focus on cloud-native remote sensing solutions for scalable data processing and analysis.
In-Depth Remote Sensing Services Market Outlook
The future of the Remote Sensing Services Market is exceptionally bright, driven by a confluence of accelerating growth factors. Technological breakthroughs in artificial intelligence, sensor technology, and cloud computing will continue to enhance data processing capabilities and unlock novel applications. Strategic partnerships and collaborations will foster innovation and expand market reach. The increasing demand for actionable geospatial intelligence across Civil, Defense, and Commercial sectors, coupled with a growing awareness of environmental sustainability and the need for precise resource management, will solidify remote sensing as an indispensable tool. The market is expected to witness continued expansion into emerging economies and further penetration into existing markets, driven by the undeniable value proposition of reliable, high-resolution, and timely spatial data for informed decision-making and operational excellence. The potential for AI-driven predictive analytics derived from satellite imagery represents a significant future frontier, offering unprecedented insights into global trends and challenges.
Remote Sensing Services Segmentation
-
1. Application
- 1.1. Civil
- 1.2. Defense
- 1.3. Commercial
-
2. Types
- 2.1. Aerial Photography & Remote Sensing
- 2.2. Data Acquisition & Analytics
Remote Sensing Services Segmentation By Geography
-
1. North America
- 1.1. United States
- 1.2. Canada
- 1.3. Mexico
-
2. South America
- 2.1. Brazil
- 2.2. Argentina
- 2.3. Rest of South America
-
3. Europe
- 3.1. United Kingdom
- 3.2. Germany
- 3.3. France
- 3.4. Italy
- 3.5. Spain
- 3.6. Russia
- 3.7. Benelux
- 3.8. Nordics
- 3.9. Rest of Europe
-
4. Middle East & Africa
- 4.1. Turkey
- 4.2. Israel
- 4.3. GCC
- 4.4. North Africa
- 4.5. South Africa
- 4.6. Rest of Middle East & Africa
-
5. Asia Pacific
- 5.1. China
- 5.2. India
- 5.3. Japan
- 5.4. South Korea
- 5.5. ASEAN
- 5.6. Oceania
- 5.7. Rest of Asia Pacific
Remote Sensing Services Regional Market Share
Geographic Coverage of Remote Sensing Services
Remote Sensing Services REPORT HIGHLIGHTS
| Aspects | Details |
|---|---|
| Study Period | 2020-2034 |
| Base Year | 2025 |
| Estimated Year | 2026 |
| Forecast Period | 2026-2034 |
| Historical Period | 2020-2025 |
| Growth Rate | CAGR of 12.7% from 2020-2034 |
| Segmentation |
|
Table of Contents
- 1. Introduction
- 1.1. Research Scope
- 1.2. Market Segmentation
- 1.3. Research Objective
- 1.4. Definitions and Assumptions
- 2. Executive Summary
- 2.1. Market Snapshot
- 3. Market Dynamics
- 3.1. Market Drivers
- 3.2. Market Restrains
- 3.3. Market Trends
- 3.4. Market Opportunities
- 4. Market Factor Analysis
- 4.1. Porters Five Forces
- 4.1.1. Bargaining Power of Suppliers
- 4.1.2. Bargaining Power of Buyers
- 4.1.3. Threat of New Entrants
- 4.1.4. Threat of Substitutes
- 4.1.5. Competitive Rivalry
- 4.2. PESTEL analysis
- 4.3. BCG Analysis
- 4.3.1. Stars (High Growth, High Market Share)
- 4.3.2. Cash Cows (Low Growth, High Market Share)
- 4.3.3. Question Mark (High Growth, Low Market Share)
- 4.3.4. Dogs (Low Growth, Low Market Share)
- 4.4. Ansoff Matrix Analysis
- 4.5. Supply Chain Analysis
- 4.6. Regulatory Landscape
- 4.7. Current Market Potential and Opportunity Assessment (TAM–SAM–SOM Framework)
- 4.8. NRP Analyst Note
- 4.1. Porters Five Forces
- 5. Market Analysis, Insights and Forecast 2021-2033
- 5.1. Market Analysis, Insights and Forecast - by Application
- 5.1.1. Civil
- 5.1.2. Defense
- 5.1.3. Commercial
- 5.2. Market Analysis, Insights and Forecast - by Types
- 5.2.1. Aerial Photography & Remote Sensing
- 5.2.2. Data Acquisition & Analytics
- 5.3. Market Analysis, Insights and Forecast - by Region
- 5.3.1. North America
- 5.3.2. South America
- 5.3.3. Europe
- 5.3.4. Middle East & Africa
- 5.3.5. Asia Pacific
- 5.1. Market Analysis, Insights and Forecast - by Application
- 6. Global Remote Sensing Services Analysis, Insights and Forecast, 2021-2033
- 6.1. Market Analysis, Insights and Forecast - by Application
- 6.1.1. Civil
- 6.1.2. Defense
- 6.1.3. Commercial
- 6.2. Market Analysis, Insights and Forecast - by Types
- 6.2.1. Aerial Photography & Remote Sensing
- 6.2.2. Data Acquisition & Analytics
- 6.1. Market Analysis, Insights and Forecast - by Application
- 7. North America Remote Sensing Services Analysis, Insights and Forecast, 2020-2032
- 7.1. Market Analysis, Insights and Forecast - by Application
- 7.1.1. Civil
- 7.1.2. Defense
- 7.1.3. Commercial
- 7.2. Market Analysis, Insights and Forecast - by Types
- 7.2.1. Aerial Photography & Remote Sensing
- 7.2.2. Data Acquisition & Analytics
- 7.1. Market Analysis, Insights and Forecast - by Application
- 8. South America Remote Sensing Services Analysis, Insights and Forecast, 2020-2032
- 8.1. Market Analysis, Insights and Forecast - by Application
- 8.1.1. Civil
- 8.1.2. Defense
- 8.1.3. Commercial
- 8.2. Market Analysis, Insights and Forecast - by Types
- 8.2.1. Aerial Photography & Remote Sensing
- 8.2.2. Data Acquisition & Analytics
- 8.1. Market Analysis, Insights and Forecast - by Application
- 9. Europe Remote Sensing Services Analysis, Insights and Forecast, 2020-2032
- 9.1. Market Analysis, Insights and Forecast - by Application
- 9.1.1. Civil
- 9.1.2. Defense
- 9.1.3. Commercial
- 9.2. Market Analysis, Insights and Forecast - by Types
- 9.2.1. Aerial Photography & Remote Sensing
- 9.2.2. Data Acquisition & Analytics
- 9.1. Market Analysis, Insights and Forecast - by Application
- 10. Middle East & Africa Remote Sensing Services Analysis, Insights and Forecast, 2020-2032
- 10.1. Market Analysis, Insights and Forecast - by Application
- 10.1.1. Civil
- 10.1.2. Defense
- 10.1.3. Commercial
- 10.2. Market Analysis, Insights and Forecast - by Types
- 10.2.1. Aerial Photography & Remote Sensing
- 10.2.2. Data Acquisition & Analytics
- 10.1. Market Analysis, Insights and Forecast - by Application
- 11. Asia Pacific Remote Sensing Services Analysis, Insights and Forecast, 2020-2032
- 11.1. Market Analysis, Insights and Forecast - by Application
- 11.1.1. Civil
- 11.1.2. Defense
- 11.1.3. Commercial
- 11.2. Market Analysis, Insights and Forecast - by Types
- 11.2.1. Aerial Photography & Remote Sensing
- 11.2.2. Data Acquisition & Analytics
- 11.1. Market Analysis, Insights and Forecast - by Application
- 12. Competitive Analysis
- 12.1. Company Profiles
- 12.1.1 Antrix Corporation (India)
- 12.1.1.1. Company Overview
- 12.1.1.2. Products
- 12.1.1.3. Company Financials
- 12.1.1.4. SWOT Analysis
- 12.1.2 DigitalGlobe (US)
- 12.1.2.1. Company Overview
- 12.1.2.2. Products
- 12.1.2.3. Company Financials
- 12.1.2.4. SWOT Analysis
- 12.1.3 EKOFASTBA (Spain)
- 12.1.3.1. Company Overview
- 12.1.3.2. Products
- 12.1.3.3. Company Financials
- 12.1.3.4. SWOT Analysis
- 12.1.4 Geo Sense (Malaysia)
- 12.1.4.1. Company Overview
- 12.1.4.2. Products
- 12.1.4.3. Company Financials
- 12.1.4.4. SWOT Analysis
- 12.1.5 Mallon Technology (UK)
- 12.1.5.1. Company Overview
- 12.1.5.2. Products
- 12.1.5.3. Company Financials
- 12.1.5.4. SWOT Analysis
- 12.1.6 Remote Sensing Solutions (Germany)
- 12.1.6.1. Company Overview
- 12.1.6.2. Products
- 12.1.6.3. Company Financials
- 12.1.6.4. SWOT Analysis
- 12.1.7 SpecTIR (US)
- 12.1.7.1. Company Overview
- 12.1.7.2. Products
- 12.1.7.3. Company Financials
- 12.1.7.4. SWOT Analysis
- 12.1.8 Satellite Imaging (US)
- 12.1.8.1. Company Overview
- 12.1.8.2. Products
- 12.1.8.3. Company Financials
- 12.1.8.4. SWOT Analysis
- 12.1.9 Terra Remote Sensing (Canada)
- 12.1.9.1. Company Overview
- 12.1.9.2. Products
- 12.1.9.3. Company Financials
- 12.1.9.4. SWOT Analysis
- 12.1.10 Airborne Sensing Corporation (Canada)
- 12.1.10.1. Company Overview
- 12.1.10.2. Products
- 12.1.10.3. Company Financials
- 12.1.10.4. SWOT Analysis
- 12.1.11 The Sanborn Map Company (US)
- 12.1.11.1. Company Overview
- 12.1.11.2. Products
- 12.1.11.3. Company Financials
- 12.1.11.4. SWOT Analysis
- 12.1.1 Antrix Corporation (India)
- 12.2. Market Entropy
- 12.2.1 Company's Key Areas Served
- 12.2.2 Recent Developments
- 12.3. Company Market Share Analysis 2025
- 12.3.1 Top 5 Companies Market Share Analysis
- 12.3.2 Top 3 Companies Market Share Analysis
- 12.4. List of Potential Customers
- 13. Research Methodology
List of Figures
- Figure 1: Global Remote Sensing Services Revenue Breakdown (million, %) by Region 2025 & 2033
- Figure 2: North America Remote Sensing Services Revenue (million), by Application 2025 & 2033
- Figure 3: North America Remote Sensing Services Revenue Share (%), by Application 2025 & 2033
- Figure 4: North America Remote Sensing Services Revenue (million), by Types 2025 & 2033
- Figure 5: North America Remote Sensing Services Revenue Share (%), by Types 2025 & 2033
- Figure 6: North America Remote Sensing Services Revenue (million), by Country 2025 & 2033
- Figure 7: North America Remote Sensing Services Revenue Share (%), by Country 2025 & 2033
- Figure 8: South America Remote Sensing Services Revenue (million), by Application 2025 & 2033
- Figure 9: South America Remote Sensing Services Revenue Share (%), by Application 2025 & 2033
- Figure 10: South America Remote Sensing Services Revenue (million), by Types 2025 & 2033
- Figure 11: South America Remote Sensing Services Revenue Share (%), by Types 2025 & 2033
- Figure 12: South America Remote Sensing Services Revenue (million), by Country 2025 & 2033
- Figure 13: South America Remote Sensing Services Revenue Share (%), by Country 2025 & 2033
- Figure 14: Europe Remote Sensing Services Revenue (million), by Application 2025 & 2033
- Figure 15: Europe Remote Sensing Services Revenue Share (%), by Application 2025 & 2033
- Figure 16: Europe Remote Sensing Services Revenue (million), by Types 2025 & 2033
- Figure 17: Europe Remote Sensing Services Revenue Share (%), by Types 2025 & 2033
- Figure 18: Europe Remote Sensing Services Revenue (million), by Country 2025 & 2033
- Figure 19: Europe Remote Sensing Services Revenue Share (%), by Country 2025 & 2033
- Figure 20: Middle East & Africa Remote Sensing Services Revenue (million), by Application 2025 & 2033
- Figure 21: Middle East & Africa Remote Sensing Services Revenue Share (%), by Application 2025 & 2033
- Figure 22: Middle East & Africa Remote Sensing Services Revenue (million), by Types 2025 & 2033
- Figure 23: Middle East & Africa Remote Sensing Services Revenue Share (%), by Types 2025 & 2033
- Figure 24: Middle East & Africa Remote Sensing Services Revenue (million), by Country 2025 & 2033
- Figure 25: Middle East & Africa Remote Sensing Services Revenue Share (%), by Country 2025 & 2033
- Figure 26: Asia Pacific Remote Sensing Services Revenue (million), by Application 2025 & 2033
- Figure 27: Asia Pacific Remote Sensing Services Revenue Share (%), by Application 2025 & 2033
- Figure 28: Asia Pacific Remote Sensing Services Revenue (million), by Types 2025 & 2033
- Figure 29: Asia Pacific Remote Sensing Services Revenue Share (%), by Types 2025 & 2033
- Figure 30: Asia Pacific Remote Sensing Services Revenue (million), by Country 2025 & 2033
- Figure 31: Asia Pacific Remote Sensing Services Revenue Share (%), by Country 2025 & 2033
List of Tables
- Table 1: Global Remote Sensing Services Revenue million Forecast, by Application 2020 & 2033
- Table 2: Global Remote Sensing Services Revenue million Forecast, by Types 2020 & 2033
- Table 3: Global Remote Sensing Services Revenue million Forecast, by Region 2020 & 2033
- Table 4: Global Remote Sensing Services Revenue million Forecast, by Application 2020 & 2033
- Table 5: Global Remote Sensing Services Revenue million Forecast, by Types 2020 & 2033
- Table 6: Global Remote Sensing Services Revenue million Forecast, by Country 2020 & 2033
- Table 7: United States Remote Sensing Services Revenue (million) Forecast, by Application 2020 & 2033
- Table 8: Canada Remote Sensing Services Revenue (million) Forecast, by Application 2020 & 2033
- Table 9: Mexico Remote Sensing Services Revenue (million) Forecast, by Application 2020 & 2033
- Table 10: Global Remote Sensing Services Revenue million Forecast, by Application 2020 & 2033
- Table 11: Global Remote Sensing Services Revenue million Forecast, by Types 2020 & 2033
- Table 12: Global Remote Sensing Services Revenue million Forecast, by Country 2020 & 2033
- Table 13: Brazil Remote Sensing Services Revenue (million) Forecast, by Application 2020 & 2033
- Table 14: Argentina Remote Sensing Services Revenue (million) Forecast, by Application 2020 & 2033
- Table 15: Rest of South America Remote Sensing Services Revenue (million) Forecast, by Application 2020 & 2033
- Table 16: Global Remote Sensing Services Revenue million Forecast, by Application 2020 & 2033
- Table 17: Global Remote Sensing Services Revenue million Forecast, by Types 2020 & 2033
- Table 18: Global Remote Sensing Services Revenue million Forecast, by Country 2020 & 2033
- Table 19: United Kingdom Remote Sensing Services Revenue (million) Forecast, by Application 2020 & 2033
- Table 20: Germany Remote Sensing Services Revenue (million) Forecast, by Application 2020 & 2033
- Table 21: France Remote Sensing Services Revenue (million) Forecast, by Application 2020 & 2033
- Table 22: Italy Remote Sensing Services Revenue (million) Forecast, by Application 2020 & 2033
- Table 23: Spain Remote Sensing Services Revenue (million) Forecast, by Application 2020 & 2033
- Table 24: Russia Remote Sensing Services Revenue (million) Forecast, by Application 2020 & 2033
- Table 25: Benelux Remote Sensing Services Revenue (million) Forecast, by Application 2020 & 2033
- Table 26: Nordics Remote Sensing Services Revenue (million) Forecast, by Application 2020 & 2033
- Table 27: Rest of Europe Remote Sensing Services Revenue (million) Forecast, by Application 2020 & 2033
- Table 28: Global Remote Sensing Services Revenue million Forecast, by Application 2020 & 2033
- Table 29: Global Remote Sensing Services Revenue million Forecast, by Types 2020 & 2033
- Table 30: Global Remote Sensing Services Revenue million Forecast, by Country 2020 & 2033
- Table 31: Turkey Remote Sensing Services Revenue (million) Forecast, by Application 2020 & 2033
- Table 32: Israel Remote Sensing Services Revenue (million) Forecast, by Application 2020 & 2033
- Table 33: GCC Remote Sensing Services Revenue (million) Forecast, by Application 2020 & 2033
- Table 34: North Africa Remote Sensing Services Revenue (million) Forecast, by Application 2020 & 2033
- Table 35: South Africa Remote Sensing Services Revenue (million) Forecast, by Application 2020 & 2033
- Table 36: Rest of Middle East & Africa Remote Sensing Services Revenue (million) Forecast, by Application 2020 & 2033
- Table 37: Global Remote Sensing Services Revenue million Forecast, by Application 2020 & 2033
- Table 38: Global Remote Sensing Services Revenue million Forecast, by Types 2020 & 2033
- Table 39: Global Remote Sensing Services Revenue million Forecast, by Country 2020 & 2033
- Table 40: China Remote Sensing Services Revenue (million) Forecast, by Application 2020 & 2033
- Table 41: India Remote Sensing Services Revenue (million) Forecast, by Application 2020 & 2033
- Table 42: Japan Remote Sensing Services Revenue (million) Forecast, by Application 2020 & 2033
- Table 43: South Korea Remote Sensing Services Revenue (million) Forecast, by Application 2020 & 2033
- Table 44: ASEAN Remote Sensing Services Revenue (million) Forecast, by Application 2020 & 2033
- Table 45: Oceania Remote Sensing Services Revenue (million) Forecast, by Application 2020 & 2033
- Table 46: Rest of Asia Pacific Remote Sensing Services Revenue (million) Forecast, by Application 2020 & 2033
Frequently Asked Questions
1. What is the projected Compound Annual Growth Rate (CAGR) of the Remote Sensing Services?
The projected CAGR is approximately 12.7%.
2. Which companies are prominent players in the Remote Sensing Services?
Key companies in the market include Antrix Corporation (India), DigitalGlobe (US), EKOFASTBA (Spain), Geo Sense (Malaysia), Mallon Technology (UK), Remote Sensing Solutions (Germany), SpecTIR (US), Satellite Imaging (US), Terra Remote Sensing (Canada), Airborne Sensing Corporation (Canada), The Sanborn Map Company (US).
3. What are the main segments of the Remote Sensing Services?
The market segments include Application, Types.
4. Can you provide details about the market size?
The market size is estimated to be USD 18720 million as of 2022.
5. What are some drivers contributing to market growth?
N/A
6. What are the notable trends driving market growth?
N/A
7. Are there any restraints impacting market growth?
N/A
8. Can you provide examples of recent developments in the market?
N/A
9. What pricing options are available for accessing the report?
Pricing options include single-user, multi-user, and enterprise licenses priced at USD 2900.00, USD 4350.00, and USD 5800.00 respectively.
10. Is the market size provided in terms of value or volume?
The market size is provided in terms of value, measured in million.
11. Are there any specific market keywords associated with the report?
Yes, the market keyword associated with the report is "Remote Sensing Services," which aids in identifying and referencing the specific market segment covered.
12. How do I determine which pricing option suits my needs best?
The pricing options vary based on user requirements and access needs. Individual users may opt for single-user licenses, while businesses requiring broader access may choose multi-user or enterprise licenses for cost-effective access to the report.
13. Are there any additional resources or data provided in the Remote Sensing Services report?
While the report offers comprehensive insights, it's advisable to review the specific contents or supplementary materials provided to ascertain if additional resources or data are available.
14. How can I stay updated on further developments or reports in the Remote Sensing Services?
To stay informed about further developments, trends, and reports in the Remote Sensing Services, consider subscribing to industry newsletters, following relevant companies and organizations, or regularly checking reputable industry news sources and publications.
Methodology
Step 1 - Identification of Relevant Samples Size from Population Database


Step 2 - Approaches for Defining Global Market Size (Value, Volume* & Price*)

Note*: In applicable scenarios
Step 3 - Data Sources
Primary Research
- Web Analytics
- Survey Reports
- Research Institute
- Latest Research Reports
- Opinion Leaders
Secondary Research
- Annual Reports
- White Paper
- Latest Press Release
- Industry Association
- Paid Database
- Investor Presentations

Step 4 - Data Triangulation
Involves using different sources of information in order to increase the validity of a study
These sources are likely to be stakeholders in a program - participants, other researchers, program staff, other community members, and so on.
Then we put all data in single framework & apply various statistical tools to find out the dynamic on the market.
During the analysis stage, feedback from the stakeholder groups would be compared to determine areas of agreement as well as areas of divergence