

Key Insights
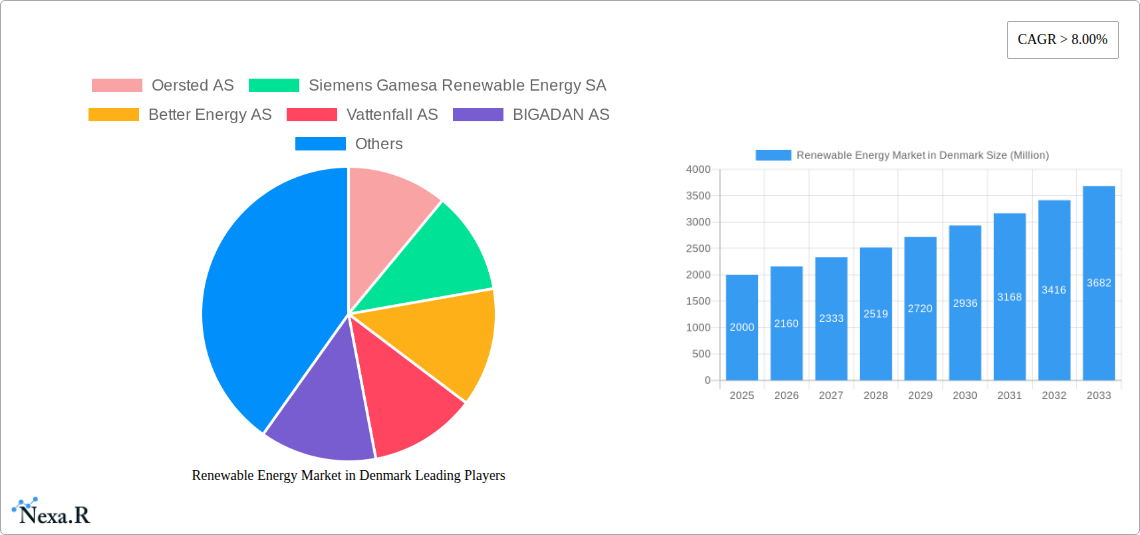
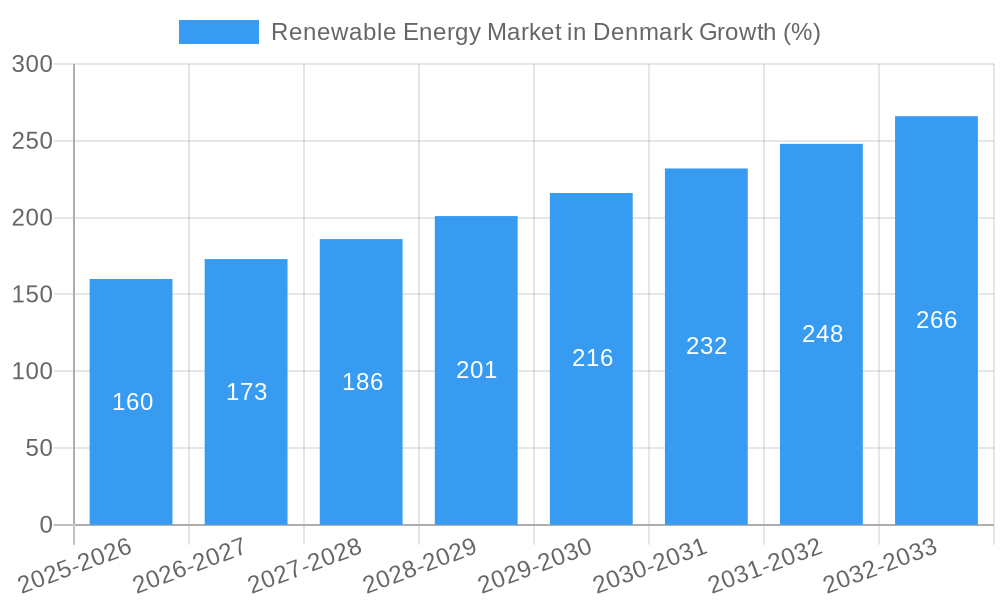
The Danish renewable energy market, valued at approximately €2 billion in 2025, is experiencing robust growth, projected to expand at a Compound Annual Growth Rate (CAGR) exceeding 8% from 2025 to 2033. This expansion is driven by several key factors. Governmental policies promoting energy independence and carbon neutrality are strong incentives for investment and deployment of renewable energy sources. Denmark's commitment to ambitious climate targets necessitates a rapid shift away from fossil fuels, fueling demand for solar, wind, and other renewable technologies across electricity generation, heating & cooling, and transportation sectors. Furthermore, technological advancements, leading to increased efficiency and reduced costs of renewable energy systems, contribute to the market's growth. Strong public support for environmental sustainability and increasing awareness of climate change further bolster market demand.
However, challenges remain. Intermittency of renewable energy sources, particularly solar and wind power, necessitates significant investment in energy storage solutions and grid modernization to ensure a stable energy supply. Land-use constraints, especially for large-scale wind farms, and potential impacts on biodiversity pose environmental concerns that need careful consideration and mitigation strategies. While these restraints exist, the overall market outlook remains positive, with consistent governmental support, technological progress, and growing public awareness collectively driving significant growth within the forecast period. The significant presence of companies like Ørsted, Vestas, and Siemens Gamesa in Denmark also signifies a robust and established industry base fostering future expansion.
Renewable Energy Market in Denmark: A Comprehensive Report (2019-2033)
This in-depth report provides a comprehensive analysis of the renewable energy market in Denmark, covering market dynamics, growth trends, dominant segments, key players, and future outlook. With a focus on wind and solar energy, this report is an essential resource for industry professionals, investors, and policymakers seeking to understand this rapidly evolving market. The study period spans 2019-2033, with 2025 as the base and estimated year.
Keywords: Renewable energy Denmark, Wind energy Denmark, Solar energy Denmark, Renewable energy market, Danish renewable energy, Energy island Denmark, Oersted, Vestas, Siemens Gamesa, Renewable energy investments Denmark, Green energy Denmark, Sustainable energy Denmark, Renewable energy policy Denmark.
Renewable Energy Market in Denmark Market Dynamics & Structure
This section analyzes the competitive landscape, technological advancements, regulatory environment, and market trends within the Danish renewable energy sector. The market is characterized by a high level of concentration with a few major players dominating. However, smaller, specialized companies are also emerging, particularly in niche areas such as biofuels and innovative energy storage solutions.
- Market Concentration: The market is highly concentrated, with major players like Ørsted AS, Vestas Wind Systems AS, and Siemens Gamesa Renewable Energy SA holding significant market share. (Specific percentages will be detailed in the full report, but are estimated at approximately 60% combined market share).
- Technological Innovation: Denmark leads in wind turbine technology, with ongoing innovation in offshore wind, particularly large-scale projects. Innovation in solar PV technology, including advancements in efficiency and cost reduction, are also contributing to market growth. However, challenges remain in areas like energy storage and grid integration.
- Regulatory Framework: Supportive government policies and ambitious renewable energy targets are key drivers of market growth. Incentives, feed-in tariffs, and environmental regulations create a favorable environment for renewable energy investments.
- Competitive Product Substitutes: The primary substitute for renewable energy is fossil fuels (coal, oil, and natural gas). However, the increasing costs and environmental concerns associated with fossil fuels, coupled with decreasing costs of renewable energy, are shifting the balance in favor of renewables.
- End-User Demographics: The primary end-users are electricity generators, followed by industries using renewable energy for heating and cooling applications. The transportation sector is an emerging area with growing adoption of electric vehicles.
- M&A Trends: The number of M&A deals in the sector is expected to increase in the forecast period, driven by consolidation among players, access to technology, and expansion into new markets. The estimated value of M&A deals in the 2019-2024 historical period was xx Million.
Renewable Energy Market in Denmark Growth Trends & Insights
The Danish renewable energy market has experienced significant growth in recent years, driven by supportive government policies, technological advancements, and decreasing costs. The market size has increased steadily, with a projected Compound Annual Growth Rate (CAGR) of xx% during the forecast period (2025-2033). This growth is fueled by increased electricity generation from wind and solar, along with expanding applications in heating and cooling, and gradually transportation. Increased public and private investment plays a vital role. Consumer behavior is also shifting towards greater environmental awareness and support for renewable energy. Market penetration is expected to reach xx% by 2033.
Dominant Regions, Countries, or Segments in Renewable Energy Market in Denmark
The wind energy segment dominates the Danish renewable energy market, followed by solar and other renewable energy sources, particularly biomass. The wind segment maintains significant share due to favorable geographical conditions, established infrastructure, and technological leadership.
- Wind Energy: Dominant due to strong wind resources and a highly developed offshore wind industry. Significant investments in large-scale offshore wind projects further drive this segment. The North Sea ‘Energy Island’ project will further propel its growth.
- Solar Energy: Growth is propelled by declining costs, government incentives, and increasing rooftop solar installations. Urban areas show potential for growth.
- Other Renewable Energy Types: Bioenergy (biomass) plays a minor but significant role, particularly in heating and cooling applications. However, its growth is constrained by factors such as limited feedstock availability and environmental concerns related to certain biomass sources.
- Electricity Generation: This remains the primary application, with wind energy being the dominant source.
- Heating and Cooling: Biomass and heat pumps powered by renewable electricity are increasingly utilized.
- Transportation: The use of renewable energy in transportation, mainly through electric vehicles, is growing slowly but steadily. The government’s incentives and policies play a key role in its development.
Renewable Energy Market in Denmark Product Landscape
The product landscape is dominated by advanced wind turbines, including offshore wind turbines with ever-increasing capacities. Solar PV technology is also evolving, with higher efficiency panels and integrated energy storage solutions emerging. Innovative products are being developed in the biomass energy sector, focusing on sustainability and efficiency. The development is also heavily influenced by smart grid technologies improving integration of variable renewable energy sources.
Key Drivers, Barriers & Challenges in Renewable Energy Market in Denmark
Key Drivers:
- Government Policies & Incentives: Ambitious renewable energy targets, subsidies, and supportive regulations drive market growth.
- Technological Advancements: Cost reductions and efficiency improvements in wind and solar technologies make renewable energy increasingly competitive.
- Environmental Concerns: Growing awareness of climate change and its impacts fuels demand for renewable energy sources.
Key Challenges:
- Grid Integration: Integrating large amounts of variable renewable energy (wind and solar) into the electricity grid requires significant infrastructure investment.
- Intermittency: The intermittent nature of wind and solar energy requires robust energy storage solutions or backup power sources.
- Land Use: Large-scale renewable energy projects may require significant land areas, potentially leading to conflicts with other land uses.
Emerging Opportunities in Renewable Energy Market in Denmark
- Offshore Wind Expansion: Denmark's strategic location and expertise in offshore wind offer significant growth potential. The ‘Energy Island’ is a prime example.
- Energy Storage Solutions: Developing and deploying efficient energy storage technologies is crucial for addressing the intermittency of renewable energy.
- Green Hydrogen Production: Utilizing excess renewable energy for green hydrogen production is emerging as a promising opportunity.
Growth Accelerators in the Renewable Energy Market in Denmark Industry
Continued government support, technological innovation, particularly in areas such as energy storage and grid integration, and strategic partnerships between public and private sectors will accelerate growth in the Danish renewable energy sector. The expansion of offshore wind capacity, combined with the development of innovative applications for renewable energy, such as green hydrogen production, will be key drivers of future expansion.
Key Players Shaping the Renewable Energy Market in Denmark Market
- Ørsted AS
- Siemens Gamesa Renewable Energy SA
- Better Energy AS
- Vattenfall AS
- BIGADAN AS
- Arcon-Sunmark AS
- Vestas Wind Systems AS
Notable Milestones in Renewable Energy Market in Denmark Sector
- 2022: Denmark's government approves plans for the ‘Energy Island’ project.
- 2023 (Ongoing): Construction of the ‘Energy Island’ project begins, representing the largest construction project in Danish history.
- 2023 (Ongoing): The Alfa Laval Test & Training Centre begins testing biofuels, contributing to decarbonization efforts in the maritime industry.
In-Depth Renewable Energy Market in Denmark Market Outlook
The Danish renewable energy market is poised for continued strong growth in the coming years. Government support, technological advancements, and the emergence of new applications will drive expansion. The ‘Energy Island’ project alone represents a significant catalyst, but other strategic initiatives and ongoing private investments will contribute significantly to achieving ambitious renewable energy targets and fostering a sustainable energy future for Denmark. The focus will increasingly shift towards enhancing grid infrastructure, developing advanced energy storage solutions, and exploring innovative applications for renewable energy. This presents significant opportunities for both established players and new entrants to the market.
Renewable Energy Market in Denmark Segmentation
-
1. Type
- 1.1. Solar
- 1.2. Wind
- 1.3. Other Types
Renewable Energy Market in Denmark Segmentation By Geography
-
1. North America
- 1.1. United States
- 1.2. Canada
- 1.3. Mexico
-
2. South America
- 2.1. Brazil
- 2.2. Argentina
- 2.3. Rest of South America
-
3. Europe
- 3.1. United Kingdom
- 3.2. Germany
- 3.3. France
- 3.4. Italy
- 3.5. Spain
- 3.6. Russia
- 3.7. Benelux
- 3.8. Nordics
- 3.9. Rest of Europe
-
4. Middle East & Africa
- 4.1. Turkey
- 4.2. Israel
- 4.3. GCC
- 4.4. North Africa
- 4.5. South Africa
- 4.6. Rest of Middle East & Africa
-
5. Asia Pacific
- 5.1. China
- 5.2. India
- 5.3. Japan
- 5.4. South Korea
- 5.5. ASEAN
- 5.6. Oceania
- 5.7. Rest of Asia Pacific
Renewable Energy Market in Denmark REPORT HIGHLIGHTS
| Aspects | Details |
|---|---|
| Study Period | 2019-2033 |
| Base Year | 2024 |
| Estimated Year | 2025 |
| Forecast Period | 2025-2033 |
| Historical Period | 2019-2024 |
| Growth Rate | CAGR of > 8.00% from 2019-2033 |
| Segmentation |
|
Table of Contents
- 1. Introduction
- 1.1. Research Scope
- 1.2. Market Segmentation
- 1.3. Research Methodology
- 1.4. Definitions and Assumptions
- 2. Executive Summary
- 2.1. Introduction
- 3. Market Dynamics
- 3.1. Introduction
- 3.2. Market Drivers
- 3.2.1. 4.; Declining Cost Of Wind Power Generation4.; Supportive Government Policies
- 3.3. Market Restrains
- 3.3.1. 4.; Penetration Of Solar Energy And Gas-Fired Power Plants
- 3.4. Market Trends
- 3.4.1. Wind Energy to Dominate the Market
- 4. Market Factor Analysis
- 4.1. Porters Five Forces
- 4.2. Supply/Value Chain
- 4.3. PESTEL analysis
- 4.4. Market Entropy
- 4.5. Patent/Trademark Analysis
- 5. Global Renewable Energy Market in Denmark Analysis, Insights and Forecast, 2019-2031
- 5.1. Market Analysis, Insights and Forecast - by Type
- 5.1.1. Solar
- 5.1.2. Wind
- 5.1.3. Other Types
- 5.2. Market Analysis, Insights and Forecast - by Region
- 5.2.1. North America
- 5.2.2. South America
- 5.2.3. Europe
- 5.2.4. Middle East & Africa
- 5.2.5. Asia Pacific
- 5.1. Market Analysis, Insights and Forecast - by Type
- 6. North America Renewable Energy Market in Denmark Analysis, Insights and Forecast, 2019-2031
- 6.1. Market Analysis, Insights and Forecast - by Type
- 6.1.1. Solar
- 6.1.2. Wind
- 6.1.3. Other Types
- 6.1. Market Analysis, Insights and Forecast - by Type
- 7. South America Renewable Energy Market in Denmark Analysis, Insights and Forecast, 2019-2031
- 7.1. Market Analysis, Insights and Forecast - by Type
- 7.1.1. Solar
- 7.1.2. Wind
- 7.1.3. Other Types
- 7.1. Market Analysis, Insights and Forecast - by Type
- 8. Europe Renewable Energy Market in Denmark Analysis, Insights and Forecast, 2019-2031
- 8.1. Market Analysis, Insights and Forecast - by Type
- 8.1.1. Solar
- 8.1.2. Wind
- 8.1.3. Other Types
- 8.1. Market Analysis, Insights and Forecast - by Type
- 9. Middle East & Africa Renewable Energy Market in Denmark Analysis, Insights and Forecast, 2019-2031
- 9.1. Market Analysis, Insights and Forecast - by Type
- 9.1.1. Solar
- 9.1.2. Wind
- 9.1.3. Other Types
- 9.1. Market Analysis, Insights and Forecast - by Type
- 10. Asia Pacific Renewable Energy Market in Denmark Analysis, Insights and Forecast, 2019-2031
- 10.1. Market Analysis, Insights and Forecast - by Type
- 10.1.1. Solar
- 10.1.2. Wind
- 10.1.3. Other Types
- 10.1. Market Analysis, Insights and Forecast - by Type
- 11. Competitive Analysis
- 11.1. Global Market Share Analysis 2024
- 11.2. Company Profiles
- 11.2.1 Oersted AS
- 11.2.1.1. Overview
- 11.2.1.2. Products
- 11.2.1.3. SWOT Analysis
- 11.2.1.4. Recent Developments
- 11.2.1.5. Financials (Based on Availability)
- 11.2.2 Siemens Gamesa Renewable Energy SA
- 11.2.2.1. Overview
- 11.2.2.2. Products
- 11.2.2.3. SWOT Analysis
- 11.2.2.4. Recent Developments
- 11.2.2.5. Financials (Based on Availability)
- 11.2.3 Better Energy AS
- 11.2.3.1. Overview
- 11.2.3.2. Products
- 11.2.3.3. SWOT Analysis
- 11.2.3.4. Recent Developments
- 11.2.3.5. Financials (Based on Availability)
- 11.2.4 Vattenfall AS
- 11.2.4.1. Overview
- 11.2.4.2. Products
- 11.2.4.3. SWOT Analysis
- 11.2.4.4. Recent Developments
- 11.2.4.5. Financials (Based on Availability)
- 11.2.5 BIGADAN AS
- 11.2.5.1. Overview
- 11.2.5.2. Products
- 11.2.5.3. SWOT Analysis
- 11.2.5.4. Recent Developments
- 11.2.5.5. Financials (Based on Availability)
- 11.2.6 Arcon-Sunmark AS
- 11.2.6.1. Overview
- 11.2.6.2. Products
- 11.2.6.3. SWOT Analysis
- 11.2.6.4. Recent Developments
- 11.2.6.5. Financials (Based on Availability)
- 11.2.7 Vestas Wind Systems AS
- 11.2.7.1. Overview
- 11.2.7.2. Products
- 11.2.7.3. SWOT Analysis
- 11.2.7.4. Recent Developments
- 11.2.7.5. Financials (Based on Availability)
- 11.2.1 Oersted AS
List of Figures
- Figure 1: Global Renewable Energy Market in Denmark Revenue Breakdown (Million, %) by Region 2024 & 2032
- Figure 2: Global Renewable Energy Market in Denmark Volume Breakdown (gigawatt, %) by Region 2024 & 2032
- Figure 3: Denmark Renewable Energy Market in Denmark Revenue (Million), by Country 2024 & 2032
- Figure 4: Denmark Renewable Energy Market in Denmark Volume (gigawatt), by Country 2024 & 2032
- Figure 5: Denmark Renewable Energy Market in Denmark Revenue Share (%), by Country 2024 & 2032
- Figure 6: Denmark Renewable Energy Market in Denmark Volume Share (%), by Country 2024 & 2032
- Figure 7: North America Renewable Energy Market in Denmark Revenue (Million), by Type 2024 & 2032
- Figure 8: North America Renewable Energy Market in Denmark Volume (gigawatt), by Type 2024 & 2032
- Figure 9: North America Renewable Energy Market in Denmark Revenue Share (%), by Type 2024 & 2032
- Figure 10: North America Renewable Energy Market in Denmark Volume Share (%), by Type 2024 & 2032
- Figure 11: North America Renewable Energy Market in Denmark Revenue (Million), by Country 2024 & 2032
- Figure 12: North America Renewable Energy Market in Denmark Volume (gigawatt), by Country 2024 & 2032
- Figure 13: North America Renewable Energy Market in Denmark Revenue Share (%), by Country 2024 & 2032
- Figure 14: North America Renewable Energy Market in Denmark Volume Share (%), by Country 2024 & 2032
- Figure 15: South America Renewable Energy Market in Denmark Revenue (Million), by Type 2024 & 2032
- Figure 16: South America Renewable Energy Market in Denmark Volume (gigawatt), by Type 2024 & 2032
- Figure 17: South America Renewable Energy Market in Denmark Revenue Share (%), by Type 2024 & 2032
- Figure 18: South America Renewable Energy Market in Denmark Volume Share (%), by Type 2024 & 2032
- Figure 19: South America Renewable Energy Market in Denmark Revenue (Million), by Country 2024 & 2032
- Figure 20: South America Renewable Energy Market in Denmark Volume (gigawatt), by Country 2024 & 2032
- Figure 21: South America Renewable Energy Market in Denmark Revenue Share (%), by Country 2024 & 2032
- Figure 22: South America Renewable Energy Market in Denmark Volume Share (%), by Country 2024 & 2032
- Figure 23: Europe Renewable Energy Market in Denmark Revenue (Million), by Type 2024 & 2032
- Figure 24: Europe Renewable Energy Market in Denmark Volume (gigawatt), by Type 2024 & 2032
- Figure 25: Europe Renewable Energy Market in Denmark Revenue Share (%), by Type 2024 & 2032
- Figure 26: Europe Renewable Energy Market in Denmark Volume Share (%), by Type 2024 & 2032
- Figure 27: Europe Renewable Energy Market in Denmark Revenue (Million), by Country 2024 & 2032
- Figure 28: Europe Renewable Energy Market in Denmark Volume (gigawatt), by Country 2024 & 2032
- Figure 29: Europe Renewable Energy Market in Denmark Revenue Share (%), by Country 2024 & 2032
- Figure 30: Europe Renewable Energy Market in Denmark Volume Share (%), by Country 2024 & 2032
- Figure 31: Middle East & Africa Renewable Energy Market in Denmark Revenue (Million), by Type 2024 & 2032
- Figure 32: Middle East & Africa Renewable Energy Market in Denmark Volume (gigawatt), by Type 2024 & 2032
- Figure 33: Middle East & Africa Renewable Energy Market in Denmark Revenue Share (%), by Type 2024 & 2032
- Figure 34: Middle East & Africa Renewable Energy Market in Denmark Volume Share (%), by Type 2024 & 2032
- Figure 35: Middle East & Africa Renewable Energy Market in Denmark Revenue (Million), by Country 2024 & 2032
- Figure 36: Middle East & Africa Renewable Energy Market in Denmark Volume (gigawatt), by Country 2024 & 2032
- Figure 37: Middle East & Africa Renewable Energy Market in Denmark Revenue Share (%), by Country 2024 & 2032
- Figure 38: Middle East & Africa Renewable Energy Market in Denmark Volume Share (%), by Country 2024 & 2032
- Figure 39: Asia Pacific Renewable Energy Market in Denmark Revenue (Million), by Type 2024 & 2032
- Figure 40: Asia Pacific Renewable Energy Market in Denmark Volume (gigawatt), by Type 2024 & 2032
- Figure 41: Asia Pacific Renewable Energy Market in Denmark Revenue Share (%), by Type 2024 & 2032
- Figure 42: Asia Pacific Renewable Energy Market in Denmark Volume Share (%), by Type 2024 & 2032
- Figure 43: Asia Pacific Renewable Energy Market in Denmark Revenue (Million), by Country 2024 & 2032
- Figure 44: Asia Pacific Renewable Energy Market in Denmark Volume (gigawatt), by Country 2024 & 2032
- Figure 45: Asia Pacific Renewable Energy Market in Denmark Revenue Share (%), by Country 2024 & 2032
- Figure 46: Asia Pacific Renewable Energy Market in Denmark Volume Share (%), by Country 2024 & 2032
List of Tables
- Table 1: Global Renewable Energy Market in Denmark Revenue Million Forecast, by Region 2019 & 2032
- Table 2: Global Renewable Energy Market in Denmark Volume gigawatt Forecast, by Region 2019 & 2032
- Table 3: Global Renewable Energy Market in Denmark Revenue Million Forecast, by Type 2019 & 2032
- Table 4: Global Renewable Energy Market in Denmark Volume gigawatt Forecast, by Type 2019 & 2032
- Table 5: Global Renewable Energy Market in Denmark Revenue Million Forecast, by Region 2019 & 2032
- Table 6: Global Renewable Energy Market in Denmark Volume gigawatt Forecast, by Region 2019 & 2032
- Table 7: Global Renewable Energy Market in Denmark Revenue Million Forecast, by Country 2019 & 2032
- Table 8: Global Renewable Energy Market in Denmark Volume gigawatt Forecast, by Country 2019 & 2032
- Table 9: Global Renewable Energy Market in Denmark Revenue Million Forecast, by Type 2019 & 2032
- Table 10: Global Renewable Energy Market in Denmark Volume gigawatt Forecast, by Type 2019 & 2032
- Table 11: Global Renewable Energy Market in Denmark Revenue Million Forecast, by Country 2019 & 2032
- Table 12: Global Renewable Energy Market in Denmark Volume gigawatt Forecast, by Country 2019 & 2032
- Table 13: United States Renewable Energy Market in Denmark Revenue (Million) Forecast, by Application 2019 & 2032
- Table 14: United States Renewable Energy Market in Denmark Volume (gigawatt) Forecast, by Application 2019 & 2032
- Table 15: Canada Renewable Energy Market in Denmark Revenue (Million) Forecast, by Application 2019 & 2032
- Table 16: Canada Renewable Energy Market in Denmark Volume (gigawatt) Forecast, by Application 2019 & 2032
- Table 17: Mexico Renewable Energy Market in Denmark Revenue (Million) Forecast, by Application 2019 & 2032
- Table 18: Mexico Renewable Energy Market in Denmark Volume (gigawatt) Forecast, by Application 2019 & 2032
- Table 19: Global Renewable Energy Market in Denmark Revenue Million Forecast, by Type 2019 & 2032
- Table 20: Global Renewable Energy Market in Denmark Volume gigawatt Forecast, by Type 2019 & 2032
- Table 21: Global Renewable Energy Market in Denmark Revenue Million Forecast, by Country 2019 & 2032
- Table 22: Global Renewable Energy Market in Denmark Volume gigawatt Forecast, by Country 2019 & 2032
- Table 23: Brazil Renewable Energy Market in Denmark Revenue (Million) Forecast, by Application 2019 & 2032
- Table 24: Brazil Renewable Energy Market in Denmark Volume (gigawatt) Forecast, by Application 2019 & 2032
- Table 25: Argentina Renewable Energy Market in Denmark Revenue (Million) Forecast, by Application 2019 & 2032
- Table 26: Argentina Renewable Energy Market in Denmark Volume (gigawatt) Forecast, by Application 2019 & 2032
- Table 27: Rest of South America Renewable Energy Market in Denmark Revenue (Million) Forecast, by Application 2019 & 2032
- Table 28: Rest of South America Renewable Energy Market in Denmark Volume (gigawatt) Forecast, by Application 2019 & 2032
- Table 29: Global Renewable Energy Market in Denmark Revenue Million Forecast, by Type 2019 & 2032
- Table 30: Global Renewable Energy Market in Denmark Volume gigawatt Forecast, by Type 2019 & 2032
- Table 31: Global Renewable Energy Market in Denmark Revenue Million Forecast, by Country 2019 & 2032
- Table 32: Global Renewable Energy Market in Denmark Volume gigawatt Forecast, by Country 2019 & 2032
- Table 33: United Kingdom Renewable Energy Market in Denmark Revenue (Million) Forecast, by Application 2019 & 2032
- Table 34: United Kingdom Renewable Energy Market in Denmark Volume (gigawatt) Forecast, by Application 2019 & 2032
- Table 35: Germany Renewable Energy Market in Denmark Revenue (Million) Forecast, by Application 2019 & 2032
- Table 36: Germany Renewable Energy Market in Denmark Volume (gigawatt) Forecast, by Application 2019 & 2032
- Table 37: France Renewable Energy Market in Denmark Revenue (Million) Forecast, by Application 2019 & 2032
- Table 38: France Renewable Energy Market in Denmark Volume (gigawatt) Forecast, by Application 2019 & 2032
- Table 39: Italy Renewable Energy Market in Denmark Revenue (Million) Forecast, by Application 2019 & 2032
- Table 40: Italy Renewable Energy Market in Denmark Volume (gigawatt) Forecast, by Application 2019 & 2032
- Table 41: Spain Renewable Energy Market in Denmark Revenue (Million) Forecast, by Application 2019 & 2032
- Table 42: Spain Renewable Energy Market in Denmark Volume (gigawatt) Forecast, by Application 2019 & 2032
- Table 43: Russia Renewable Energy Market in Denmark Revenue (Million) Forecast, by Application 2019 & 2032
- Table 44: Russia Renewable Energy Market in Denmark Volume (gigawatt) Forecast, by Application 2019 & 2032
- Table 45: Benelux Renewable Energy Market in Denmark Revenue (Million) Forecast, by Application 2019 & 2032
- Table 46: Benelux Renewable Energy Market in Denmark Volume (gigawatt) Forecast, by Application 2019 & 2032
- Table 47: Nordics Renewable Energy Market in Denmark Revenue (Million) Forecast, by Application 2019 & 2032
- Table 48: Nordics Renewable Energy Market in Denmark Volume (gigawatt) Forecast, by Application 2019 & 2032
- Table 49: Rest of Europe Renewable Energy Market in Denmark Revenue (Million) Forecast, by Application 2019 & 2032
- Table 50: Rest of Europe Renewable Energy Market in Denmark Volume (gigawatt) Forecast, by Application 2019 & 2032
- Table 51: Global Renewable Energy Market in Denmark Revenue Million Forecast, by Type 2019 & 2032
- Table 52: Global Renewable Energy Market in Denmark Volume gigawatt Forecast, by Type 2019 & 2032
- Table 53: Global Renewable Energy Market in Denmark Revenue Million Forecast, by Country 2019 & 2032
- Table 54: Global Renewable Energy Market in Denmark Volume gigawatt Forecast, by Country 2019 & 2032
- Table 55: Turkey Renewable Energy Market in Denmark Revenue (Million) Forecast, by Application 2019 & 2032
- Table 56: Turkey Renewable Energy Market in Denmark Volume (gigawatt) Forecast, by Application 2019 & 2032
- Table 57: Israel Renewable Energy Market in Denmark Revenue (Million) Forecast, by Application 2019 & 2032
- Table 58: Israel Renewable Energy Market in Denmark Volume (gigawatt) Forecast, by Application 2019 & 2032
- Table 59: GCC Renewable Energy Market in Denmark Revenue (Million) Forecast, by Application 2019 & 2032
- Table 60: GCC Renewable Energy Market in Denmark Volume (gigawatt) Forecast, by Application 2019 & 2032
- Table 61: North Africa Renewable Energy Market in Denmark Revenue (Million) Forecast, by Application 2019 & 2032
- Table 62: North Africa Renewable Energy Market in Denmark Volume (gigawatt) Forecast, by Application 2019 & 2032
- Table 63: South Africa Renewable Energy Market in Denmark Revenue (Million) Forecast, by Application 2019 & 2032
- Table 64: South Africa Renewable Energy Market in Denmark Volume (gigawatt) Forecast, by Application 2019 & 2032
- Table 65: Rest of Middle East & Africa Renewable Energy Market in Denmark Revenue (Million) Forecast, by Application 2019 & 2032
- Table 66: Rest of Middle East & Africa Renewable Energy Market in Denmark Volume (gigawatt) Forecast, by Application 2019 & 2032
- Table 67: Global Renewable Energy Market in Denmark Revenue Million Forecast, by Type 2019 & 2032
- Table 68: Global Renewable Energy Market in Denmark Volume gigawatt Forecast, by Type 2019 & 2032
- Table 69: Global Renewable Energy Market in Denmark Revenue Million Forecast, by Country 2019 & 2032
- Table 70: Global Renewable Energy Market in Denmark Volume gigawatt Forecast, by Country 2019 & 2032
- Table 71: China Renewable Energy Market in Denmark Revenue (Million) Forecast, by Application 2019 & 2032
- Table 72: China Renewable Energy Market in Denmark Volume (gigawatt) Forecast, by Application 2019 & 2032
- Table 73: India Renewable Energy Market in Denmark Revenue (Million) Forecast, by Application 2019 & 2032
- Table 74: India Renewable Energy Market in Denmark Volume (gigawatt) Forecast, by Application 2019 & 2032
- Table 75: Japan Renewable Energy Market in Denmark Revenue (Million) Forecast, by Application 2019 & 2032
- Table 76: Japan Renewable Energy Market in Denmark Volume (gigawatt) Forecast, by Application 2019 & 2032
- Table 77: South Korea Renewable Energy Market in Denmark Revenue (Million) Forecast, by Application 2019 & 2032
- Table 78: South Korea Renewable Energy Market in Denmark Volume (gigawatt) Forecast, by Application 2019 & 2032
- Table 79: ASEAN Renewable Energy Market in Denmark Revenue (Million) Forecast, by Application 2019 & 2032
- Table 80: ASEAN Renewable Energy Market in Denmark Volume (gigawatt) Forecast, by Application 2019 & 2032
- Table 81: Oceania Renewable Energy Market in Denmark Revenue (Million) Forecast, by Application 2019 & 2032
- Table 82: Oceania Renewable Energy Market in Denmark Volume (gigawatt) Forecast, by Application 2019 & 2032
- Table 83: Rest of Asia Pacific Renewable Energy Market in Denmark Revenue (Million) Forecast, by Application 2019 & 2032
- Table 84: Rest of Asia Pacific Renewable Energy Market in Denmark Volume (gigawatt) Forecast, by Application 2019 & 2032
Frequently Asked Questions
1. What is the projected Compound Annual Growth Rate (CAGR) of the Renewable Energy Market in Denmark?
The projected CAGR is approximately > 8.00%.
2. Which companies are prominent players in the Renewable Energy Market in Denmark?
Key companies in the market include Oersted AS, Siemens Gamesa Renewable Energy SA, Better Energy AS, Vattenfall AS, BIGADAN AS, Arcon-Sunmark AS, Vestas Wind Systems AS.
3. What are the main segments of the Renewable Energy Market in Denmark?
The market segments include Type.
4. Can you provide details about the market size?
The market size is estimated to be USD XX Million as of 2022.
5. What are some drivers contributing to market growth?
4.; Declining Cost Of Wind Power Generation4.; Supportive Government Policies.
6. What are the notable trends driving market growth?
Wind Energy to Dominate the Market.
7. Are there any restraints impacting market growth?
4.; Penetration Of Solar Energy And Gas-Fired Power Plants.
8. Can you provide examples of recent developments in the market?
Denmark is expected to construct an artificial island as a wind energy hub. The construction project, believed to be the biggest in Danish history, will link hundreds of wind turbines to deliver enough electricity for millions of households. The first phase of the project is expected to cost around 210 billion Danish crowns.
9. What pricing options are available for accessing the report?
Pricing options include single-user, multi-user, and enterprise licenses priced at USD 3800, USD 4500, and USD 5800 respectively.
10. Is the market size provided in terms of value or volume?
The market size is provided in terms of value, measured in Million and volume, measured in gigawatt.
11. Are there any specific market keywords associated with the report?
Yes, the market keyword associated with the report is "Renewable Energy Market in Denmark," which aids in identifying and referencing the specific market segment covered.
12. How do I determine which pricing option suits my needs best?
The pricing options vary based on user requirements and access needs. Individual users may opt for single-user licenses, while businesses requiring broader access may choose multi-user or enterprise licenses for cost-effective access to the report.
13. Are there any additional resources or data provided in the Renewable Energy Market in Denmark report?
While the report offers comprehensive insights, it's advisable to review the specific contents or supplementary materials provided to ascertain if additional resources or data are available.
14. How can I stay updated on further developments or reports in the Renewable Energy Market in Denmark?
To stay informed about further developments, trends, and reports in the Renewable Energy Market in Denmark, consider subscribing to industry newsletters, following relevant companies and organizations, or regularly checking reputable industry news sources and publications.
Methodology
Step 1 - Identification of Relevant Samples Size from Population Database


Step 2 - Approaches for Defining Global Market Size (Value, Volume* & Price*)

Note*: In applicable scenarios
Step 3 - Data Sources
Primary Research
- Web Analytics
- Survey Reports
- Research Institute
- Latest Research Reports
- Opinion Leaders
Secondary Research
- Annual Reports
- White Paper
- Latest Press Release
- Industry Association
- Paid Database
- Investor Presentations

Step 4 - Data Triangulation
Involves using different sources of information in order to increase the validity of a study
These sources are likely to be stakeholders in a program - participants, other researchers, program staff, other community members, and so on.
Then we put all data in single framework & apply various statistical tools to find out the dynamic on the market.
During the analysis stage, feedback from the stakeholder groups would be compared to determine areas of agreement as well as areas of divergence
