

Key Insights
The global robotic machine sensor market, valued at $1.91 billion in 2023, is poised for significant expansion. Driven by escalating automation in manufacturing, automotive, and logistics, the market is projected to grow at a Compound Annual Growth Rate (CAGR) of 8.7%. This growth is underpinned by the increasing demand for advanced sensor technologies that enhance robotic precision, speed, and operational efficiency. Key market catalysts include the widespread adoption of Industry 4.0, the imperative for superior quality control, and the rising deployment of collaborative robots (cobots) necessitating sophisticated sensor integration for safe human-robot collaboration. The market is segmented by sensor type (e.g., vision, proximity, force/torque), application (e.g., welding, assembly, material handling), and geography. Leading innovators such as Cognex, Keyence, and SICK AG are spearheading advancements through cutting-edge sensor technologies and strategic alliances, further propelling market expansion. Potential challenges include the substantial initial investment for robotic sensor integration and the requirement for a skilled workforce.
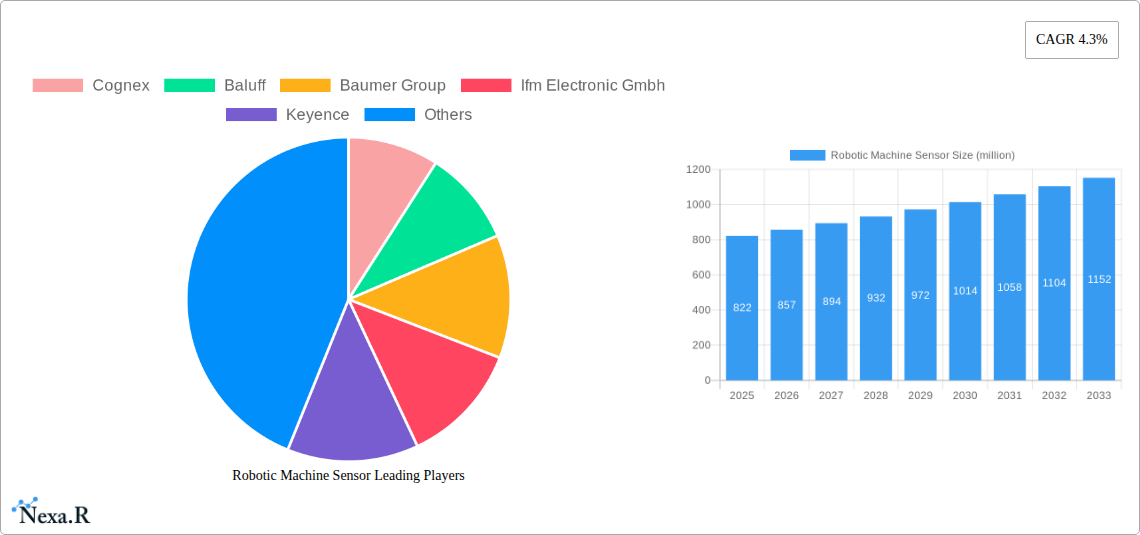
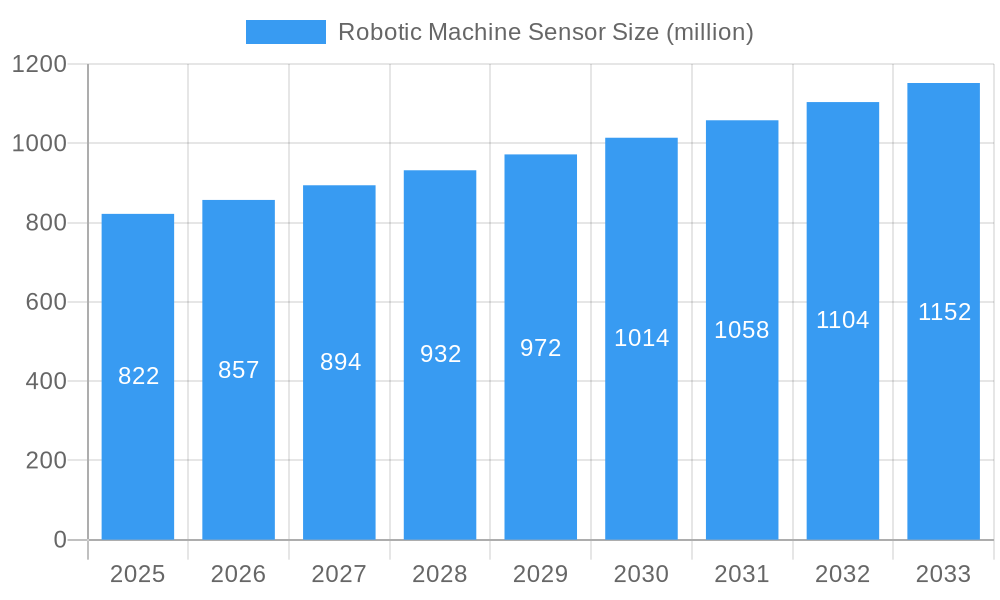
Robotic Machine Sensor Market Size (In Billion)
The long-term trajectory for the robotic machine sensor market remains exceptionally promising. Continuous advancements in Artificial Intelligence (AI) and Machine Learning (ML) will augment robotic sensor capabilities, leading to enhanced accuracy, data processing, and decision-making. The growing integration of cloud-based data analytics platforms will optimize robotic sensor data utilization and enable predictive maintenance, thereby minimizing downtime and maximizing operational efficiency. This trend is anticipated to be particularly impactful in the automotive and electronics manufacturing sectors, where precision and speed are paramount. Furthermore, supportive government initiatives promoting automation and Industry 4.0 adoption globally will continue to foster robust market growth throughout the forecast period.
Robotic Machine Sensor Company Market Share
Robotic Machine Sensor Market Report: 2019-2033
This comprehensive report provides an in-depth analysis of the global Robotic Machine Sensor market, encompassing market dynamics, growth trends, regional dominance, product landscape, key players, and future outlook. The study period covers 2019-2033, with a base year of 2025 and a forecast period of 2025-2033. The report segments the market by various types of sensors used in robotic applications and across multiple end-use industries, providing granular insights for informed decision-making. This report is invaluable for industry professionals, investors, and strategic planners seeking a thorough understanding of this rapidly evolving market. The market size in 2025 is estimated at $XX billion.
Robotic Machine Sensor Market Dynamics & Structure
The global robotic machine sensor market exhibits a moderately concentrated landscape, with key players like Cognex, Balluff, Baumer Group, ifm electronic gmbh, Keyence, and Rockwell Automation holding significant market share. Technological innovation, driven by advancements in AI, machine learning, and miniaturization, is a primary growth driver. Stringent safety regulations in industrial automation are shaping market dynamics, while competitive pressures from substitute technologies like vision systems and proximity sensors are creating market disruption. The market is witnessing significant M&A activity, with an estimated xx deals concluded in the past five years, consolidating market share amongst larger players. End-user demographics are shifting towards greater adoption in diverse industries, including automotive, electronics, and logistics.
- Market Concentration: Moderately concentrated, with top 5 players holding approximately xx% market share in 2025.
- Technological Innovation: Advancements in sensor technologies (e.g., LiDAR, 3D vision) are key drivers.
- Regulatory Landscape: Stringent safety standards and industry regulations influence market growth.
- Competitive Landscape: Intense competition among established players and emerging startups.
- M&A Activity: xx M&A deals observed during 2019-2024, leading to consolidation.
- Innovation Barriers: High R&D costs, integration challenges, and skills gap hinder innovation.
Robotic Machine Sensor Growth Trends & Insights
The robotic machine sensor market experienced robust growth during the historical period (2019-2024), exhibiting a CAGR of xx%. This growth is attributable to increasing automation across various industries, coupled with the rising adoption of Industry 4.0 technologies. The market is projected to continue its expansion during the forecast period (2025-2033), driven by the increasing demand for advanced robotics in manufacturing, logistics, and healthcare. Technological disruptions, particularly the integration of AI and machine learning in sensor systems, are enhancing efficiency and creating new application possibilities. Consumer behavior is shifting towards greater preference for sophisticated sensor systems capable of real-time data analysis and predictive maintenance. Market penetration is projected to reach xx% by 2033, driven by the increasing affordability and availability of sophisticated sensor solutions. The market size is expected to reach $XX billion by 2033.
Dominant Regions, Countries, or Segments in Robotic Machine Sensor
North America currently holds the largest market share in the robotic machine sensor market, driven by high automation rates in industries like automotive and electronics. Asia-Pacific is expected to witness the fastest growth rate during the forecast period, fueled by rapid industrialization and significant investments in robotics and automation in countries like China, Japan, and South Korea. The automotive industry remains the largest end-use segment, but increasing demand from other sectors like logistics and healthcare is expected to further diversify the market.
- Key Drivers in North America: High automation adoption, robust industrial base, and technological advancements.
- Key Drivers in Asia-Pacific: Rapid industrialization, government initiatives promoting automation, and cost-effective manufacturing.
- Key Drivers in Europe: Strong focus on Industry 4.0, well-established automotive and manufacturing sectors.
- Market Share: North America (xx%), Asia-Pacific (xx%), Europe (xx%), Rest of World (xx%) in 2025.
- Growth Potential: Asia-Pacific holds the highest growth potential due to expanding industrialization.
Robotic Machine Sensor Product Landscape
The robotic machine sensor market encompasses a wide range of sensor types, including proximity sensors, vision systems, force/torque sensors, and laser scanners. Product innovation is focused on improving accuracy, speed, and reliability, coupled with advanced data processing capabilities. Unique selling propositions include improved integration with robotic systems, real-time data analytics, and enhanced safety features. Technological advancements like miniaturization, wireless connectivity, and AI-powered data analysis are shaping the product landscape.
Key Drivers, Barriers & Challenges in Robotic Machine Sensor
Key Drivers:
- Increasing automation across various industries (e.g., automotive, electronics, logistics).
- Growing demand for advanced robotics and Industry 4.0 technologies.
- Technological advancements in sensor technology (e.g., AI, miniaturization).
- Government initiatives promoting automation and digitalization.
Key Challenges:
- High initial investment costs associated with sensor integration.
- Supply chain disruptions impacting sensor availability and cost.
- Cybersecurity concerns related to data breaches and system vulnerabilities.
- Skilled labor shortage hindering implementation and maintenance.
Emerging Opportunities in Robotic Machine Sensor
Emerging opportunities lie in the development of AI-powered sensor systems for predictive maintenance, the integration of sensors with cloud-based platforms for real-time data analysis, and the expansion into untapped markets such as agriculture and healthcare. The development of miniaturized and energy-efficient sensors also presents significant growth potential. Increased demand for collaborative robots (cobots) is driving the need for improved safety sensors.
Growth Accelerators in the Robotic Machine Sensor Industry
Technological breakthroughs in sensor technologies, especially AI integration, are primary growth catalysts. Strategic partnerships between sensor manufacturers and robotics companies are accelerating market expansion. Government policies supporting automation and Industry 4.0 are also stimulating growth. Market expansion into new sectors like healthcare and agriculture is driving further growth.
Key Players Shaping the Robotic Machine Sensor Market
Notable Milestones in Robotic Machine Sensor Sector
- 2020: Launch of AI-powered vision system by Cognex.
- 2021: Merger between two sensor manufacturers resulting in expanded product portfolio.
- 2022: Introduction of miniaturized force/torque sensor by ATI Industrial Automation.
- 2023: Development of a new LiDAR sensor technology improving range and accuracy.
- 2024: Increased adoption of wireless sensor technology in industrial robotics.
In-Depth Robotic Machine Sensor Market Outlook
The robotic machine sensor market is poised for sustained growth, fueled by technological advancements, increasing automation, and expanding applications across diverse industries. Strategic partnerships, investments in R&D, and expansion into new geographic markets will shape the future landscape. The market's long-term potential is substantial, driven by the continuing trend towards automation and the increasing demand for smart factories and intelligent systems.
Robotic Machine Sensor Segmentation
-
1. Application
- 1.1. Automotive
- 1.2. Machinery
- 1.3. Aerospace
- 1.4. Electronics Automotive
- 1.5. Others
-
2. Types
- 2.1. Movement Sensor
- 2.2. Vision Sensor
- 2.3. Touch Sensor
- 2.4. Voice Sensor
- 2.5. Others
Robotic Machine Sensor Segmentation By Geography
-
1. North America
- 1.1. United States
- 1.2. Canada
- 1.3. Mexico
-
2. South America
- 2.1. Brazil
- 2.2. Argentina
- 2.3. Rest of South America
-
3. Europe
- 3.1. United Kingdom
- 3.2. Germany
- 3.3. France
- 3.4. Italy
- 3.5. Spain
- 3.6. Russia
- 3.7. Benelux
- 3.8. Nordics
- 3.9. Rest of Europe
-
4. Middle East & Africa
- 4.1. Turkey
- 4.2. Israel
- 4.3. GCC
- 4.4. North Africa
- 4.5. South Africa
- 4.6. Rest of Middle East & Africa
-
5. Asia Pacific
- 5.1. China
- 5.2. India
- 5.3. Japan
- 5.4. South Korea
- 5.5. ASEAN
- 5.6. Oceania
- 5.7. Rest of Asia Pacific

Robotic Machine Sensor Regional Market Share
Geographic Coverage of Robotic Machine Sensor
Robotic Machine Sensor REPORT HIGHLIGHTS
| Aspects | Details |
|---|---|
| Study Period | 2020-2034 |
| Base Year | 2025 |
| Estimated Year | 2026 |
| Forecast Period | 2026-2034 |
| Historical Period | 2020-2025 |
| Growth Rate | CAGR of 8.7% from 2020-2034 |
| Segmentation |
|
Table of Contents
- 1. Introduction
- 1.1. Research Scope
- 1.2. Market Segmentation
- 1.3. Research Objective
- 1.4. Definitions and Assumptions
- 2. Executive Summary
- 2.1. Market Snapshot
- 3. Market Dynamics
- 3.1. Market Drivers
- 3.2. Market Restrains
- 3.3. Market Trends
- 3.4. Market Opportunities
- 4. Market Factor Analysis
- 4.1. Porters Five Forces
- 4.1.1. Bargaining Power of Suppliers
- 4.1.2. Bargaining Power of Buyers
- 4.1.3. Threat of New Entrants
- 4.1.4. Threat of Substitutes
- 4.1.5. Competitive Rivalry
- 4.2. PESTEL analysis
- 4.3. BCG Analysis
- 4.3.1. Stars (High Growth, High Market Share)
- 4.3.2. Cash Cows (Low Growth, High Market Share)
- 4.3.3. Question Mark (High Growth, Low Market Share)
- 4.3.4. Dogs (Low Growth, Low Market Share)
- 4.4. Ansoff Matrix Analysis
- 4.5. Supply Chain Analysis
- 4.6. Regulatory Landscape
- 4.7. Current Market Potential and Opportunity Assessment (TAM–SAM–SOM Framework)
- 4.8. NRP Analyst Note
- 4.1. Porters Five Forces
- 5. Market Analysis, Insights and Forecast 2021-2033
- 5.1. Market Analysis, Insights and Forecast - by Application
- 5.1.1. Automotive
- 5.1.2. Machinery
- 5.1.3. Aerospace
- 5.1.4. Electronics Automotive
- 5.1.5. Others
- 5.2. Market Analysis, Insights and Forecast - by Types
- 5.2.1. Movement Sensor
- 5.2.2. Vision Sensor
- 5.2.3. Touch Sensor
- 5.2.4. Voice Sensor
- 5.2.5. Others
- 5.3. Market Analysis, Insights and Forecast - by Region
- 5.3.1. North America
- 5.3.2. South America
- 5.3.3. Europe
- 5.3.4. Middle East & Africa
- 5.3.5. Asia Pacific
- 5.1. Market Analysis, Insights and Forecast - by Application
- 6. Global Robotic Machine Sensor Analysis, Insights and Forecast, 2021-2033
- 6.1. Market Analysis, Insights and Forecast - by Application
- 6.1.1. Automotive
- 6.1.2. Machinery
- 6.1.3. Aerospace
- 6.1.4. Electronics Automotive
- 6.1.5. Others
- 6.2. Market Analysis, Insights and Forecast - by Types
- 6.2.1. Movement Sensor
- 6.2.2. Vision Sensor
- 6.2.3. Touch Sensor
- 6.2.4. Voice Sensor
- 6.2.5. Others
- 6.1. Market Analysis, Insights and Forecast - by Application
- 7. North America Robotic Machine Sensor Analysis, Insights and Forecast, 2020-2032
- 7.1. Market Analysis, Insights and Forecast - by Application
- 7.1.1. Automotive
- 7.1.2. Machinery
- 7.1.3. Aerospace
- 7.1.4. Electronics Automotive
- 7.1.5. Others
- 7.2. Market Analysis, Insights and Forecast - by Types
- 7.2.1. Movement Sensor
- 7.2.2. Vision Sensor
- 7.2.3. Touch Sensor
- 7.2.4. Voice Sensor
- 7.2.5. Others
- 7.1. Market Analysis, Insights and Forecast - by Application
- 8. South America Robotic Machine Sensor Analysis, Insights and Forecast, 2020-2032
- 8.1. Market Analysis, Insights and Forecast - by Application
- 8.1.1. Automotive
- 8.1.2. Machinery
- 8.1.3. Aerospace
- 8.1.4. Electronics Automotive
- 8.1.5. Others
- 8.2. Market Analysis, Insights and Forecast - by Types
- 8.2.1. Movement Sensor
- 8.2.2. Vision Sensor
- 8.2.3. Touch Sensor
- 8.2.4. Voice Sensor
- 8.2.5. Others
- 8.1. Market Analysis, Insights and Forecast - by Application
- 9. Europe Robotic Machine Sensor Analysis, Insights and Forecast, 2020-2032
- 9.1. Market Analysis, Insights and Forecast - by Application
- 9.1.1. Automotive
- 9.1.2. Machinery
- 9.1.3. Aerospace
- 9.1.4. Electronics Automotive
- 9.1.5. Others
- 9.2. Market Analysis, Insights and Forecast - by Types
- 9.2.1. Movement Sensor
- 9.2.2. Vision Sensor
- 9.2.3. Touch Sensor
- 9.2.4. Voice Sensor
- 9.2.5. Others
- 9.1. Market Analysis, Insights and Forecast - by Application
- 10. Middle East & Africa Robotic Machine Sensor Analysis, Insights and Forecast, 2020-2032
- 10.1. Market Analysis, Insights and Forecast - by Application
- 10.1.1. Automotive
- 10.1.2. Machinery
- 10.1.3. Aerospace
- 10.1.4. Electronics Automotive
- 10.1.5. Others
- 10.2. Market Analysis, Insights and Forecast - by Types
- 10.2.1. Movement Sensor
- 10.2.2. Vision Sensor
- 10.2.3. Touch Sensor
- 10.2.4. Voice Sensor
- 10.2.5. Others
- 10.1. Market Analysis, Insights and Forecast - by Application
- 11. Asia Pacific Robotic Machine Sensor Analysis, Insights and Forecast, 2020-2032
- 11.1. Market Analysis, Insights and Forecast - by Application
- 11.1.1. Automotive
- 11.1.2. Machinery
- 11.1.3. Aerospace
- 11.1.4. Electronics Automotive
- 11.1.5. Others
- 11.2. Market Analysis, Insights and Forecast - by Types
- 11.2.1. Movement Sensor
- 11.2.2. Vision Sensor
- 11.2.3. Touch Sensor
- 11.2.4. Voice Sensor
- 11.2.5. Others
- 11.1. Market Analysis, Insights and Forecast - by Application
- 12. Competitive Analysis
- 12.1. Company Profiles
- 12.1.1 Cognex
- 12.1.1.1. Company Overview
- 12.1.1.2. Products
- 12.1.1.3. Company Financials
- 12.1.1.4. SWOT Analysis
- 12.1.2 Baluff
- 12.1.2.1. Company Overview
- 12.1.2.2. Products
- 12.1.2.3. Company Financials
- 12.1.2.4. SWOT Analysis
- 12.1.3 Baumer Group
- 12.1.3.1. Company Overview
- 12.1.3.2. Products
- 12.1.3.3. Company Financials
- 12.1.3.4. SWOT Analysis
- 12.1.4 Ifm Electronic Gmbh
- 12.1.4.1. Company Overview
- 12.1.4.2. Products
- 12.1.4.3. Company Financials
- 12.1.4.4. SWOT Analysis
- 12.1.5 Keyence
- 12.1.5.1. Company Overview
- 12.1.5.2. Products
- 12.1.5.3. Company Financials
- 12.1.5.4. SWOT Analysis
- 12.1.6 Rockwell Automation
- 12.1.6.1. Company Overview
- 12.1.6.2. Products
- 12.1.6.3. Company Financials
- 12.1.6.4. SWOT Analysis
- 12.1.7 Daihen Corporation
- 12.1.7.1. Company Overview
- 12.1.7.2. Products
- 12.1.7.3. Company Financials
- 12.1.7.4. SWOT Analysis
- 12.1.8 Infineon Technologies
- 12.1.8.1. Company Overview
- 12.1.8.2. Products
- 12.1.8.3. Company Financials
- 12.1.8.4. SWOT Analysis
- 12.1.9 ATI Industrial Automation
- 12.1.9.1. Company Overview
- 12.1.9.2. Products
- 12.1.9.3. Company Financials
- 12.1.9.4. SWOT Analysis
- 12.1.10 Sick Ag
- 12.1.10.1. Company Overview
- 12.1.10.2. Products
- 12.1.10.3. Company Financials
- 12.1.10.4. SWOT Analysis
- 12.1.11 Honeywell
- 12.1.11.1. Company Overview
- 12.1.11.2. Products
- 12.1.11.3. Company Financials
- 12.1.11.4. SWOT Analysis
- 12.1.12 Datalogic
- 12.1.12.1. Company Overview
- 12.1.12.2. Products
- 12.1.12.3. Company Financials
- 12.1.12.4. SWOT Analysis
- 12.1.13 Texas Instruments
- 12.1.13.1. Company Overview
- 12.1.13.2. Products
- 12.1.13.3. Company Financials
- 12.1.13.4. SWOT Analysis
- 12.1.14 TDK
- 12.1.14.1. Company Overview
- 12.1.14.2. Products
- 12.1.14.3. Company Financials
- 12.1.14.4. SWOT Analysis
- 12.1.15 Sensopart
- 12.1.15.1. Company Overview
- 12.1.15.2. Products
- 12.1.15.3. Company Financials
- 12.1.15.4. SWOT Analysis
- 12.1.1 Cognex
- 12.2. Market Entropy
- 12.2.1 Company's Key Areas Served
- 12.2.2 Recent Developments
- 12.3. Company Market Share Analysis 2025
- 12.3.1 Top 5 Companies Market Share Analysis
- 12.3.2 Top 3 Companies Market Share Analysis
- 12.4. List of Potential Customers
- 13. Research Methodology
List of Figures
- Figure 1: Global Robotic Machine Sensor Revenue Breakdown (billion, %) by Region 2025 & 2033
- Figure 2: Global Robotic Machine Sensor Volume Breakdown (K, %) by Region 2025 & 2033
- Figure 3: North America Robotic Machine Sensor Revenue (billion), by Application 2025 & 2033
- Figure 4: North America Robotic Machine Sensor Volume (K), by Application 2025 & 2033
- Figure 5: North America Robotic Machine Sensor Revenue Share (%), by Application 2025 & 2033
- Figure 6: North America Robotic Machine Sensor Volume Share (%), by Application 2025 & 2033
- Figure 7: North America Robotic Machine Sensor Revenue (billion), by Types 2025 & 2033
- Figure 8: North America Robotic Machine Sensor Volume (K), by Types 2025 & 2033
- Figure 9: North America Robotic Machine Sensor Revenue Share (%), by Types 2025 & 2033
- Figure 10: North America Robotic Machine Sensor Volume Share (%), by Types 2025 & 2033
- Figure 11: North America Robotic Machine Sensor Revenue (billion), by Country 2025 & 2033
- Figure 12: North America Robotic Machine Sensor Volume (K), by Country 2025 & 2033
- Figure 13: North America Robotic Machine Sensor Revenue Share (%), by Country 2025 & 2033
- Figure 14: North America Robotic Machine Sensor Volume Share (%), by Country 2025 & 2033
- Figure 15: South America Robotic Machine Sensor Revenue (billion), by Application 2025 & 2033
- Figure 16: South America Robotic Machine Sensor Volume (K), by Application 2025 & 2033
- Figure 17: South America Robotic Machine Sensor Revenue Share (%), by Application 2025 & 2033
- Figure 18: South America Robotic Machine Sensor Volume Share (%), by Application 2025 & 2033
- Figure 19: South America Robotic Machine Sensor Revenue (billion), by Types 2025 & 2033
- Figure 20: South America Robotic Machine Sensor Volume (K), by Types 2025 & 2033
- Figure 21: South America Robotic Machine Sensor Revenue Share (%), by Types 2025 & 2033
- Figure 22: South America Robotic Machine Sensor Volume Share (%), by Types 2025 & 2033
- Figure 23: South America Robotic Machine Sensor Revenue (billion), by Country 2025 & 2033
- Figure 24: South America Robotic Machine Sensor Volume (K), by Country 2025 & 2033
- Figure 25: South America Robotic Machine Sensor Revenue Share (%), by Country 2025 & 2033
- Figure 26: South America Robotic Machine Sensor Volume Share (%), by Country 2025 & 2033
- Figure 27: Europe Robotic Machine Sensor Revenue (billion), by Application 2025 & 2033
- Figure 28: Europe Robotic Machine Sensor Volume (K), by Application 2025 & 2033
- Figure 29: Europe Robotic Machine Sensor Revenue Share (%), by Application 2025 & 2033
- Figure 30: Europe Robotic Machine Sensor Volume Share (%), by Application 2025 & 2033
- Figure 31: Europe Robotic Machine Sensor Revenue (billion), by Types 2025 & 2033
- Figure 32: Europe Robotic Machine Sensor Volume (K), by Types 2025 & 2033
- Figure 33: Europe Robotic Machine Sensor Revenue Share (%), by Types 2025 & 2033
- Figure 34: Europe Robotic Machine Sensor Volume Share (%), by Types 2025 & 2033
- Figure 35: Europe Robotic Machine Sensor Revenue (billion), by Country 2025 & 2033
- Figure 36: Europe Robotic Machine Sensor Volume (K), by Country 2025 & 2033
- Figure 37: Europe Robotic Machine Sensor Revenue Share (%), by Country 2025 & 2033
- Figure 38: Europe Robotic Machine Sensor Volume Share (%), by Country 2025 & 2033
- Figure 39: Middle East & Africa Robotic Machine Sensor Revenue (billion), by Application 2025 & 2033
- Figure 40: Middle East & Africa Robotic Machine Sensor Volume (K), by Application 2025 & 2033
- Figure 41: Middle East & Africa Robotic Machine Sensor Revenue Share (%), by Application 2025 & 2033
- Figure 42: Middle East & Africa Robotic Machine Sensor Volume Share (%), by Application 2025 & 2033
- Figure 43: Middle East & Africa Robotic Machine Sensor Revenue (billion), by Types 2025 & 2033
- Figure 44: Middle East & Africa Robotic Machine Sensor Volume (K), by Types 2025 & 2033
- Figure 45: Middle East & Africa Robotic Machine Sensor Revenue Share (%), by Types 2025 & 2033
- Figure 46: Middle East & Africa Robotic Machine Sensor Volume Share (%), by Types 2025 & 2033
- Figure 47: Middle East & Africa Robotic Machine Sensor Revenue (billion), by Country 2025 & 2033
- Figure 48: Middle East & Africa Robotic Machine Sensor Volume (K), by Country 2025 & 2033
- Figure 49: Middle East & Africa Robotic Machine Sensor Revenue Share (%), by Country 2025 & 2033
- Figure 50: Middle East & Africa Robotic Machine Sensor Volume Share (%), by Country 2025 & 2033
- Figure 51: Asia Pacific Robotic Machine Sensor Revenue (billion), by Application 2025 & 2033
- Figure 52: Asia Pacific Robotic Machine Sensor Volume (K), by Application 2025 & 2033
- Figure 53: Asia Pacific Robotic Machine Sensor Revenue Share (%), by Application 2025 & 2033
- Figure 54: Asia Pacific Robotic Machine Sensor Volume Share (%), by Application 2025 & 2033
- Figure 55: Asia Pacific Robotic Machine Sensor Revenue (billion), by Types 2025 & 2033
- Figure 56: Asia Pacific Robotic Machine Sensor Volume (K), by Types 2025 & 2033
- Figure 57: Asia Pacific Robotic Machine Sensor Revenue Share (%), by Types 2025 & 2033
- Figure 58: Asia Pacific Robotic Machine Sensor Volume Share (%), by Types 2025 & 2033
- Figure 59: Asia Pacific Robotic Machine Sensor Revenue (billion), by Country 2025 & 2033
- Figure 60: Asia Pacific Robotic Machine Sensor Volume (K), by Country 2025 & 2033
- Figure 61: Asia Pacific Robotic Machine Sensor Revenue Share (%), by Country 2025 & 2033
- Figure 62: Asia Pacific Robotic Machine Sensor Volume Share (%), by Country 2025 & 2033
List of Tables
- Table 1: Global Robotic Machine Sensor Revenue billion Forecast, by Application 2020 & 2033
- Table 2: Global Robotic Machine Sensor Volume K Forecast, by Application 2020 & 2033
- Table 3: Global Robotic Machine Sensor Revenue billion Forecast, by Types 2020 & 2033
- Table 4: Global Robotic Machine Sensor Volume K Forecast, by Types 2020 & 2033
- Table 5: Global Robotic Machine Sensor Revenue billion Forecast, by Region 2020 & 2033
- Table 6: Global Robotic Machine Sensor Volume K Forecast, by Region 2020 & 2033
- Table 7: Global Robotic Machine Sensor Revenue billion Forecast, by Application 2020 & 2033
- Table 8: Global Robotic Machine Sensor Volume K Forecast, by Application 2020 & 2033
- Table 9: Global Robotic Machine Sensor Revenue billion Forecast, by Types 2020 & 2033
- Table 10: Global Robotic Machine Sensor Volume K Forecast, by Types 2020 & 2033
- Table 11: Global Robotic Machine Sensor Revenue billion Forecast, by Country 2020 & 2033
- Table 12: Global Robotic Machine Sensor Volume K Forecast, by Country 2020 & 2033
- Table 13: United States Robotic Machine Sensor Revenue (billion) Forecast, by Application 2020 & 2033
- Table 14: United States Robotic Machine Sensor Volume (K) Forecast, by Application 2020 & 2033
- Table 15: Canada Robotic Machine Sensor Revenue (billion) Forecast, by Application 2020 & 2033
- Table 16: Canada Robotic Machine Sensor Volume (K) Forecast, by Application 2020 & 2033
- Table 17: Mexico Robotic Machine Sensor Revenue (billion) Forecast, by Application 2020 & 2033
- Table 18: Mexico Robotic Machine Sensor Volume (K) Forecast, by Application 2020 & 2033
- Table 19: Global Robotic Machine Sensor Revenue billion Forecast, by Application 2020 & 2033
- Table 20: Global Robotic Machine Sensor Volume K Forecast, by Application 2020 & 2033
- Table 21: Global Robotic Machine Sensor Revenue billion Forecast, by Types 2020 & 2033
- Table 22: Global Robotic Machine Sensor Volume K Forecast, by Types 2020 & 2033
- Table 23: Global Robotic Machine Sensor Revenue billion Forecast, by Country 2020 & 2033
- Table 24: Global Robotic Machine Sensor Volume K Forecast, by Country 2020 & 2033
- Table 25: Brazil Robotic Machine Sensor Revenue (billion) Forecast, by Application 2020 & 2033
- Table 26: Brazil Robotic Machine Sensor Volume (K) Forecast, by Application 2020 & 2033
- Table 27: Argentina Robotic Machine Sensor Revenue (billion) Forecast, by Application 2020 & 2033
- Table 28: Argentina Robotic Machine Sensor Volume (K) Forecast, by Application 2020 & 2033
- Table 29: Rest of South America Robotic Machine Sensor Revenue (billion) Forecast, by Application 2020 & 2033
- Table 30: Rest of South America Robotic Machine Sensor Volume (K) Forecast, by Application 2020 & 2033
- Table 31: Global Robotic Machine Sensor Revenue billion Forecast, by Application 2020 & 2033
- Table 32: Global Robotic Machine Sensor Volume K Forecast, by Application 2020 & 2033
- Table 33: Global Robotic Machine Sensor Revenue billion Forecast, by Types 2020 & 2033
- Table 34: Global Robotic Machine Sensor Volume K Forecast, by Types 2020 & 2033
- Table 35: Global Robotic Machine Sensor Revenue billion Forecast, by Country 2020 & 2033
- Table 36: Global Robotic Machine Sensor Volume K Forecast, by Country 2020 & 2033
- Table 37: United Kingdom Robotic Machine Sensor Revenue (billion) Forecast, by Application 2020 & 2033
- Table 38: United Kingdom Robotic Machine Sensor Volume (K) Forecast, by Application 2020 & 2033
- Table 39: Germany Robotic Machine Sensor Revenue (billion) Forecast, by Application 2020 & 2033
- Table 40: Germany Robotic Machine Sensor Volume (K) Forecast, by Application 2020 & 2033
- Table 41: France Robotic Machine Sensor Revenue (billion) Forecast, by Application 2020 & 2033
- Table 42: France Robotic Machine Sensor Volume (K) Forecast, by Application 2020 & 2033
- Table 43: Italy Robotic Machine Sensor Revenue (billion) Forecast, by Application 2020 & 2033
- Table 44: Italy Robotic Machine Sensor Volume (K) Forecast, by Application 2020 & 2033
- Table 45: Spain Robotic Machine Sensor Revenue (billion) Forecast, by Application 2020 & 2033
- Table 46: Spain Robotic Machine Sensor Volume (K) Forecast, by Application 2020 & 2033
- Table 47: Russia Robotic Machine Sensor Revenue (billion) Forecast, by Application 2020 & 2033
- Table 48: Russia Robotic Machine Sensor Volume (K) Forecast, by Application 2020 & 2033
- Table 49: Benelux Robotic Machine Sensor Revenue (billion) Forecast, by Application 2020 & 2033
- Table 50: Benelux Robotic Machine Sensor Volume (K) Forecast, by Application 2020 & 2033
- Table 51: Nordics Robotic Machine Sensor Revenue (billion) Forecast, by Application 2020 & 2033
- Table 52: Nordics Robotic Machine Sensor Volume (K) Forecast, by Application 2020 & 2033
- Table 53: Rest of Europe Robotic Machine Sensor Revenue (billion) Forecast, by Application 2020 & 2033
- Table 54: Rest of Europe Robotic Machine Sensor Volume (K) Forecast, by Application 2020 & 2033
- Table 55: Global Robotic Machine Sensor Revenue billion Forecast, by Application 2020 & 2033
- Table 56: Global Robotic Machine Sensor Volume K Forecast, by Application 2020 & 2033
- Table 57: Global Robotic Machine Sensor Revenue billion Forecast, by Types 2020 & 2033
- Table 58: Global Robotic Machine Sensor Volume K Forecast, by Types 2020 & 2033
- Table 59: Global Robotic Machine Sensor Revenue billion Forecast, by Country 2020 & 2033
- Table 60: Global Robotic Machine Sensor Volume K Forecast, by Country 2020 & 2033
- Table 61: Turkey Robotic Machine Sensor Revenue (billion) Forecast, by Application 2020 & 2033
- Table 62: Turkey Robotic Machine Sensor Volume (K) Forecast, by Application 2020 & 2033
- Table 63: Israel Robotic Machine Sensor Revenue (billion) Forecast, by Application 2020 & 2033
- Table 64: Israel Robotic Machine Sensor Volume (K) Forecast, by Application 2020 & 2033
- Table 65: GCC Robotic Machine Sensor Revenue (billion) Forecast, by Application 2020 & 2033
- Table 66: GCC Robotic Machine Sensor Volume (K) Forecast, by Application 2020 & 2033
- Table 67: North Africa Robotic Machine Sensor Revenue (billion) Forecast, by Application 2020 & 2033
- Table 68: North Africa Robotic Machine Sensor Volume (K) Forecast, by Application 2020 & 2033
- Table 69: South Africa Robotic Machine Sensor Revenue (billion) Forecast, by Application 2020 & 2033
- Table 70: South Africa Robotic Machine Sensor Volume (K) Forecast, by Application 2020 & 2033
- Table 71: Rest of Middle East & Africa Robotic Machine Sensor Revenue (billion) Forecast, by Application 2020 & 2033
- Table 72: Rest of Middle East & Africa Robotic Machine Sensor Volume (K) Forecast, by Application 2020 & 2033
- Table 73: Global Robotic Machine Sensor Revenue billion Forecast, by Application 2020 & 2033
- Table 74: Global Robotic Machine Sensor Volume K Forecast, by Application 2020 & 2033
- Table 75: Global Robotic Machine Sensor Revenue billion Forecast, by Types 2020 & 2033
- Table 76: Global Robotic Machine Sensor Volume K Forecast, by Types 2020 & 2033
- Table 77: Global Robotic Machine Sensor Revenue billion Forecast, by Country 2020 & 2033
- Table 78: Global Robotic Machine Sensor Volume K Forecast, by Country 2020 & 2033
- Table 79: China Robotic Machine Sensor Revenue (billion) Forecast, by Application 2020 & 2033
- Table 80: China Robotic Machine Sensor Volume (K) Forecast, by Application 2020 & 2033
- Table 81: India Robotic Machine Sensor Revenue (billion) Forecast, by Application 2020 & 2033
- Table 82: India Robotic Machine Sensor Volume (K) Forecast, by Application 2020 & 2033
- Table 83: Japan Robotic Machine Sensor Revenue (billion) Forecast, by Application 2020 & 2033
- Table 84: Japan Robotic Machine Sensor Volume (K) Forecast, by Application 2020 & 2033
- Table 85: South Korea Robotic Machine Sensor Revenue (billion) Forecast, by Application 2020 & 2033
- Table 86: South Korea Robotic Machine Sensor Volume (K) Forecast, by Application 2020 & 2033
- Table 87: ASEAN Robotic Machine Sensor Revenue (billion) Forecast, by Application 2020 & 2033
- Table 88: ASEAN Robotic Machine Sensor Volume (K) Forecast, by Application 2020 & 2033
- Table 89: Oceania Robotic Machine Sensor Revenue (billion) Forecast, by Application 2020 & 2033
- Table 90: Oceania Robotic Machine Sensor Volume (K) Forecast, by Application 2020 & 2033
- Table 91: Rest of Asia Pacific Robotic Machine Sensor Revenue (billion) Forecast, by Application 2020 & 2033
- Table 92: Rest of Asia Pacific Robotic Machine Sensor Volume (K) Forecast, by Application 2020 & 2033
Frequently Asked Questions
1. What is the projected Compound Annual Growth Rate (CAGR) of the Robotic Machine Sensor?
The projected CAGR is approximately 8.7%.
2. Which companies are prominent players in the Robotic Machine Sensor?
Key companies in the market include Cognex, Baluff, Baumer Group, Ifm Electronic Gmbh, Keyence, Rockwell Automation, Daihen Corporation, Infineon Technologies, ATI Industrial Automation, Sick Ag, Honeywell, Datalogic, Texas Instruments, TDK, Sensopart.
3. What are the main segments of the Robotic Machine Sensor?
The market segments include Application, Types.
4. Can you provide details about the market size?
The market size is estimated to be USD 1.91 billion as of 2022.
5. What are some drivers contributing to market growth?
N/A
6. What are the notable trends driving market growth?
N/A
7. Are there any restraints impacting market growth?
N/A
8. Can you provide examples of recent developments in the market?
N/A
9. What pricing options are available for accessing the report?
Pricing options include single-user, multi-user, and enterprise licenses priced at USD 3950.00, USD 5925.00, and USD 7900.00 respectively.
10. Is the market size provided in terms of value or volume?
The market size is provided in terms of value, measured in billion and volume, measured in K.
11. Are there any specific market keywords associated with the report?
Yes, the market keyword associated with the report is "Robotic Machine Sensor," which aids in identifying and referencing the specific market segment covered.
12. How do I determine which pricing option suits my needs best?
The pricing options vary based on user requirements and access needs. Individual users may opt for single-user licenses, while businesses requiring broader access may choose multi-user or enterprise licenses for cost-effective access to the report.
13. Are there any additional resources or data provided in the Robotic Machine Sensor report?
While the report offers comprehensive insights, it's advisable to review the specific contents or supplementary materials provided to ascertain if additional resources or data are available.
14. How can I stay updated on further developments or reports in the Robotic Machine Sensor?
To stay informed about further developments, trends, and reports in the Robotic Machine Sensor, consider subscribing to industry newsletters, following relevant companies and organizations, or regularly checking reputable industry news sources and publications.
Methodology
Step 1 - Identification of Relevant Samples Size from Population Database


Step 2 - Approaches for Defining Global Market Size (Value, Volume* & Price*)

Note*: In applicable scenarios
Step 3 - Data Sources
Primary Research
- Web Analytics
- Survey Reports
- Research Institute
- Latest Research Reports
- Opinion Leaders
Secondary Research
- Annual Reports
- White Paper
- Latest Press Release
- Industry Association
- Paid Database
- Investor Presentations

Step 4 - Data Triangulation
Involves using different sources of information in order to increase the validity of a study
These sources are likely to be stakeholders in a program - participants, other researchers, program staff, other community members, and so on.
Then we put all data in single framework & apply various statistical tools to find out the dynamic on the market.
During the analysis stage, feedback from the stakeholder groups would be compared to determine areas of agreement as well as areas of divergence