

Key Insights
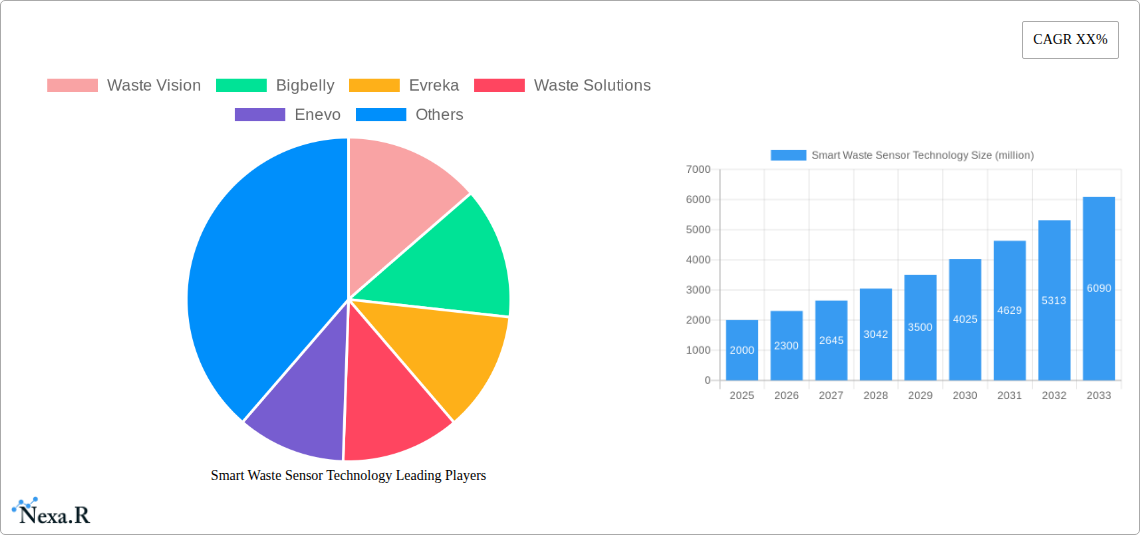
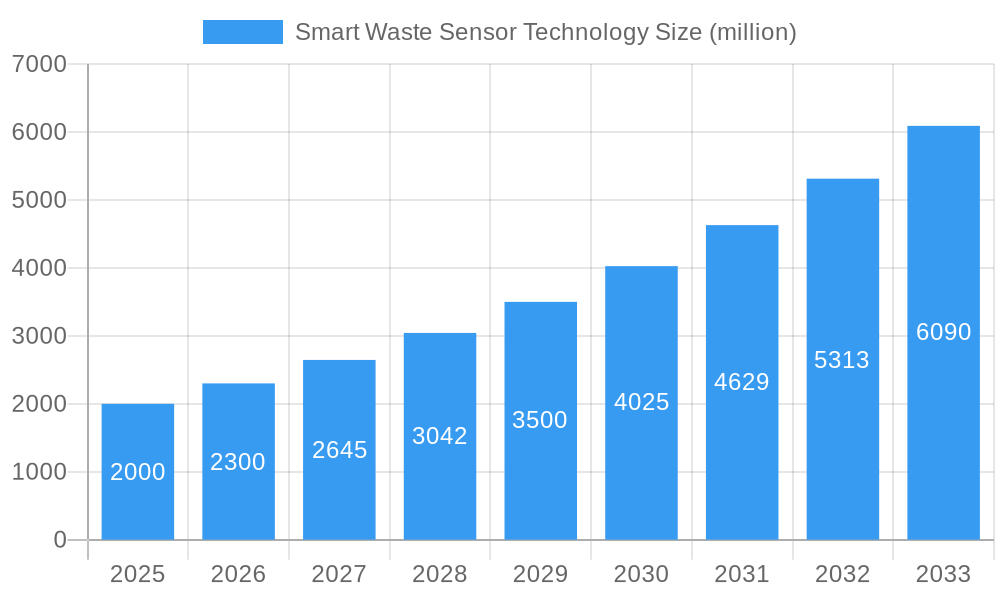
The smart waste sensor technology market is poised for substantial expansion, driven by global urbanization, the imperative for efficient waste management, and escalating environmental consciousness. The market, valued at $3170.5 million in the base year of 2025, is projected to experience a Compound Annual Growth Rate (CAGR) of 6.28% during the forecast period. This growth trajectory is underpinned by several pivotal factors. Smart sensors enhance waste collection efficiency by optimizing routes, reducing fuel consumption, and preventing bin overflows, thereby generating significant cost savings for municipalities and waste management firms. The proliferation of smart city initiatives further bolsters the adoption of sensor-based waste management solutions. Continuous advancements in sensor technology, leading to more reliable, durable, and cost-effective devices, are also key market drivers. Additionally, increasing regulatory mandates aimed at improving waste management practices are accelerating technology deployment.
Smart Waste Sensor Technology Market Size (In Billion)
While the market demonstrates a positive growth outlook, certain challenges persist. The initial investment required for sensor deployment and system integration can present a hurdle for smaller municipalities. Moreover, addressing data security and privacy concerns associated with waste data collection and analysis is crucial. Nevertheless, the overarching benefits of enhanced efficiency, reduced environmental impact, and cost optimization are anticipated to propel sustained market growth. The competitive landscape is dynamic, featuring established companies and emerging innovators, fostering an environment ripe for technological advancement and accelerated adoption of sophisticated smart waste sensor solutions.
Smart Waste Sensor Technology Company Market Share
Smart Waste Sensor Technology Market Report: 2019-2033
This comprehensive report provides an in-depth analysis of the Smart Waste Sensor Technology market, encompassing market dynamics, growth trends, regional analysis, product landscape, key players, and future outlook. The study period covers 2019-2033, with 2025 as the base and estimated year, and a forecast period of 2025-2033. The historical period analyzed is 2019-2024. This report is essential for waste management companies, technology providers, investors, and government agencies seeking to understand and capitalize on opportunities within this rapidly evolving sector. The parent market is the broader waste management industry (valued at xx million units in 2025), while the child market is smart city infrastructure.
Smart Waste Sensor Technology Market Dynamics & Structure
The Smart Waste Sensor Technology market is characterized by moderate concentration, with key players holding significant but not dominant market share. In 2025, the top 5 players held an estimated xx% of the market, highlighting opportunities for both established and emerging companies. Technological innovation, driven by advancements in IoT, AI, and sensor technology, is a primary growth driver. Stringent environmental regulations and the increasing focus on smart city initiatives are also fueling market expansion. Competitive substitutes include traditional waste collection methods, but smart sensor technology offers superior efficiency and data-driven optimization, creating a strong competitive advantage. The end-user demographic encompasses municipalities, commercial businesses, and industrial facilities. M&A activity has been moderate, with approximately xx deals recorded between 2019-2024, indicating ongoing consolidation within the sector.
- Market Concentration: Moderately concentrated, top 5 players holding approximately xx% market share (2025).
- Technological Innovation: Advancements in IoT, AI, and sensor miniaturization are key drivers.
- Regulatory Framework: Stringent environmental regulations promote adoption.
- Competitive Substitutes: Traditional waste collection methods, but smart sensors offer superior efficiency.
- End-User Demographics: Municipalities, commercial businesses, and industrial facilities.
- M&A Trends: Moderate activity with xx deals between 2019 and 2024.
- Innovation Barriers: High initial investment costs, integration complexities, and data security concerns.
Smart Waste Sensor Technology Growth Trends & Insights
The Smart Waste Sensor Technology market exhibits robust growth, driven by increasing urbanization, rising environmental awareness, and the need for efficient waste management solutions. The market size is projected to reach xx million units by 2033, exhibiting a CAGR of xx% during the forecast period (2025-2033). Adoption rates are steadily increasing, particularly in developed economies, reflecting a shift towards data-driven waste management practices. Technological disruptions, such as the integration of AI-powered analytics and predictive modeling, are further enhancing the value proposition of smart waste sensors. Consumer behavior shifts, including increased demand for sustainability and transparency, are also contributing to market growth. Market penetration is expected to reach xx% by 2033.
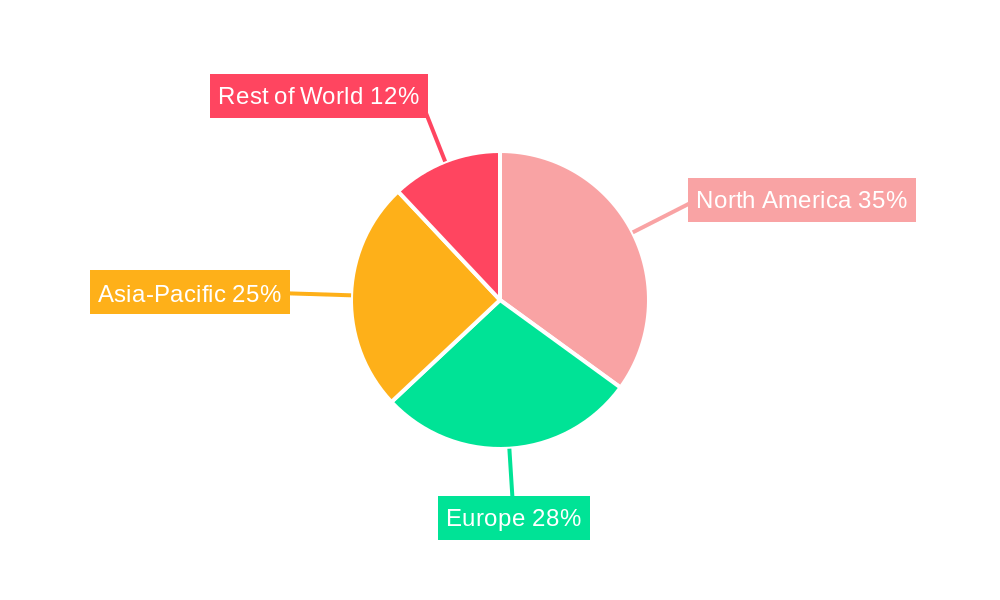
Dominant Regions, Countries, or Segments in Smart Waste Sensor Technology
North America currently holds the largest market share, driven by strong government support for smart city initiatives and a high level of technological adoption. Europe follows closely, with a focus on sustainable waste management practices. The Asia-Pacific region is experiencing rapid growth, fueled by increasing urbanization and government investments in infrastructure development. Specific countries such as the US, Germany, China, and Japan are key contributors to this growth.
- Key Drivers:
- North America: Strong government support, high technological adoption.
- Europe: Focus on sustainability, stringent environmental regulations.
- Asia-Pacific: Rapid urbanization, infrastructure development.
- Dominance Factors: Early adoption, supportive regulatory environments, and high technological readiness.
- Growth Potential: Asia-Pacific offers significant long-term growth potential due to urbanization.
Smart Waste Sensor Technology Product Landscape
Smart waste sensor technology encompasses a range of products, including fill-level sensors, weight sensors, and GPS tracking devices. These sensors are integrated into smart bins and containers, providing real-time data on waste levels, enabling optimized collection routes, and reducing operational costs. Recent innovations focus on advanced analytics, predictive modeling, and integration with existing waste management systems. Unique selling propositions include improved efficiency, reduced operational costs, and enhanced environmental sustainability. Technological advancements include the use of low-power wide-area networks (LPWAN) for data transmission and AI-powered analytics for predictive maintenance.
Key Drivers, Barriers & Challenges in Smart Waste Sensor Technology
Key Drivers: Increasing urbanization, rising environmental concerns, the need for efficient waste management, government initiatives promoting smart cities, and advancements in sensor technologies. The cost savings associated with optimized waste collection routes are also significant drivers.
Key Challenges: High initial investment costs, integration complexities with existing waste management infrastructure, data security and privacy concerns, and the need for robust communication networks in remote areas.
Emerging Opportunities in Smart Waste Sensor Technology
Emerging opportunities include expansion into untapped markets in developing countries, the integration of smart sensors with other smart city technologies (e.g., traffic management systems), and the development of more sophisticated analytical tools for predictive maintenance and waste reduction strategies. The focus on waste segregation and recycling is also presenting new opportunities.
Growth Accelerators in the Smart Waste Sensor Technology Industry
Technological breakthroughs, such as the development of more energy-efficient sensors and improved data analytics capabilities, are key growth catalysts. Strategic partnerships between technology providers and waste management companies facilitate market penetration and adoption. Government incentives and policies promoting smart city development are also important accelerators, fostering innovation and investment in the sector.
Key Players Shaping the Smart Waste Sensor Technology Market
Notable Milestones in Smart Waste Sensor Technology Sector
- 2020: Introduction of AI-powered predictive analytics by Enevo.
- 2021: Waste Vision launches a new line of low-power sensors.
- 2022: Bigbelly acquires a smaller sensor technology company.
- 2023: Compology secures significant funding for expansion.
- 2024: Several municipalities implement large-scale smart waste management programs.
In-Depth Smart Waste Sensor Technology Market Outlook
The Smart Waste Sensor Technology market is poised for continued robust growth, driven by ongoing technological advancements, increasing environmental awareness, and supportive government policies. Opportunities exist for companies that can offer innovative solutions, integrate with existing infrastructure, and effectively address data security concerns. Strategic partnerships and investments in R&D will be critical for success in this dynamic market. The focus on sustainability and data-driven decision-making will further propel market expansion in the coming years.
Smart Waste Sensor Technology Segmentation
-
1. Application
- 1.1. Industrial Waste
- 1.2. Municipal Waste
-
2. Types
- 2.1. Cellular LPWA
- 2.2. Cellular 2G/3G/4G
Smart Waste Sensor Technology Segmentation By Geography
-
1. North America
- 1.1. United States
- 1.2. Canada
- 1.3. Mexico
-
2. South America
- 2.1. Brazil
- 2.2. Argentina
- 2.3. Rest of South America
-
3. Europe
- 3.1. United Kingdom
- 3.2. Germany
- 3.3. France
- 3.4. Italy
- 3.5. Spain
- 3.6. Russia
- 3.7. Benelux
- 3.8. Nordics
- 3.9. Rest of Europe
-
4. Middle East & Africa
- 4.1. Turkey
- 4.2. Israel
- 4.3. GCC
- 4.4. North Africa
- 4.5. South Africa
- 4.6. Rest of Middle East & Africa
-
5. Asia Pacific
- 5.1. China
- 5.2. India
- 5.3. Japan
- 5.4. South Korea
- 5.5. ASEAN
- 5.6. Oceania
- 5.7. Rest of Asia Pacific
Smart Waste Sensor Technology Regional Market Share
Geographic Coverage of Smart Waste Sensor Technology
Smart Waste Sensor Technology REPORT HIGHLIGHTS
| Aspects | Details |
|---|---|
| Study Period | 2020-2034 |
| Base Year | 2025 |
| Estimated Year | 2026 |
| Forecast Period | 2026-2034 |
| Historical Period | 2020-2025 |
| Growth Rate | CAGR of 6.28% from 2020-2034 |
| Segmentation |
|
Table of Contents
- 1. Introduction
- 1.1. Research Scope
- 1.2. Market Segmentation
- 1.3. Research Objective
- 1.4. Definitions and Assumptions
- 2. Executive Summary
- 2.1. Market Snapshot
- 3. Market Dynamics
- 3.1. Market Drivers
- 3.2. Market Restrains
- 3.3. Market Trends
- 3.4. Market Opportunities
- 4. Market Factor Analysis
- 4.1. Porters Five Forces
- 4.1.1. Bargaining Power of Suppliers
- 4.1.2. Bargaining Power of Buyers
- 4.1.3. Threat of New Entrants
- 4.1.4. Threat of Substitutes
- 4.1.5. Competitive Rivalry
- 4.2. PESTEL analysis
- 4.3. BCG Analysis
- 4.3.1. Stars (High Growth, High Market Share)
- 4.3.2. Cash Cows (Low Growth, High Market Share)
- 4.3.3. Question Mark (High Growth, Low Market Share)
- 4.3.4. Dogs (Low Growth, Low Market Share)
- 4.4. Ansoff Matrix Analysis
- 4.5. Supply Chain Analysis
- 4.6. Regulatory Landscape
- 4.7. Current Market Potential and Opportunity Assessment (TAM–SAM–SOM Framework)
- 4.8. NRP Analyst Note
- 4.1. Porters Five Forces
- 5. Market Analysis, Insights and Forecast 2021-2033
- 5.1. Market Analysis, Insights and Forecast - by Application
- 5.1.1. Industrial Waste
- 5.1.2. Municipal Waste
- 5.2. Market Analysis, Insights and Forecast - by Types
- 5.2.1. Cellular LPWA
- 5.2.2. Cellular 2G/3G/4G
- 5.3. Market Analysis, Insights and Forecast - by Region
- 5.3.1. North America
- 5.3.2. South America
- 5.3.3. Europe
- 5.3.4. Middle East & Africa
- 5.3.5. Asia Pacific
- 5.1. Market Analysis, Insights and Forecast - by Application
- 6. Global Smart Waste Sensor Technology Analysis, Insights and Forecast, 2021-2033
- 6.1. Market Analysis, Insights and Forecast - by Application
- 6.1.1. Industrial Waste
- 6.1.2. Municipal Waste
- 6.2. Market Analysis, Insights and Forecast - by Types
- 6.2.1. Cellular LPWA
- 6.2.2. Cellular 2G/3G/4G
- 6.1. Market Analysis, Insights and Forecast - by Application
- 7. North America Smart Waste Sensor Technology Analysis, Insights and Forecast, 2020-2032
- 7.1. Market Analysis, Insights and Forecast - by Application
- 7.1.1. Industrial Waste
- 7.1.2. Municipal Waste
- 7.2. Market Analysis, Insights and Forecast - by Types
- 7.2.1. Cellular LPWA
- 7.2.2. Cellular 2G/3G/4G
- 7.1. Market Analysis, Insights and Forecast - by Application
- 8. South America Smart Waste Sensor Technology Analysis, Insights and Forecast, 2020-2032
- 8.1. Market Analysis, Insights and Forecast - by Application
- 8.1.1. Industrial Waste
- 8.1.2. Municipal Waste
- 8.2. Market Analysis, Insights and Forecast - by Types
- 8.2.1. Cellular LPWA
- 8.2.2. Cellular 2G/3G/4G
- 8.1. Market Analysis, Insights and Forecast - by Application
- 9. Europe Smart Waste Sensor Technology Analysis, Insights and Forecast, 2020-2032
- 9.1. Market Analysis, Insights and Forecast - by Application
- 9.1.1. Industrial Waste
- 9.1.2. Municipal Waste
- 9.2. Market Analysis, Insights and Forecast - by Types
- 9.2.1. Cellular LPWA
- 9.2.2. Cellular 2G/3G/4G
- 9.1. Market Analysis, Insights and Forecast - by Application
- 10. Middle East & Africa Smart Waste Sensor Technology Analysis, Insights and Forecast, 2020-2032
- 10.1. Market Analysis, Insights and Forecast - by Application
- 10.1.1. Industrial Waste
- 10.1.2. Municipal Waste
- 10.2. Market Analysis, Insights and Forecast - by Types
- 10.2.1. Cellular LPWA
- 10.2.2. Cellular 2G/3G/4G
- 10.1. Market Analysis, Insights and Forecast - by Application
- 11. Asia Pacific Smart Waste Sensor Technology Analysis, Insights and Forecast, 2020-2032
- 11.1. Market Analysis, Insights and Forecast - by Application
- 11.1.1. Industrial Waste
- 11.1.2. Municipal Waste
- 11.2. Market Analysis, Insights and Forecast - by Types
- 11.2.1. Cellular LPWA
- 11.2.2. Cellular 2G/3G/4G
- 11.1. Market Analysis, Insights and Forecast - by Application
- 12. Competitive Analysis
- 12.1. Company Profiles
- 12.1.1 Waste Vision
- 12.1.1.1. Company Overview
- 12.1.1.2. Products
- 12.1.1.3. Company Financials
- 12.1.1.4. SWOT Analysis
- 12.1.2 Bigbelly
- 12.1.2.1. Company Overview
- 12.1.2.2. Products
- 12.1.2.3. Company Financials
- 12.1.2.4. SWOT Analysis
- 12.1.3 Evreka
- 12.1.3.1. Company Overview
- 12.1.3.2. Products
- 12.1.3.3. Company Financials
- 12.1.3.4. SWOT Analysis
- 12.1.4 Waste Solutions
- 12.1.4.1. Company Overview
- 12.1.4.2. Products
- 12.1.4.3. Company Financials
- 12.1.4.4. SWOT Analysis
- 12.1.5 Enevo
- 12.1.5.1. Company Overview
- 12.1.5.2. Products
- 12.1.5.3. Company Financials
- 12.1.5.4. SWOT Analysis
- 12.1.6 Ecube Labs
- 12.1.6.1. Company Overview
- 12.1.6.2. Products
- 12.1.6.3. Company Financials
- 12.1.6.4. SWOT Analysis
- 12.1.7 Sigrenea
- 12.1.7.1. Company Overview
- 12.1.7.2. Products
- 12.1.7.3. Company Financials
- 12.1.7.4. SWOT Analysis
- 12.1.8 Wellness TechGroup
- 12.1.8.1. Company Overview
- 12.1.8.2. Products
- 12.1.8.3. Company Financials
- 12.1.8.4. SWOT Analysis
- 12.1.9 Waste Harmonics
- 12.1.9.1. Company Overview
- 12.1.9.2. Products
- 12.1.9.3. Company Financials
- 12.1.9.4. SWOT Analysis
- 12.1.10 Compology
- 12.1.10.1. Company Overview
- 12.1.10.2. Products
- 12.1.10.3. Company Financials
- 12.1.10.4. SWOT Analysis
- 12.1.11 Tekelek
- 12.1.11.1. Company Overview
- 12.1.11.2. Products
- 12.1.11.3. Company Financials
- 12.1.11.4. SWOT Analysis
- 12.1.12 BH Technologies
- 12.1.12.1. Company Overview
- 12.1.12.2. Products
- 12.1.12.3. Company Financials
- 12.1.12.4. SWOT Analysis
- 12.1.13 Mr. Fill
- 12.1.13.1. Company Overview
- 12.1.13.2. Products
- 12.1.13.3. Company Financials
- 12.1.13.4. SWOT Analysis
- 12.1.14 Superfy
- 12.1.14.1. Company Overview
- 12.1.14.2. Products
- 12.1.14.3. Company Financials
- 12.1.14.4. SWOT Analysis
- 12.1.15 BrighterBins
- 12.1.15.1. Company Overview
- 12.1.15.2. Products
- 12.1.15.3. Company Financials
- 12.1.15.4. SWOT Analysis
- 12.1.16 Sensoneo
- 12.1.16.1. Company Overview
- 12.1.16.2. Products
- 12.1.16.3. Company Financials
- 12.1.16.4. SWOT Analysis
- 12.1.17 TST Sistemas
- 12.1.17.1. Company Overview
- 12.1.17.2. Products
- 12.1.17.3. Company Financials
- 12.1.17.4. SWOT Analysis
- 12.1.18 Libelium
- 12.1.18.1. Company Overview
- 12.1.18.2. Products
- 12.1.18.3. Company Financials
- 12.1.18.4. SWOT Analysis
- 12.1.19 Abel Sensors
- 12.1.19.1. Company Overview
- 12.1.19.2. Products
- 12.1.19.3. Company Financials
- 12.1.19.4. SWOT Analysis
- 12.1.20 Faststream
- 12.1.20.1. Company Overview
- 12.1.20.2. Products
- 12.1.20.3. Company Financials
- 12.1.20.4. SWOT Analysis
- 12.1.21 EcoMobile
- 12.1.21.1. Company Overview
- 12.1.21.2. Products
- 12.1.21.3. Company Financials
- 12.1.21.4. SWOT Analysis
- 12.1.22 MaxBotix
- 12.1.22.1. Company Overview
- 12.1.22.2. Products
- 12.1.22.3. Company Financials
- 12.1.22.4. SWOT Analysis
- 12.1.1 Waste Vision
- 12.2. Market Entropy
- 12.2.1 Company's Key Areas Served
- 12.2.2 Recent Developments
- 12.3. Company Market Share Analysis 2025
- 12.3.1 Top 5 Companies Market Share Analysis
- 12.3.2 Top 3 Companies Market Share Analysis
- 12.4. List of Potential Customers
- 13. Research Methodology
List of Figures
- Figure 1: Global Smart Waste Sensor Technology Revenue Breakdown (million, %) by Region 2025 & 2033
- Figure 2: North America Smart Waste Sensor Technology Revenue (million), by Application 2025 & 2033
- Figure 3: North America Smart Waste Sensor Technology Revenue Share (%), by Application 2025 & 2033
- Figure 4: North America Smart Waste Sensor Technology Revenue (million), by Types 2025 & 2033
- Figure 5: North America Smart Waste Sensor Technology Revenue Share (%), by Types 2025 & 2033
- Figure 6: North America Smart Waste Sensor Technology Revenue (million), by Country 2025 & 2033
- Figure 7: North America Smart Waste Sensor Technology Revenue Share (%), by Country 2025 & 2033
- Figure 8: South America Smart Waste Sensor Technology Revenue (million), by Application 2025 & 2033
- Figure 9: South America Smart Waste Sensor Technology Revenue Share (%), by Application 2025 & 2033
- Figure 10: South America Smart Waste Sensor Technology Revenue (million), by Types 2025 & 2033
- Figure 11: South America Smart Waste Sensor Technology Revenue Share (%), by Types 2025 & 2033
- Figure 12: South America Smart Waste Sensor Technology Revenue (million), by Country 2025 & 2033
- Figure 13: South America Smart Waste Sensor Technology Revenue Share (%), by Country 2025 & 2033
- Figure 14: Europe Smart Waste Sensor Technology Revenue (million), by Application 2025 & 2033
- Figure 15: Europe Smart Waste Sensor Technology Revenue Share (%), by Application 2025 & 2033
- Figure 16: Europe Smart Waste Sensor Technology Revenue (million), by Types 2025 & 2033
- Figure 17: Europe Smart Waste Sensor Technology Revenue Share (%), by Types 2025 & 2033
- Figure 18: Europe Smart Waste Sensor Technology Revenue (million), by Country 2025 & 2033
- Figure 19: Europe Smart Waste Sensor Technology Revenue Share (%), by Country 2025 & 2033
- Figure 20: Middle East & Africa Smart Waste Sensor Technology Revenue (million), by Application 2025 & 2033
- Figure 21: Middle East & Africa Smart Waste Sensor Technology Revenue Share (%), by Application 2025 & 2033
- Figure 22: Middle East & Africa Smart Waste Sensor Technology Revenue (million), by Types 2025 & 2033
- Figure 23: Middle East & Africa Smart Waste Sensor Technology Revenue Share (%), by Types 2025 & 2033
- Figure 24: Middle East & Africa Smart Waste Sensor Technology Revenue (million), by Country 2025 & 2033
- Figure 25: Middle East & Africa Smart Waste Sensor Technology Revenue Share (%), by Country 2025 & 2033
- Figure 26: Asia Pacific Smart Waste Sensor Technology Revenue (million), by Application 2025 & 2033
- Figure 27: Asia Pacific Smart Waste Sensor Technology Revenue Share (%), by Application 2025 & 2033
- Figure 28: Asia Pacific Smart Waste Sensor Technology Revenue (million), by Types 2025 & 2033
- Figure 29: Asia Pacific Smart Waste Sensor Technology Revenue Share (%), by Types 2025 & 2033
- Figure 30: Asia Pacific Smart Waste Sensor Technology Revenue (million), by Country 2025 & 2033
- Figure 31: Asia Pacific Smart Waste Sensor Technology Revenue Share (%), by Country 2025 & 2033
List of Tables
- Table 1: Global Smart Waste Sensor Technology Revenue million Forecast, by Application 2020 & 2033
- Table 2: Global Smart Waste Sensor Technology Revenue million Forecast, by Types 2020 & 2033
- Table 3: Global Smart Waste Sensor Technology Revenue million Forecast, by Region 2020 & 2033
- Table 4: Global Smart Waste Sensor Technology Revenue million Forecast, by Application 2020 & 2033
- Table 5: Global Smart Waste Sensor Technology Revenue million Forecast, by Types 2020 & 2033
- Table 6: Global Smart Waste Sensor Technology Revenue million Forecast, by Country 2020 & 2033
- Table 7: United States Smart Waste Sensor Technology Revenue (million) Forecast, by Application 2020 & 2033
- Table 8: Canada Smart Waste Sensor Technology Revenue (million) Forecast, by Application 2020 & 2033
- Table 9: Mexico Smart Waste Sensor Technology Revenue (million) Forecast, by Application 2020 & 2033
- Table 10: Global Smart Waste Sensor Technology Revenue million Forecast, by Application 2020 & 2033
- Table 11: Global Smart Waste Sensor Technology Revenue million Forecast, by Types 2020 & 2033
- Table 12: Global Smart Waste Sensor Technology Revenue million Forecast, by Country 2020 & 2033
- Table 13: Brazil Smart Waste Sensor Technology Revenue (million) Forecast, by Application 2020 & 2033
- Table 14: Argentina Smart Waste Sensor Technology Revenue (million) Forecast, by Application 2020 & 2033
- Table 15: Rest of South America Smart Waste Sensor Technology Revenue (million) Forecast, by Application 2020 & 2033
- Table 16: Global Smart Waste Sensor Technology Revenue million Forecast, by Application 2020 & 2033
- Table 17: Global Smart Waste Sensor Technology Revenue million Forecast, by Types 2020 & 2033
- Table 18: Global Smart Waste Sensor Technology Revenue million Forecast, by Country 2020 & 2033
- Table 19: United Kingdom Smart Waste Sensor Technology Revenue (million) Forecast, by Application 2020 & 2033
- Table 20: Germany Smart Waste Sensor Technology Revenue (million) Forecast, by Application 2020 & 2033
- Table 21: France Smart Waste Sensor Technology Revenue (million) Forecast, by Application 2020 & 2033
- Table 22: Italy Smart Waste Sensor Technology Revenue (million) Forecast, by Application 2020 & 2033
- Table 23: Spain Smart Waste Sensor Technology Revenue (million) Forecast, by Application 2020 & 2033
- Table 24: Russia Smart Waste Sensor Technology Revenue (million) Forecast, by Application 2020 & 2033
- Table 25: Benelux Smart Waste Sensor Technology Revenue (million) Forecast, by Application 2020 & 2033
- Table 26: Nordics Smart Waste Sensor Technology Revenue (million) Forecast, by Application 2020 & 2033
- Table 27: Rest of Europe Smart Waste Sensor Technology Revenue (million) Forecast, by Application 2020 & 2033
- Table 28: Global Smart Waste Sensor Technology Revenue million Forecast, by Application 2020 & 2033
- Table 29: Global Smart Waste Sensor Technology Revenue million Forecast, by Types 2020 & 2033
- Table 30: Global Smart Waste Sensor Technology Revenue million Forecast, by Country 2020 & 2033
- Table 31: Turkey Smart Waste Sensor Technology Revenue (million) Forecast, by Application 2020 & 2033
- Table 32: Israel Smart Waste Sensor Technology Revenue (million) Forecast, by Application 2020 & 2033
- Table 33: GCC Smart Waste Sensor Technology Revenue (million) Forecast, by Application 2020 & 2033
- Table 34: North Africa Smart Waste Sensor Technology Revenue (million) Forecast, by Application 2020 & 2033
- Table 35: South Africa Smart Waste Sensor Technology Revenue (million) Forecast, by Application 2020 & 2033
- Table 36: Rest of Middle East & Africa Smart Waste Sensor Technology Revenue (million) Forecast, by Application 2020 & 2033
- Table 37: Global Smart Waste Sensor Technology Revenue million Forecast, by Application 2020 & 2033
- Table 38: Global Smart Waste Sensor Technology Revenue million Forecast, by Types 2020 & 2033
- Table 39: Global Smart Waste Sensor Technology Revenue million Forecast, by Country 2020 & 2033
- Table 40: China Smart Waste Sensor Technology Revenue (million) Forecast, by Application 2020 & 2033
- Table 41: India Smart Waste Sensor Technology Revenue (million) Forecast, by Application 2020 & 2033
- Table 42: Japan Smart Waste Sensor Technology Revenue (million) Forecast, by Application 2020 & 2033
- Table 43: South Korea Smart Waste Sensor Technology Revenue (million) Forecast, by Application 2020 & 2033
- Table 44: ASEAN Smart Waste Sensor Technology Revenue (million) Forecast, by Application 2020 & 2033
- Table 45: Oceania Smart Waste Sensor Technology Revenue (million) Forecast, by Application 2020 & 2033
- Table 46: Rest of Asia Pacific Smart Waste Sensor Technology Revenue (million) Forecast, by Application 2020 & 2033
Frequently Asked Questions
1. What is the projected Compound Annual Growth Rate (CAGR) of the Smart Waste Sensor Technology?
The projected CAGR is approximately 6.28%.
2. Which companies are prominent players in the Smart Waste Sensor Technology?
Key companies in the market include Waste Vision, Bigbelly, Evreka, Waste Solutions, Enevo, Ecube Labs, Sigrenea, Wellness TechGroup, Waste Harmonics, Compology, Tekelek, BH Technologies, Mr. Fill, Superfy, BrighterBins, Sensoneo, TST Sistemas, Libelium, Abel Sensors, Faststream, EcoMobile, MaxBotix.
3. What are the main segments of the Smart Waste Sensor Technology?
The market segments include Application, Types.
4. Can you provide details about the market size?
The market size is estimated to be USD 3170.5 million as of 2022.
5. What are some drivers contributing to market growth?
N/A
6. What are the notable trends driving market growth?
N/A
7. Are there any restraints impacting market growth?
N/A
8. Can you provide examples of recent developments in the market?
N/A
9. What pricing options are available for accessing the report?
Pricing options include single-user, multi-user, and enterprise licenses priced at USD 4900.00, USD 7350.00, and USD 9800.00 respectively.
10. Is the market size provided in terms of value or volume?
The market size is provided in terms of value, measured in million.
11. Are there any specific market keywords associated with the report?
Yes, the market keyword associated with the report is "Smart Waste Sensor Technology," which aids in identifying and referencing the specific market segment covered.
12. How do I determine which pricing option suits my needs best?
The pricing options vary based on user requirements and access needs. Individual users may opt for single-user licenses, while businesses requiring broader access may choose multi-user or enterprise licenses for cost-effective access to the report.
13. Are there any additional resources or data provided in the Smart Waste Sensor Technology report?
While the report offers comprehensive insights, it's advisable to review the specific contents or supplementary materials provided to ascertain if additional resources or data are available.
14. How can I stay updated on further developments or reports in the Smart Waste Sensor Technology?
To stay informed about further developments, trends, and reports in the Smart Waste Sensor Technology, consider subscribing to industry newsletters, following relevant companies and organizations, or regularly checking reputable industry news sources and publications.
Methodology
Step 1 - Identification of Relevant Samples Size from Population Database


Step 2 - Approaches for Defining Global Market Size (Value, Volume* & Price*)

Note*: In applicable scenarios
Step 3 - Data Sources
Primary Research
- Web Analytics
- Survey Reports
- Research Institute
- Latest Research Reports
- Opinion Leaders
Secondary Research
- Annual Reports
- White Paper
- Latest Press Release
- Industry Association
- Paid Database
- Investor Presentations

Step 4 - Data Triangulation
Involves using different sources of information in order to increase the validity of a study
These sources are likely to be stakeholders in a program - participants, other researchers, program staff, other community members, and so on.
Then we put all data in single framework & apply various statistical tools to find out the dynamic on the market.
During the analysis stage, feedback from the stakeholder groups would be compared to determine areas of agreement as well as areas of divergence