

Key Insights
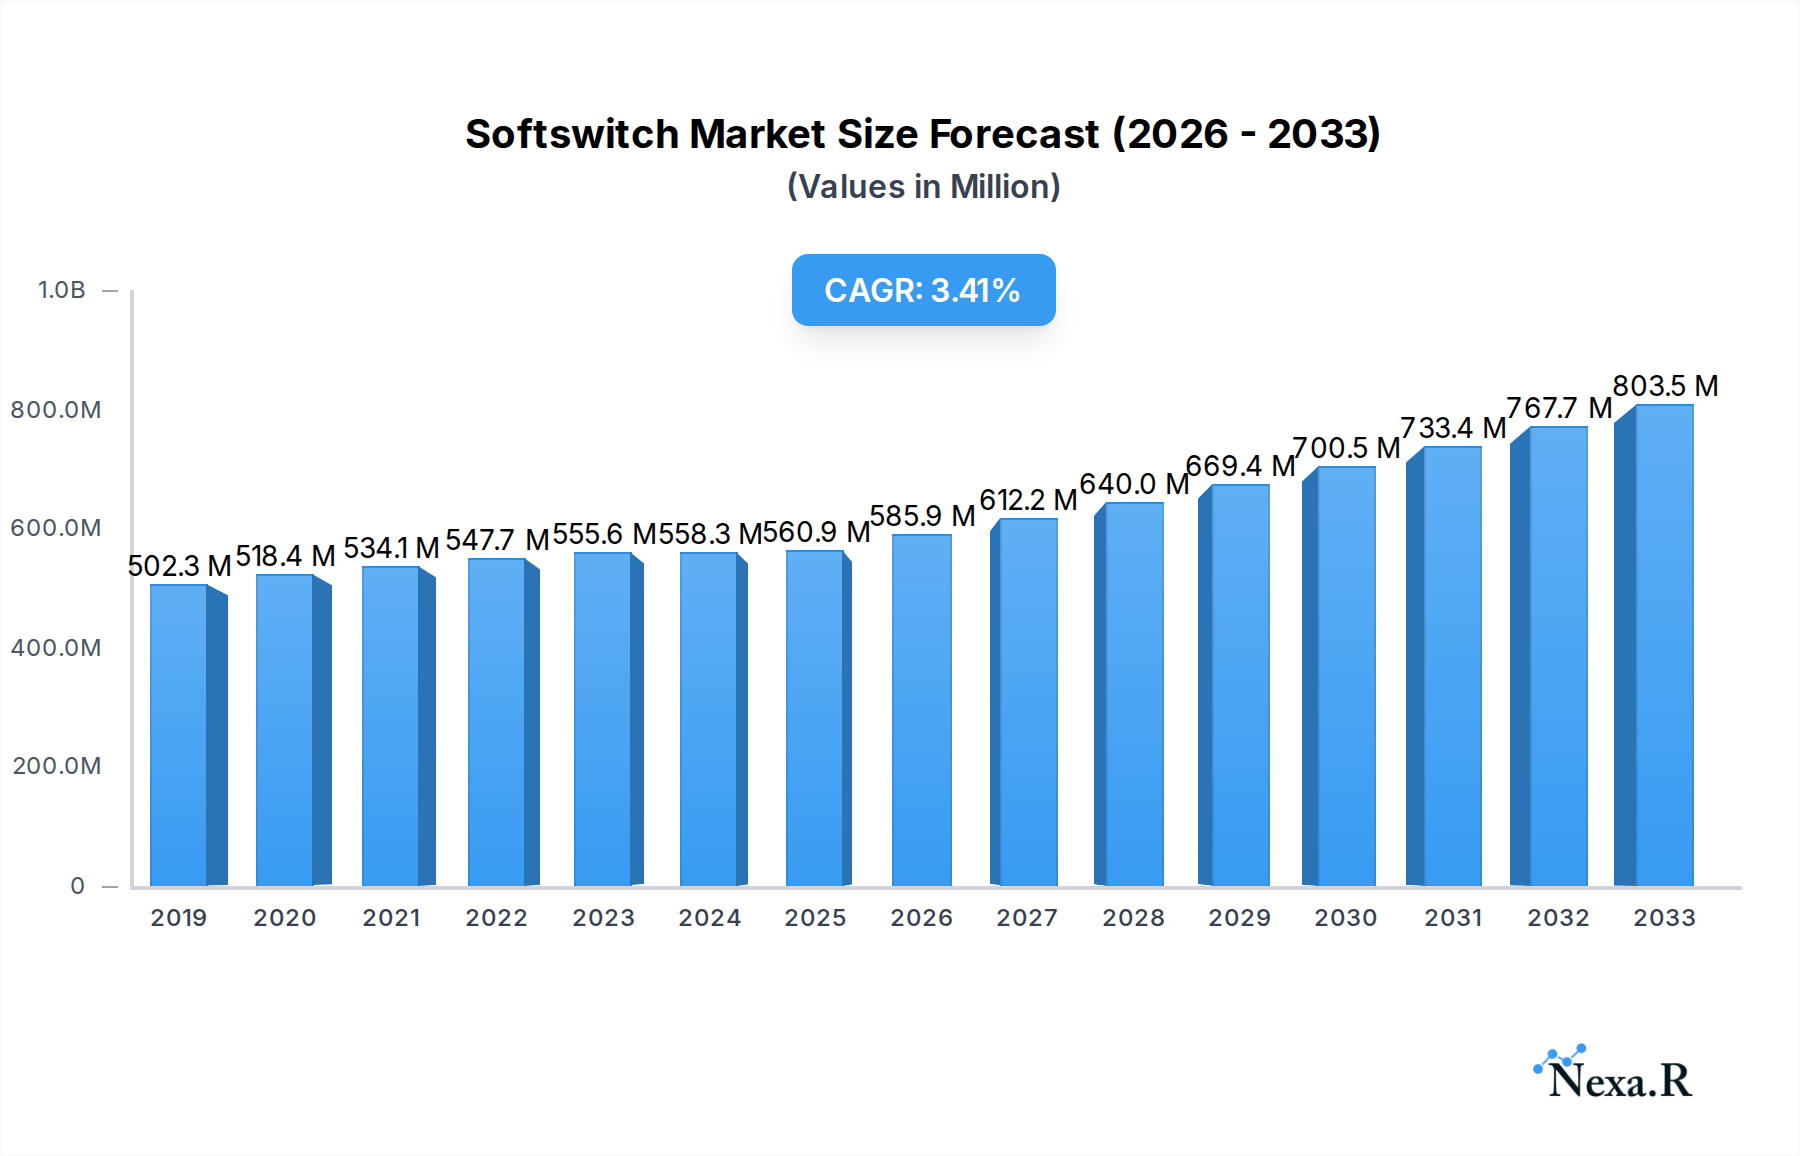
The global Softswitch market is poised for significant expansion, projected to reach approximately USD 758.3 million by 2033, growing at a Compound Annual Growth Rate (CAGR) of 5% from its estimated USD 560.9 million valuation in 2025. This robust growth is primarily fueled by the increasing demand for advanced telecommunication services, including Voice over IP (VoIP), multimedia communication, and the ongoing transition from traditional circuit-switched networks to more flexible and scalable IP-based infrastructures. The proliferation of smartphones, the surge in data traffic, and the continuous innovation in communication technologies are further acting as strong catalysts. Enterprises are increasingly adopting softswitch solutions to enhance their communication capabilities, improve operational efficiency, and reduce costs associated with traditional telephony systems. The Class 4 and Class 5 softswitch segments, catering to inter-network and end-user services respectively, are expected to witness substantial adoption, driven by the need for seamless call control and multimedia delivery.

Softswitch Market Size (In Million)
Key market drivers include the growing adoption of unified communications (UC) and contact center solutions, where softswitches play a pivotal role in integrating various communication channels. The expansion of 5G networks and the subsequent rise in IoT devices also present new avenues for softswitch integration, enabling more sophisticated communication services. However, the market also faces certain restraints, such as the significant upfront investment required for implementing advanced softswitch solutions and the increasing complexity of network management with the integration of diverse technologies. Cybersecurity concerns and the need for robust data protection also pose challenges. Despite these hurdles, the market is witnessing a strong trend towards cloud-based softswitch solutions, offering greater flexibility, scalability, and cost-effectiveness, which is expected to propel market growth in the forecast period. Major players are actively engaged in research and development to introduce innovative features and expand their market reach.
Softswitch Company Market Share
Comprehensive Softswitch Market Report: 2019-2033
This in-depth report provides an exhaustive analysis of the global Softswitch market, projecting its trajectory from 2019 to 2033. With a base year of 2025 and an estimated year of 2025, the forecast period of 2025–2033 offers crucial insights into market evolution, technological advancements, and competitive strategies. The historical period of 2019–2024 lays the groundwork for understanding past performance and current market conditions. This report is essential for telecommunication service providers, equipment manufacturers, investors, and technology strategists seeking to navigate the dynamic Softswitch landscape.
Softswitch Market Dynamics & Structure
The global Softswitch market is characterized by a moderate to high level of concentration, with several key players holding significant market shares. Technological innovation remains a primary driver, fueled by the continuous demand for enhanced voice and multimedia communication services, including advanced call control systems and seamless video conferencing solutions. Regulatory frameworks, particularly in developed economies, are increasingly focusing on network modernization and security, indirectly influencing Softswitch adoption. Competitive product substitutes, such as proprietary IP-PBX systems and cloud-based communication platforms, present ongoing challenges. End-user demographics are shifting towards a younger, digitally native population demanding integrated communication experiences. Mergers and acquisitions (M&A) trends are evident as larger companies acquire smaller innovators to expand their portfolios and market reach. For instance, M&A activities within the historical period (2019-2024) have seen an estimated $500 million in deal volume, indicative of consolidation efforts. Innovation barriers include the high cost of R&D for next-generation features and the complex integration process with existing legacy infrastructure.
- Market Concentration: Dominated by a few key vendors, but with increasing space for niche players.
- Technological Innovation Drivers: Demand for VoIP, unified communications, and enhanced multimedia capabilities.
- Regulatory Frameworks: Focus on network security, interoperability, and future-proofing infrastructure.
- Competitive Product Substitutes: Cloud PBX, UCaaS platforms, and integrated communication solutions.
- End-User Demographics: Growing demand for mobile-first, integrated communication experiences.
- M&A Trends: Strategic acquisitions to gain market share and technological expertise.
Softswitch Growth Trends & Insights
The global Softswitch market is poised for substantial growth driven by escalating demand for advanced telecommunication services and the ongoing transition from traditional circuit-switched networks to IP-based solutions. The market size, estimated at $8,500 million in 2025, is projected to expand at a Compound Annual Growth Rate (CAGR) of 7.8% during the forecast period of 2025–2033, reaching an estimated $15,500 million by 2033. This impressive growth is underpinned by increasing adoption rates among telecommunication service providers seeking to reduce operational costs and offer a wider array of services. Technological disruptions, such as the integration of AI for intelligent call routing and natural language processing for voice assistants within communication systems, are significantly reshaping the market. Consumer behavior is shifting towards the preference for seamless, omnichannel communication experiences, where voice, video, and messaging are integrated into a single platform. The market penetration of Softswitch solutions is expected to reach 65% by 2033 in the enterprise segment. Furthermore, the growing deployment of 5G networks is creating new opportunities for high-capacity and low-latency Softswitch solutions, enabling richer multimedia services and IoT communication. The historical period (2019–2024) witnessed steady growth, with market size increasing from an estimated $6,200 million in 2019 to $8,100 million by 2024. The average adoption rate of new Softswitch features has been approximately 15% annually during this period.
Dominant Regions, Countries, or Segments in Softswitch
The Application: Call control System segment, particularly within Class 5 Softswitches, is currently the dominant driver of the global Softswitch market. This dominance is largely attributed to the extensive requirement for robust and feature-rich call management solutions in enterprise environments and for service providers catering to residential and business customers. North America, led by countries like the United States and Canada, emerges as the leading region, driven by advanced technological infrastructure, high disposable incomes, and a strong adoption rate of IP-based communication technologies. The region's market share in 2025 is estimated at 35%, with a projected growth rate of 8.2% through 2033. Key drivers include proactive government initiatives promoting digital transformation and significant investments in upgrading telecommunication networks. The extensive deployment of fiber optic networks and widespread availability of high-speed internet further facilitate the adoption of sophisticated Softswitch solutions.
In terms of specific segments, Class 5 Softswitches are expected to account for an estimated 60% of the total market revenue by 2025, owing to their comprehensive feature sets for handling local and long-distance calls, advanced calling features, and integration capabilities with billing and customer management systems. Video and Multimedia Systems, while a rapidly growing segment, are still secondary to the core call control functionalities in terms of overall market size. The "Others" category, encompassing specialized applications and emerging use cases, is witnessing significant innovation and adoption, but its current market share is relatively smaller. The economic policies in North America, favoring technological innovation and business expansion, coupled with a mature telecommunications market, create a fertile ground for Softswitch market growth. The market share of the Call Control System segment is projected to reach $9,300 million by 2033.
Softswitch Product Landscape
The Softswitch product landscape is defined by continuous innovation aimed at enhancing functionality, scalability, and integration. Key product innovations include advanced session border controllers (SBCs) for enhanced security and quality of service, intelligent call routing algorithms powered by AI, and seamless integration with unified communications (UC) platforms. Applications range from traditional voice and fax services to sophisticated video conferencing, instant messaging, and contact center solutions. Performance metrics are increasingly focused on low latency, high availability, and robust security features to meet the stringent demands of enterprise and service provider deployments. Unique selling propositions often revolve around the ability to support hybrid cloud environments, offer granular control over network traffic, and provide detailed analytics for service optimization. Technological advancements are driving the development of virtualized and containerized Softswitch solutions, offering greater deployment flexibility and cost efficiencies.
Key Drivers, Barriers & Challenges in Softswitch
Key Drivers:
- Digital Transformation: The ongoing shift towards digital business operations and remote work environments fuels the demand for integrated communication solutions.
- Cost Efficiency: Softswitches offer significant cost savings over traditional PSTN infrastructure through VoIP and reduced maintenance.
- Scalability and Flexibility: The ability to scale services up or down easily to meet fluctuating business needs is a major advantage.
- Enhanced Features: Demand for advanced features like unified communications, video conferencing, and mobility solutions.
- 5G Network Expansion: The deployment of 5G networks necessitates advanced communication infrastructure, including Softswitches, for high-bandwidth, low-latency services.
Key Barriers & Challenges:
- Legacy Infrastructure Integration: The complexity and cost associated with integrating new Softswitch solutions with existing, outdated telecommunication systems remain a significant hurdle.
- Cybersecurity Threats: The increasing sophistication of cyberattacks poses a constant threat to the security of VoIP and Softswitch platforms, requiring robust security measures.
- Interoperability Issues: Ensuring seamless interoperability between different Softswitch vendors and legacy equipment can be challenging, leading to potential compatibility problems.
- Regulatory Compliance: Navigating diverse and evolving regulatory landscapes across different regions, especially concerning data privacy and call termination, can be complex.
- Skilled Workforce Shortage: A lack of adequately trained personnel to manage, deploy, and maintain complex Softswitch environments can hinder adoption. Estimated impact of these challenges on adoption rates is around 10-15% annually.
Emerging Opportunities in Softswitch
Emerging opportunities in the Softswitch market are abundant, driven by the confluence of new technologies and evolving communication needs. The expansion of the Internet of Things (IoT) presents a significant avenue, with Softswitches playing a crucial role in managing and routing massive amounts of machine-to-machine (M2M) communication. The growth of edge computing also opens doors for decentralized Softswitch solutions that process data closer to the source, reducing latency for real-time applications. The increasing adoption of Artificial Intelligence (AI) and Machine Learning (ML) for intelligent call analytics, predictive maintenance, and personalized customer interactions offers lucrative avenues for service providers. Furthermore, the demand for specialized communication solutions in niche industries like healthcare (telemedicine) and education (remote learning) is creating untapped markets for customized Softswitch deployments. The global market for IoT communication management is expected to grow from $2,000 million in 2025 to $6,500 million by 2033, a substantial portion of which will be facilitated by Softswitch technologies.
Growth Accelerators in the Softswitch Industry
Several catalysts are accelerating the long-term growth of the Softswitch industry. Technological breakthroughs in areas like Software-Defined Networking (SDN) and Network Functions Virtualization (NFV) are enabling more agile, flexible, and cost-effective Softswitch deployments, paving the way for fully virtualized and cloud-native solutions. Strategic partnerships between Softswitch vendors, cloud service providers, and application developers are crucial for creating integrated ecosystems and expanding service offerings. Market expansion strategies, including penetration into emerging economies with rapidly developing telecommunication infrastructures, are driving demand. The increasing focus on sustainability and energy efficiency in network operations also favors the adoption of modern, optimized Softswitch solutions. The successful integration of AI-powered features into Softswitch platforms, promising enhanced user experiences and operational efficiencies, will further propel growth.
Key Players Shaping the Softswitch Market
- Alcatel-Lucent
- Ericsson Inc.
- Genband Inc.
- Huawei Technologies Co. Ltd.
- Sonus Networks Inc.
- Nokia Siemens Networks
- ZTE Corp.
- Metaswitch Networks
- Dialogic Inc.
- Cisco Systems Corp
- Italtel Inc.
Notable Milestones in Softswitch Sector
- 2019: Widespread adoption of cloud-based Softswitch solutions by SMEs.
- 2020: Increased focus on cybersecurity features within Softswitch platforms due to rising threats.
- 2021: Introduction of AI-powered analytics for call optimization in enterprise Softswitches.
- 2022: Significant advancements in NFV and SDN enabling highly scalable and flexible Softswitch architectures.
- 2023: Growing integration of Softswitch capabilities with emerging IoT communication platforms.
- 2024: Enhanced support for advanced multimedia codecs and high-definition video conferencing in Class 5 Softswitches.
In-Depth Softswitch Market Outlook
The future outlook for the Softswitch market is exceptionally bright, driven by sustained technological innovation and expanding global connectivity. Growth accelerators such as the pervasive rollout of 5G networks, the increasing adoption of AI in telecommunications, and the continued demand for unified communication solutions will fuel market expansion. The convergence of voice, video, and data services on IP-based platforms, facilitated by advanced Softswitch architectures, will enable richer and more integrated communication experiences for businesses and consumers alike. Emerging applications in IoT, edge computing, and specialized industry verticals present significant untapped potential. The ongoing transition from legacy infrastructure to flexible, scalable, and cost-effective Softswitch solutions will continue to be a primary driver, positioning the market for robust growth throughout the forecast period and beyond. The estimated market value is projected to reach $15,500 million by 2033.
Softswitch Segmentation
-
1. Application
- 1.1. Call control System
- 1.2. Video and Multimedia Systems
- 1.3. Others
-
2. Types
- 2.1. Class 4 Softswitches
- 2.2. Class 5 Softswitches
Softswitch Segmentation By Geography
-
1. North America
- 1.1. United States
- 1.2. Canada
- 1.3. Mexico
-
2. South America
- 2.1. Brazil
- 2.2. Argentina
- 2.3. Rest of South America
-
3. Europe
- 3.1. United Kingdom
- 3.2. Germany
- 3.3. France
- 3.4. Italy
- 3.5. Spain
- 3.6. Russia
- 3.7. Benelux
- 3.8. Nordics
- 3.9. Rest of Europe
-
4. Middle East & Africa
- 4.1. Turkey
- 4.2. Israel
- 4.3. GCC
- 4.4. North Africa
- 4.5. South Africa
- 4.6. Rest of Middle East & Africa
-
5. Asia Pacific
- 5.1. China
- 5.2. India
- 5.3. Japan
- 5.4. South Korea
- 5.5. ASEAN
- 5.6. Oceania
- 5.7. Rest of Asia Pacific
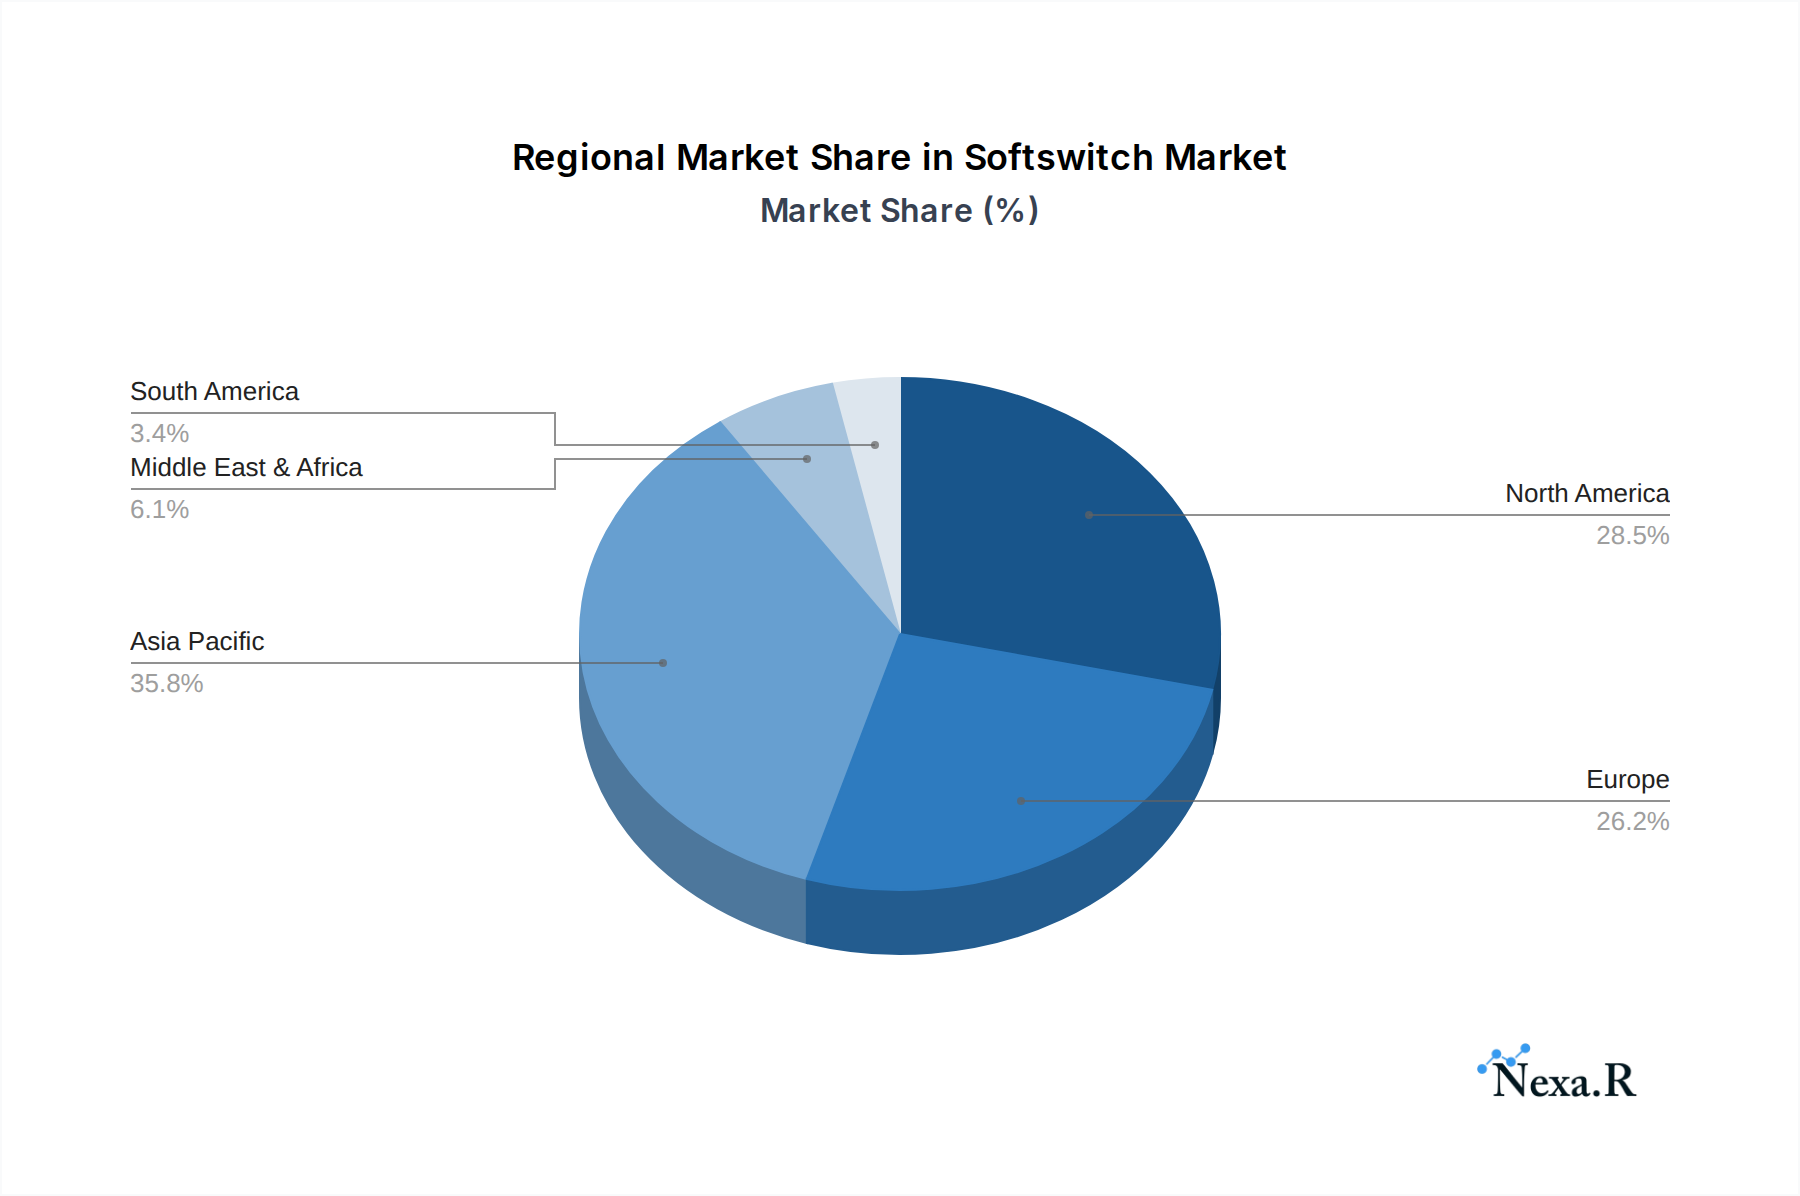
Softswitch Regional Market Share
Geographic Coverage of Softswitch
Softswitch REPORT HIGHLIGHTS
| Aspects | Details |
|---|---|
| Study Period | 2020-2034 |
| Base Year | 2025 |
| Estimated Year | 2026 |
| Forecast Period | 2026-2034 |
| Historical Period | 2020-2025 |
| Growth Rate | CAGR of 5% from 2020-2034 |
| Segmentation |
|
Table of Contents
- 1. Introduction
- 1.1. Research Scope
- 1.2. Market Segmentation
- 1.3. Research Objective
- 1.4. Definitions and Assumptions
- 2. Executive Summary
- 2.1. Market Snapshot
- 3. Market Dynamics
- 3.1. Market Drivers
- 3.2. Market Restrains
- 3.3. Market Trends
- 3.4. Market Opportunities
- 4. Market Factor Analysis
- 4.1. Porters Five Forces
- 4.1.1. Bargaining Power of Suppliers
- 4.1.2. Bargaining Power of Buyers
- 4.1.3. Threat of New Entrants
- 4.1.4. Threat of Substitutes
- 4.1.5. Competitive Rivalry
- 4.2. PESTEL analysis
- 4.3. BCG Analysis
- 4.3.1. Stars (High Growth, High Market Share)
- 4.3.2. Cash Cows (Low Growth, High Market Share)
- 4.3.3. Question Mark (High Growth, Low Market Share)
- 4.3.4. Dogs (Low Growth, Low Market Share)
- 4.4. Ansoff Matrix Analysis
- 4.5. Supply Chain Analysis
- 4.6. Regulatory Landscape
- 4.7. Current Market Potential and Opportunity Assessment (TAM–SAM–SOM Framework)
- 4.8. NRP Analyst Note
- 4.1. Porters Five Forces
- 5. Market Analysis, Insights and Forecast 2021-2033
- 5.1. Market Analysis, Insights and Forecast - by Application
- 5.1.1. Call control System
- 5.1.2. Video and Multimedia Systems
- 5.1.3. Others
- 5.2. Market Analysis, Insights and Forecast - by Types
- 5.2.1. Class 4 Softswitches
- 5.2.2. Class 5 Softswitches
- 5.3. Market Analysis, Insights and Forecast - by Region
- 5.3.1. North America
- 5.3.2. South America
- 5.3.3. Europe
- 5.3.4. Middle East & Africa
- 5.3.5. Asia Pacific
- 5.1. Market Analysis, Insights and Forecast - by Application
- 6. Global Softswitch Analysis, Insights and Forecast, 2021-2033
- 6.1. Market Analysis, Insights and Forecast - by Application
- 6.1.1. Call control System
- 6.1.2. Video and Multimedia Systems
- 6.1.3. Others
- 6.2. Market Analysis, Insights and Forecast - by Types
- 6.2.1. Class 4 Softswitches
- 6.2.2. Class 5 Softswitches
- 6.1. Market Analysis, Insights and Forecast - by Application
- 7. North America Softswitch Analysis, Insights and Forecast, 2020-2032
- 7.1. Market Analysis, Insights and Forecast - by Application
- 7.1.1. Call control System
- 7.1.2. Video and Multimedia Systems
- 7.1.3. Others
- 7.2. Market Analysis, Insights and Forecast - by Types
- 7.2.1. Class 4 Softswitches
- 7.2.2. Class 5 Softswitches
- 7.1. Market Analysis, Insights and Forecast - by Application
- 8. South America Softswitch Analysis, Insights and Forecast, 2020-2032
- 8.1. Market Analysis, Insights and Forecast - by Application
- 8.1.1. Call control System
- 8.1.2. Video and Multimedia Systems
- 8.1.3. Others
- 8.2. Market Analysis, Insights and Forecast - by Types
- 8.2.1. Class 4 Softswitches
- 8.2.2. Class 5 Softswitches
- 8.1. Market Analysis, Insights and Forecast - by Application
- 9. Europe Softswitch Analysis, Insights and Forecast, 2020-2032
- 9.1. Market Analysis, Insights and Forecast - by Application
- 9.1.1. Call control System
- 9.1.2. Video and Multimedia Systems
- 9.1.3. Others
- 9.2. Market Analysis, Insights and Forecast - by Types
- 9.2.1. Class 4 Softswitches
- 9.2.2. Class 5 Softswitches
- 9.1. Market Analysis, Insights and Forecast - by Application
- 10. Middle East & Africa Softswitch Analysis, Insights and Forecast, 2020-2032
- 10.1. Market Analysis, Insights and Forecast - by Application
- 10.1.1. Call control System
- 10.1.2. Video and Multimedia Systems
- 10.1.3. Others
- 10.2. Market Analysis, Insights and Forecast - by Types
- 10.2.1. Class 4 Softswitches
- 10.2.2. Class 5 Softswitches
- 10.1. Market Analysis, Insights and Forecast - by Application
- 11. Asia Pacific Softswitch Analysis, Insights and Forecast, 2020-2032
- 11.1. Market Analysis, Insights and Forecast - by Application
- 11.1.1. Call control System
- 11.1.2. Video and Multimedia Systems
- 11.1.3. Others
- 11.2. Market Analysis, Insights and Forecast - by Types
- 11.2.1. Class 4 Softswitches
- 11.2.2. Class 5 Softswitches
- 11.1. Market Analysis, Insights and Forecast - by Application
- 12. Competitive Analysis
- 12.1. Company Profiles
- 12.1.1 Alcatel-Lucent
- 12.1.1.1. Company Overview
- 12.1.1.2. Products
- 12.1.1.3. Company Financials
- 12.1.1.4. SWOT Analysis
- 12.1.2 Ericsson Inc.
- 12.1.2.1. Company Overview
- 12.1.2.2. Products
- 12.1.2.3. Company Financials
- 12.1.2.4. SWOT Analysis
- 12.1.3 Genband Inc.
- 12.1.3.1. Company Overview
- 12.1.3.2. Products
- 12.1.3.3. Company Financials
- 12.1.3.4. SWOT Analysis
- 12.1.4 Huawei Technologies Co. Ltd.
- 12.1.4.1. Company Overview
- 12.1.4.2. Products
- 12.1.4.3. Company Financials
- 12.1.4.4. SWOT Analysis
- 12.1.5 Sonus Neworks Inc.
- 12.1.5.1. Company Overview
- 12.1.5.2. Products
- 12.1.5.3. Company Financials
- 12.1.5.4. SWOT Analysis
- 12.1.6 Nokia Siemens Networks
- 12.1.6.1. Company Overview
- 12.1.6.2. Products
- 12.1.6.3. Company Financials
- 12.1.6.4. SWOT Analysis
- 12.1.7 ZTE Corp.
- 12.1.7.1. Company Overview
- 12.1.7.2. Products
- 12.1.7.3. Company Financials
- 12.1.7.4. SWOT Analysis
- 12.1.8 Metaswitch Networks
- 12.1.8.1. Company Overview
- 12.1.8.2. Products
- 12.1.8.3. Company Financials
- 12.1.8.4. SWOT Analysis
- 12.1.9 Dialogic Inc.
- 12.1.9.1. Company Overview
- 12.1.9.2. Products
- 12.1.9.3. Company Financials
- 12.1.9.4. SWOT Analysis
- 12.1.10 Cisco Systems Corp
- 12.1.10.1. Company Overview
- 12.1.10.2. Products
- 12.1.10.3. Company Financials
- 12.1.10.4. SWOT Analysis
- 12.1.11 Italtel Inc.
- 12.1.11.1. Company Overview
- 12.1.11.2. Products
- 12.1.11.3. Company Financials
- 12.1.11.4. SWOT Analysis
- 12.1.1 Alcatel-Lucent
- 12.2. Market Entropy
- 12.2.1 Company's Key Areas Served
- 12.2.2 Recent Developments
- 12.3. Company Market Share Analysis 2025
- 12.3.1 Top 5 Companies Market Share Analysis
- 12.3.2 Top 3 Companies Market Share Analysis
- 12.4. List of Potential Customers
- 13. Research Methodology
List of Figures
- Figure 1: Global Softswitch Revenue Breakdown (million, %) by Region 2025 & 2033
- Figure 2: North America Softswitch Revenue (million), by Application 2025 & 2033
- Figure 3: North America Softswitch Revenue Share (%), by Application 2025 & 2033
- Figure 4: North America Softswitch Revenue (million), by Types 2025 & 2033
- Figure 5: North America Softswitch Revenue Share (%), by Types 2025 & 2033
- Figure 6: North America Softswitch Revenue (million), by Country 2025 & 2033
- Figure 7: North America Softswitch Revenue Share (%), by Country 2025 & 2033
- Figure 8: South America Softswitch Revenue (million), by Application 2025 & 2033
- Figure 9: South America Softswitch Revenue Share (%), by Application 2025 & 2033
- Figure 10: South America Softswitch Revenue (million), by Types 2025 & 2033
- Figure 11: South America Softswitch Revenue Share (%), by Types 2025 & 2033
- Figure 12: South America Softswitch Revenue (million), by Country 2025 & 2033
- Figure 13: South America Softswitch Revenue Share (%), by Country 2025 & 2033
- Figure 14: Europe Softswitch Revenue (million), by Application 2025 & 2033
- Figure 15: Europe Softswitch Revenue Share (%), by Application 2025 & 2033
- Figure 16: Europe Softswitch Revenue (million), by Types 2025 & 2033
- Figure 17: Europe Softswitch Revenue Share (%), by Types 2025 & 2033
- Figure 18: Europe Softswitch Revenue (million), by Country 2025 & 2033
- Figure 19: Europe Softswitch Revenue Share (%), by Country 2025 & 2033
- Figure 20: Middle East & Africa Softswitch Revenue (million), by Application 2025 & 2033
- Figure 21: Middle East & Africa Softswitch Revenue Share (%), by Application 2025 & 2033
- Figure 22: Middle East & Africa Softswitch Revenue (million), by Types 2025 & 2033
- Figure 23: Middle East & Africa Softswitch Revenue Share (%), by Types 2025 & 2033
- Figure 24: Middle East & Africa Softswitch Revenue (million), by Country 2025 & 2033
- Figure 25: Middle East & Africa Softswitch Revenue Share (%), by Country 2025 & 2033
- Figure 26: Asia Pacific Softswitch Revenue (million), by Application 2025 & 2033
- Figure 27: Asia Pacific Softswitch Revenue Share (%), by Application 2025 & 2033
- Figure 28: Asia Pacific Softswitch Revenue (million), by Types 2025 & 2033
- Figure 29: Asia Pacific Softswitch Revenue Share (%), by Types 2025 & 2033
- Figure 30: Asia Pacific Softswitch Revenue (million), by Country 2025 & 2033
- Figure 31: Asia Pacific Softswitch Revenue Share (%), by Country 2025 & 2033
List of Tables
- Table 1: Global Softswitch Revenue million Forecast, by Application 2020 & 2033
- Table 2: Global Softswitch Revenue million Forecast, by Types 2020 & 2033
- Table 3: Global Softswitch Revenue million Forecast, by Region 2020 & 2033
- Table 4: Global Softswitch Revenue million Forecast, by Application 2020 & 2033
- Table 5: Global Softswitch Revenue million Forecast, by Types 2020 & 2033
- Table 6: Global Softswitch Revenue million Forecast, by Country 2020 & 2033
- Table 7: United States Softswitch Revenue (million) Forecast, by Application 2020 & 2033
- Table 8: Canada Softswitch Revenue (million) Forecast, by Application 2020 & 2033
- Table 9: Mexico Softswitch Revenue (million) Forecast, by Application 2020 & 2033
- Table 10: Global Softswitch Revenue million Forecast, by Application 2020 & 2033
- Table 11: Global Softswitch Revenue million Forecast, by Types 2020 & 2033
- Table 12: Global Softswitch Revenue million Forecast, by Country 2020 & 2033
- Table 13: Brazil Softswitch Revenue (million) Forecast, by Application 2020 & 2033
- Table 14: Argentina Softswitch Revenue (million) Forecast, by Application 2020 & 2033
- Table 15: Rest of South America Softswitch Revenue (million) Forecast, by Application 2020 & 2033
- Table 16: Global Softswitch Revenue million Forecast, by Application 2020 & 2033
- Table 17: Global Softswitch Revenue million Forecast, by Types 2020 & 2033
- Table 18: Global Softswitch Revenue million Forecast, by Country 2020 & 2033
- Table 19: United Kingdom Softswitch Revenue (million) Forecast, by Application 2020 & 2033
- Table 20: Germany Softswitch Revenue (million) Forecast, by Application 2020 & 2033
- Table 21: France Softswitch Revenue (million) Forecast, by Application 2020 & 2033
- Table 22: Italy Softswitch Revenue (million) Forecast, by Application 2020 & 2033
- Table 23: Spain Softswitch Revenue (million) Forecast, by Application 2020 & 2033
- Table 24: Russia Softswitch Revenue (million) Forecast, by Application 2020 & 2033
- Table 25: Benelux Softswitch Revenue (million) Forecast, by Application 2020 & 2033
- Table 26: Nordics Softswitch Revenue (million) Forecast, by Application 2020 & 2033
- Table 27: Rest of Europe Softswitch Revenue (million) Forecast, by Application 2020 & 2033
- Table 28: Global Softswitch Revenue million Forecast, by Application 2020 & 2033
- Table 29: Global Softswitch Revenue million Forecast, by Types 2020 & 2033
- Table 30: Global Softswitch Revenue million Forecast, by Country 2020 & 2033
- Table 31: Turkey Softswitch Revenue (million) Forecast, by Application 2020 & 2033
- Table 32: Israel Softswitch Revenue (million) Forecast, by Application 2020 & 2033
- Table 33: GCC Softswitch Revenue (million) Forecast, by Application 2020 & 2033
- Table 34: North Africa Softswitch Revenue (million) Forecast, by Application 2020 & 2033
- Table 35: South Africa Softswitch Revenue (million) Forecast, by Application 2020 & 2033
- Table 36: Rest of Middle East & Africa Softswitch Revenue (million) Forecast, by Application 2020 & 2033
- Table 37: Global Softswitch Revenue million Forecast, by Application 2020 & 2033
- Table 38: Global Softswitch Revenue million Forecast, by Types 2020 & 2033
- Table 39: Global Softswitch Revenue million Forecast, by Country 2020 & 2033
- Table 40: China Softswitch Revenue (million) Forecast, by Application 2020 & 2033
- Table 41: India Softswitch Revenue (million) Forecast, by Application 2020 & 2033
- Table 42: Japan Softswitch Revenue (million) Forecast, by Application 2020 & 2033
- Table 43: South Korea Softswitch Revenue (million) Forecast, by Application 2020 & 2033
- Table 44: ASEAN Softswitch Revenue (million) Forecast, by Application 2020 & 2033
- Table 45: Oceania Softswitch Revenue (million) Forecast, by Application 2020 & 2033
- Table 46: Rest of Asia Pacific Softswitch Revenue (million) Forecast, by Application 2020 & 2033
Frequently Asked Questions
1. What is the projected Compound Annual Growth Rate (CAGR) of the Softswitch?
The projected CAGR is approximately 5%.
2. Which companies are prominent players in the Softswitch?
Key companies in the market include Alcatel-Lucent, Ericsson Inc., Genband Inc., Huawei Technologies Co. Ltd., Sonus Neworks Inc., Nokia Siemens Networks, ZTE Corp., Metaswitch Networks, Dialogic Inc., Cisco Systems Corp, Italtel Inc..
3. What are the main segments of the Softswitch?
The market segments include Application, Types.
4. Can you provide details about the market size?
The market size is estimated to be USD 560.9 million as of 2022.
5. What are some drivers contributing to market growth?
N/A
6. What are the notable trends driving market growth?
N/A
7. Are there any restraints impacting market growth?
N/A
8. Can you provide examples of recent developments in the market?
N/A
9. What pricing options are available for accessing the report?
Pricing options include single-user, multi-user, and enterprise licenses priced at USD 2900.00, USD 4350.00, and USD 5800.00 respectively.
10. Is the market size provided in terms of value or volume?
The market size is provided in terms of value, measured in million.
11. Are there any specific market keywords associated with the report?
Yes, the market keyword associated with the report is "Softswitch," which aids in identifying and referencing the specific market segment covered.
12. How do I determine which pricing option suits my needs best?
The pricing options vary based on user requirements and access needs. Individual users may opt for single-user licenses, while businesses requiring broader access may choose multi-user or enterprise licenses for cost-effective access to the report.
13. Are there any additional resources or data provided in the Softswitch report?
While the report offers comprehensive insights, it's advisable to review the specific contents or supplementary materials provided to ascertain if additional resources or data are available.
14. How can I stay updated on further developments or reports in the Softswitch?
To stay informed about further developments, trends, and reports in the Softswitch, consider subscribing to industry newsletters, following relevant companies and organizations, or regularly checking reputable industry news sources and publications.
Methodology
Step 1 - Identification of Relevant Samples Size from Population Database


Step 2 - Approaches for Defining Global Market Size (Value, Volume* & Price*)

Note*: In applicable scenarios
Step 3 - Data Sources
Primary Research
- Web Analytics
- Survey Reports
- Research Institute
- Latest Research Reports
- Opinion Leaders
Secondary Research
- Annual Reports
- White Paper
- Latest Press Release
- Industry Association
- Paid Database
- Investor Presentations

Step 4 - Data Triangulation
Involves using different sources of information in order to increase the validity of a study
These sources are likely to be stakeholders in a program - participants, other researchers, program staff, other community members, and so on.
Then we put all data in single framework & apply various statistical tools to find out the dynamic on the market.
During the analysis stage, feedback from the stakeholder groups would be compared to determine areas of agreement as well as areas of divergence