

Key Insights
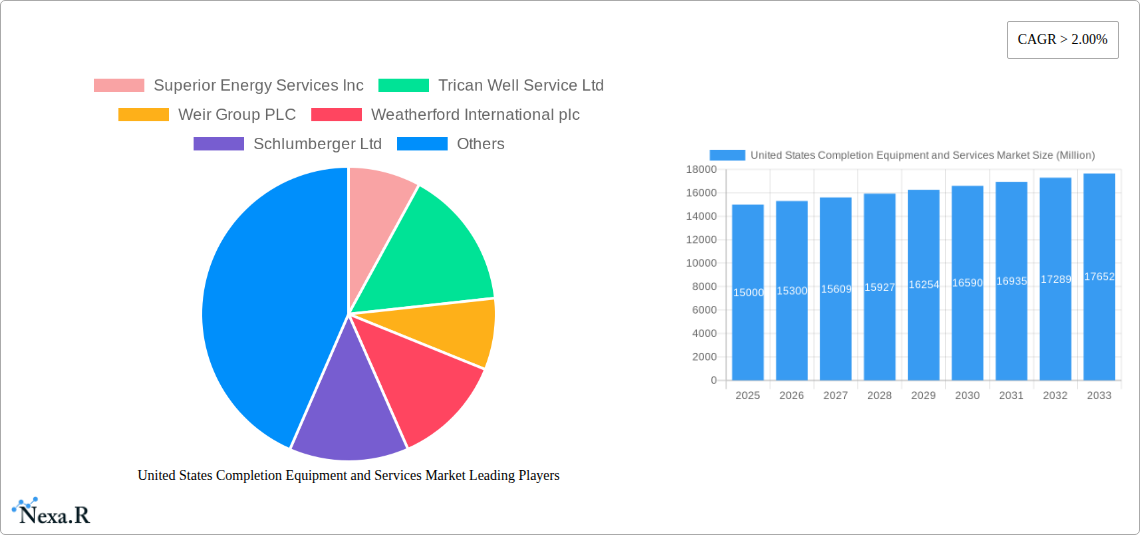
The United States completion equipment and services market is experiencing robust growth, driven by increasing oil and gas production activities and a renewed focus on enhancing well completion efficiency. The market, valued at approximately $15 billion in 2025, is projected to maintain a compound annual growth rate (CAGR) exceeding 2% through 2033. This growth is fueled by several key factors. Firstly, the ongoing exploration and development of shale resources, particularly in regions like the Permian Basin, necessitate advanced completion techniques and equipment. Secondly, technological advancements in hydraulic fracturing, artificial lift systems, and wellbore completion tools are significantly improving operational efficiency and production yields, leading to increased market demand. Finally, government initiatives promoting energy independence and the gradual shift towards cleaner energy sources are indirectly boosting investment in the oil and gas sector, thereby impacting the completion equipment and services market positively.
However, the market faces certain restraints. Fluctuations in oil and gas prices represent a significant challenge, directly impacting investment decisions and operational budgets. Environmental regulations concerning wastewater disposal and methane emissions are increasingly stringent, necessitating the adoption of more environmentally friendly completion technologies and practices. Furthermore, intense competition among established players like Schlumberger, Halliburton, and Baker Hughes, alongside emerging players, puts pressure on pricing and profit margins. Despite these challenges, the long-term outlook for the US completion equipment and services market remains positive, with continuous technological innovation and growing energy demands driving sustained expansion throughout the forecast period. The onshore segment currently dominates, reflecting the prevalence of land-based drilling operations.
United States Completion Equipment and Services Market: A Comprehensive Report (2019-2033)
This in-depth report provides a comprehensive analysis of the United States Completion Equipment and Services market, covering market dynamics, growth trends, dominant segments, key players, and future outlook. The study period spans from 2019 to 2033, with 2025 serving as the base and estimated year. The report offers valuable insights for industry professionals, investors, and stakeholders seeking to understand and capitalize on opportunities within this dynamic market. The market size is expected to reach xx Million by 2033.
United States Completion Equipment and Services Market Market Dynamics & Structure
The US Completion Equipment and Services market is characterized by a moderately concentrated landscape, with major players like Schlumberger Ltd, Halliburton Company, and Baker Hughes Company holding significant market share. However, the presence of several smaller, specialized companies fosters competition and innovation. Technological advancements, particularly in automation and data analytics, are key drivers. Regulatory frameworks, including environmental regulations and safety standards, significantly influence market operations. The market faces competition from substitute technologies, particularly in certain niche applications. End-user demographics are primarily driven by the needs of onshore and offshore oil and gas producers. M&A activity has been moderate in recent years, primarily focusing on strategic acquisitions to expand service offerings and geographical reach. The historical period (2019-2024) saw fluctuations influenced by oil price volatility.
- Market Concentration: Moderately concentrated, with top 5 players holding approximately xx% market share in 2025.
- Technological Innovation: Strong driver, with focus on automation, data analytics, and enhanced completion techniques.
- Regulatory Framework: Significant influence, especially concerning environmental protection and safety standards.
- Competitive Substitutes: Presence of alternative technologies, albeit limited in some application areas.
- End-User Demographics: Primarily driven by onshore and offshore oil and gas producers.
- M&A Trends: Moderate activity, primarily strategic acquisitions to expand service offerings and geographical reach. xx M&A deals were recorded between 2019 and 2024.
United States Completion Equipment and Services Market Growth Trends & Insights
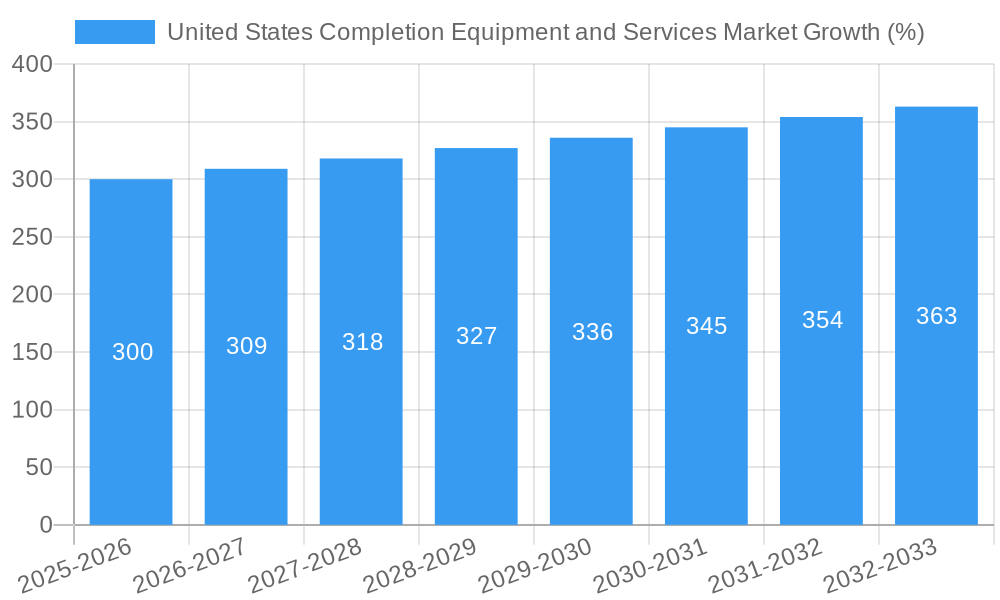
The US Completion Equipment and Services market experienced significant growth during the historical period (2019-2024), primarily driven by increasing oil and gas production activities. The market size reached xx Million in 2024. The forecast period (2025-2033) anticipates continued growth, albeit at a more moderate pace due to factors like fluctuating oil prices and environmental concerns. The adoption rate of advanced completion technologies is increasing, fueled by the need for improved efficiency and reduced operational costs. Technological disruptions, such as the rise of digitalization and automation, are transforming market dynamics. Consumer behavior shifts, including a greater focus on sustainability and environmental responsibility, are influencing market demand. The market is projected to exhibit a CAGR of xx% during the forecast period (2025-2033). Market penetration of advanced completion technologies is expected to reach xx% by 2033.
Dominant Regions, Countries, or Segments in United States Completion Equipment and Services Market
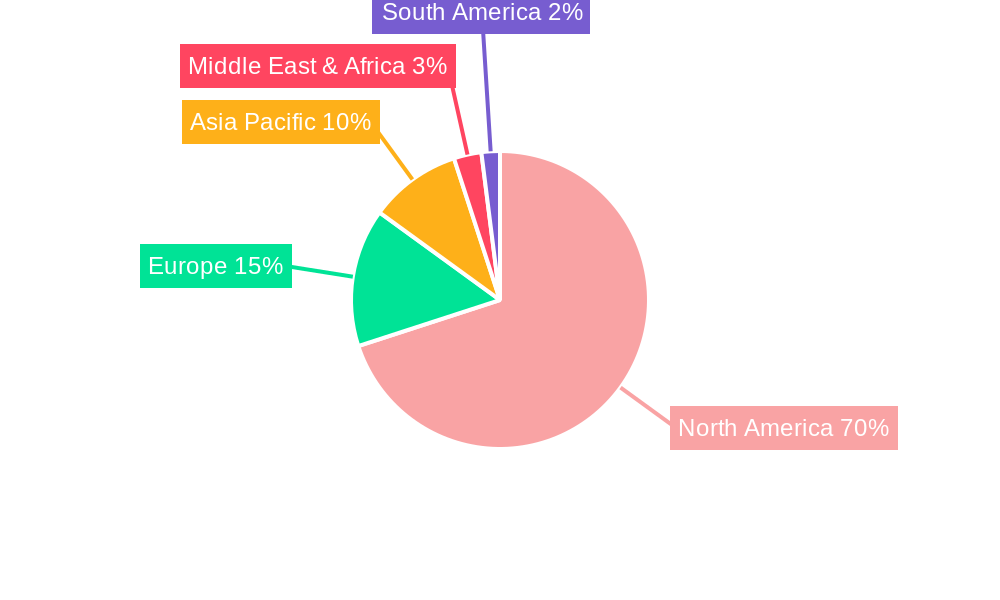
The onshore segment currently dominates the US Completion Equipment and Services market, accounting for approximately xx% of total market revenue in 2025. This dominance stems from the prevalence of onshore oil and gas production activities across various states. While the offshore segment contributes a smaller share, it exhibits significant growth potential driven by ongoing exploration and production efforts in deepwater regions.
- Onshore Dominance: Driven by higher concentration of oil and gas production activities. Supportive government policies and established infrastructure contribute significantly.
- Offshore Growth Potential: Driven by deepwater exploration and production, though it faces challenges in terms of higher operational costs and environmental concerns. Technological advancements are expected to mitigate some of these challenges.
- Regional Variations: Market growth rates vary across different states, influenced by local regulations, infrastructure development, and exploration activities. Texas and North Dakota are expected to remain key contributors to market growth.
United States Completion Equipment and Services Market Product Landscape
The market offers a diverse range of completion equipment and services, including hydraulic fracturing equipment, cementing services, and well completion tools. Recent innovations focus on improving efficiency, reducing environmental impact, and enhancing well productivity. Unique selling propositions often center on advanced technologies, such as automated systems, data-driven decision-making, and specialized tools for complex well completions. Technological advancements have led to increased precision, reduced operational costs, and improved well performance.
Key Drivers, Barriers & Challenges in United States Completion Equipment and Services Market
Key Drivers:
- Increased oil and gas production activities.
- Technological advancements improving efficiency and reducing costs.
- Government incentives and support for domestic energy production.
Challenges & Restraints:
- Fluctuating oil prices impacting investment decisions.
- Stringent environmental regulations and related compliance costs.
- Competition from alternative energy sources.
- Supply chain disruptions impacting the availability of key components and materials. This resulted in a xx% increase in material costs in 2024.
Emerging Opportunities in United States Completion Equipment and Services Market
- Growing demand for enhanced oil recovery (EOR) techniques.
- Increased focus on unconventional resources like shale gas.
- Development of sustainable and environmentally friendly completion technologies.
- Expansion into emerging markets and regions within the US.
Growth Accelerators in the United States Completion Equipment and Services Market Industry
Long-term growth is anticipated to be fueled by technological breakthroughs in automation and data analytics, leading to enhanced efficiency and reduced operational costs. Strategic partnerships between service providers and oil and gas companies will accelerate the adoption of new technologies and optimize well completion processes. Market expansion into less explored regions with significant oil and gas reserves will also contribute significantly to growth.
Key Players Shaping the United States Completion Equipment and Services Market Market
- Superior Energy Services Inc
- Trican Well Service Ltd
- Weir Group PLC
- Weatherford International plc
- Schlumberger Ltd
- Packers Plus Energy Services Inc
- Baker Hughes Company
- Halliburton Company
- National-Oilwell Varco Inc
- Schoeller-Bleckmann Oilfield Equipment AG
- Welltec A/S
Notable Milestones in United States Completion Equipment and Services Market Sector
- Q1 2022: Schlumberger Ltd. launched a new automated completion system, significantly improving efficiency.
- Q3 2023: Halliburton Company acquired a smaller completion equipment manufacturer, expanding its product portfolio.
- 2024: Increased regulatory scrutiny led to a heightened focus on environmental compliance among service providers.
In-Depth United States Completion Equipment and Services Market Market Outlook
The US Completion Equipment and Services market is poised for continued growth in the coming years, driven by technological advancements, strategic partnerships, and increasing oil and gas production. Opportunities exist in the development and adoption of sustainable completion technologies, expansion into emerging markets, and the provision of specialized services for unconventional resources. Strategic alliances and technological innovations will be key factors in shaping future market dynamics and unlocking significant growth potential.
United States Completion Equipment and Services Market Segmentation
-
1. Location of Deployment
- 1.1. Onshore
- 1.2. Offshore
United States Completion Equipment and Services Market Segmentation By Geography
- 1. United States
United States Completion Equipment and Services Market REPORT HIGHLIGHTS
| Aspects | Details |
|---|---|
| Study Period | 2019-2033 |
| Base Year | 2024 |
| Estimated Year | 2025 |
| Forecast Period | 2025-2033 |
| Historical Period | 2019-2024 |
| Growth Rate | CAGR of > 2.00% from 2019-2033 |
| Segmentation |
|
Table of Contents
- 1. Introduction
- 1.1. Research Scope
- 1.2. Market Segmentation
- 1.3. Research Methodology
- 1.4. Definitions and Assumptions
- 2. Executive Summary
- 2.1. Introduction
- 3. Market Dynamics
- 3.1. Introduction
- 3.2. Market Drivers
- 3.2.1. 4.; Global Inclination toward Renewable-based Power Generation4.; Increased Power Demand in Line with the Increasing Population
- 3.3. Market Restrains
- 3.3.1. 4.; High Initial Cost
- 3.4. Market Trends
- 3.4.1. Shale Oil and Gas Production to Drive the Market
- 4. Market Factor Analysis
- 4.1. Porters Five Forces
- 4.2. Supply/Value Chain
- 4.3. PESTEL analysis
- 4.4. Market Entropy
- 4.5. Patent/Trademark Analysis
- 5. United States Completion Equipment and Services Market Analysis, Insights and Forecast, 2019-2031
- 5.1. Market Analysis, Insights and Forecast - by Location of Deployment
- 5.1.1. Onshore
- 5.1.2. Offshore
- 5.2. Market Analysis, Insights and Forecast - by Region
- 5.2.1. United States
- 5.1. Market Analysis, Insights and Forecast - by Location of Deployment
- 6. United States United States Completion Equipment and Services Market Analysis, Insights and Forecast, 2019-2031
- 7. Canada United States Completion Equipment and Services Market Analysis, Insights and Forecast, 2019-2031
- 8. Mexico United States Completion Equipment and Services Market Analysis, Insights and Forecast, 2019-2031
- 9. Competitive Analysis
- 9.1. Market Share Analysis 2024
- 9.2. Company Profiles
- 9.2.1 Superior Energy Services Inc
- 9.2.1.1. Overview
- 9.2.1.2. Products
- 9.2.1.3. SWOT Analysis
- 9.2.1.4. Recent Developments
- 9.2.1.5. Financials (Based on Availability)
- 9.2.2 Trican Well Service Ltd
- 9.2.2.1. Overview
- 9.2.2.2. Products
- 9.2.2.3. SWOT Analysis
- 9.2.2.4. Recent Developments
- 9.2.2.5. Financials (Based on Availability)
- 9.2.3 Weir Group PLC
- 9.2.3.1. Overview
- 9.2.3.2. Products
- 9.2.3.3. SWOT Analysis
- 9.2.3.4. Recent Developments
- 9.2.3.5. Financials (Based on Availability)
- 9.2.4 Weatherford International plc
- 9.2.4.1. Overview
- 9.2.4.2. Products
- 9.2.4.3. SWOT Analysis
- 9.2.4.4. Recent Developments
- 9.2.4.5. Financials (Based on Availability)
- 9.2.5 Schlumberger Ltd
- 9.2.5.1. Overview
- 9.2.5.2. Products
- 9.2.5.3. SWOT Analysis
- 9.2.5.4. Recent Developments
- 9.2.5.5. Financials (Based on Availability)
- 9.2.6 Packers Plus Energy Services Inc
- 9.2.6.1. Overview
- 9.2.6.2. Products
- 9.2.6.3. SWOT Analysis
- 9.2.6.4. Recent Developments
- 9.2.6.5. Financials (Based on Availability)
- 9.2.7 Baker Hughes Company
- 9.2.7.1. Overview
- 9.2.7.2. Products
- 9.2.7.3. SWOT Analysis
- 9.2.7.4. Recent Developments
- 9.2.7.5. Financials (Based on Availability)
- 9.2.8 Halliburton Company
- 9.2.8.1. Overview
- 9.2.8.2. Products
- 9.2.8.3. SWOT Analysis
- 9.2.8.4. Recent Developments
- 9.2.8.5. Financials (Based on Availability)
- 9.2.9 National-Oilwell Varco Inc
- 9.2.9.1. Overview
- 9.2.9.2. Products
- 9.2.9.3. SWOT Analysis
- 9.2.9.4. Recent Developments
- 9.2.9.5. Financials (Based on Availability)
- 9.2.10 Schoeller-Bleckmann Oilfield Equipment AG
- 9.2.10.1. Overview
- 9.2.10.2. Products
- 9.2.10.3. SWOT Analysis
- 9.2.10.4. Recent Developments
- 9.2.10.5. Financials (Based on Availability)
- 9.2.11 Welltec A/S
- 9.2.11.1. Overview
- 9.2.11.2. Products
- 9.2.11.3. SWOT Analysis
- 9.2.11.4. Recent Developments
- 9.2.11.5. Financials (Based on Availability)
- 9.2.1 Superior Energy Services Inc
List of Figures
- Figure 1: United States Completion Equipment and Services Market Revenue Breakdown (Million, %) by Product 2024 & 2032
- Figure 2: United States Completion Equipment and Services Market Share (%) by Company 2024
List of Tables
- Table 1: United States Completion Equipment and Services Market Revenue Million Forecast, by Region 2019 & 2032
- Table 2: United States Completion Equipment and Services Market Revenue Million Forecast, by Location of Deployment 2019 & 2032
- Table 3: United States Completion Equipment and Services Market Revenue Million Forecast, by Region 2019 & 2032
- Table 4: United States Completion Equipment and Services Market Revenue Million Forecast, by Country 2019 & 2032
- Table 5: United States United States Completion Equipment and Services Market Revenue (Million) Forecast, by Application 2019 & 2032
- Table 6: Canada United States Completion Equipment and Services Market Revenue (Million) Forecast, by Application 2019 & 2032
- Table 7: Mexico United States Completion Equipment and Services Market Revenue (Million) Forecast, by Application 2019 & 2032
- Table 8: United States Completion Equipment and Services Market Revenue Million Forecast, by Location of Deployment 2019 & 2032
- Table 9: United States Completion Equipment and Services Market Revenue Million Forecast, by Country 2019 & 2032
Frequently Asked Questions
1. What is the projected Compound Annual Growth Rate (CAGR) of the United States Completion Equipment and Services Market?
The projected CAGR is approximately > 2.00%.
2. Which companies are prominent players in the United States Completion Equipment and Services Market?
Key companies in the market include Superior Energy Services Inc, Trican Well Service Ltd, Weir Group PLC, Weatherford International plc, Schlumberger Ltd, Packers Plus Energy Services Inc, Baker Hughes Company, Halliburton Company, National-Oilwell Varco Inc, Schoeller-Bleckmann Oilfield Equipment AG, Welltec A/S.
3. What are the main segments of the United States Completion Equipment and Services Market?
The market segments include Location of Deployment.
4. Can you provide details about the market size?
The market size is estimated to be USD XX Million as of 2022.
5. What are some drivers contributing to market growth?
4.; Global Inclination toward Renewable-based Power Generation4.; Increased Power Demand in Line with the Increasing Population.
6. What are the notable trends driving market growth?
Shale Oil and Gas Production to Drive the Market.
7. Are there any restraints impacting market growth?
4.; High Initial Cost.
8. Can you provide examples of recent developments in the market?
N/A
9. What pricing options are available for accessing the report?
Pricing options include single-user, multi-user, and enterprise licenses priced at USD 3800, USD 4500, and USD 5800 respectively.
10. Is the market size provided in terms of value or volume?
The market size is provided in terms of value, measured in Million.
11. Are there any specific market keywords associated with the report?
Yes, the market keyword associated with the report is "United States Completion Equipment and Services Market," which aids in identifying and referencing the specific market segment covered.
12. How do I determine which pricing option suits my needs best?
The pricing options vary based on user requirements and access needs. Individual users may opt for single-user licenses, while businesses requiring broader access may choose multi-user or enterprise licenses for cost-effective access to the report.
13. Are there any additional resources or data provided in the United States Completion Equipment and Services Market report?
While the report offers comprehensive insights, it's advisable to review the specific contents or supplementary materials provided to ascertain if additional resources or data are available.
14. How can I stay updated on further developments or reports in the United States Completion Equipment and Services Market?
To stay informed about further developments, trends, and reports in the United States Completion Equipment and Services Market, consider subscribing to industry newsletters, following relevant companies and organizations, or regularly checking reputable industry news sources and publications.
Methodology
Step 1 - Identification of Relevant Samples Size from Population Database


Step 2 - Approaches for Defining Global Market Size (Value, Volume* & Price*)

Note*: In applicable scenarios
Step 3 - Data Sources
Primary Research
- Web Analytics
- Survey Reports
- Research Institute
- Latest Research Reports
- Opinion Leaders
Secondary Research
- Annual Reports
- White Paper
- Latest Press Release
- Industry Association
- Paid Database
- Investor Presentations

Step 4 - Data Triangulation
Involves using different sources of information in order to increase the validity of a study
These sources are likely to be stakeholders in a program - participants, other researchers, program staff, other community members, and so on.
Then we put all data in single framework & apply various statistical tools to find out the dynamic on the market.
During the analysis stage, feedback from the stakeholder groups would be compared to determine areas of agreement as well as areas of divergence
