

Key Insights
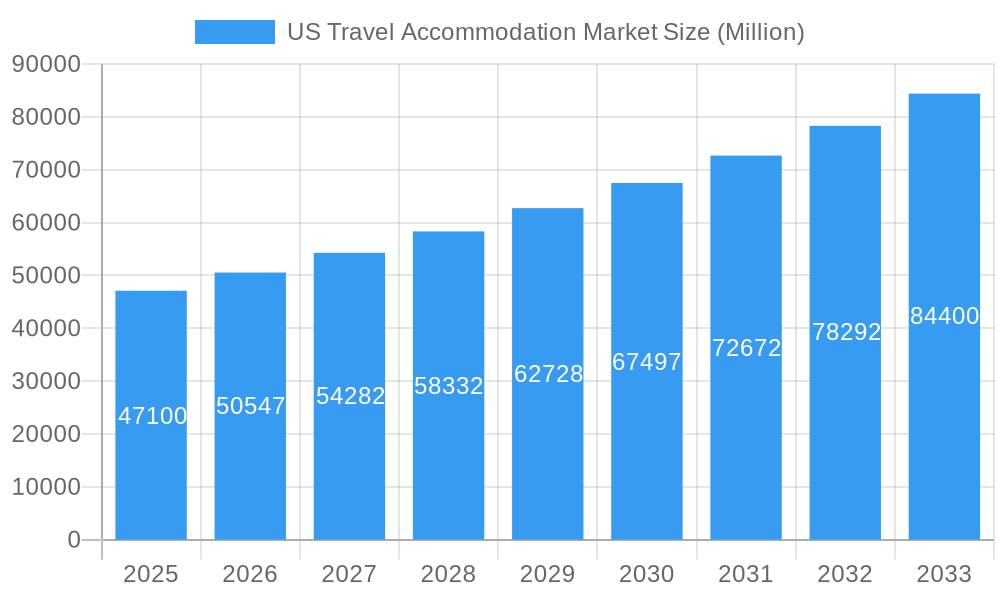
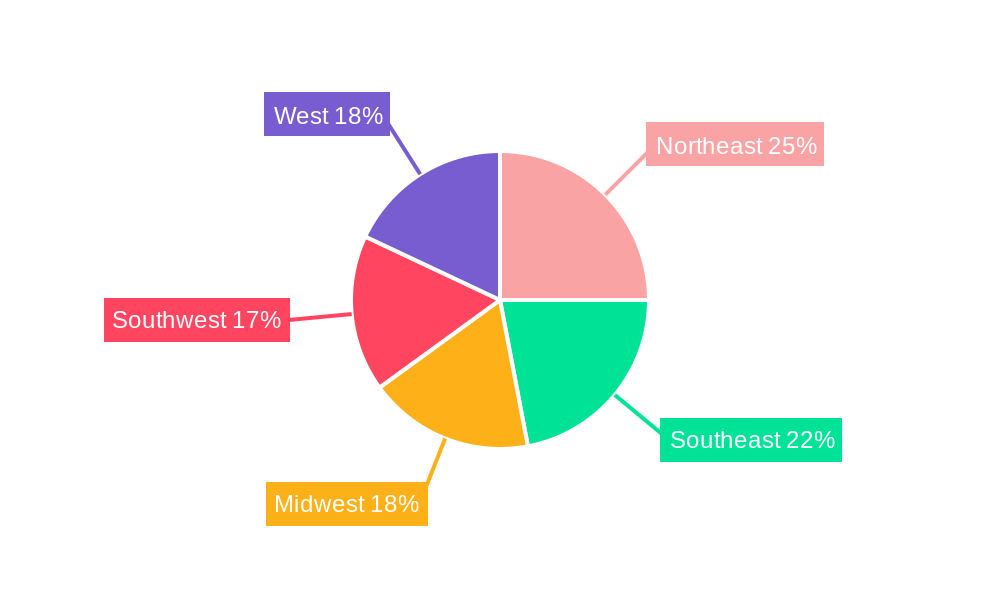
The US travel accommodation market, valued at $47.10 billion in 2025, is projected to experience robust growth, exceeding a 7% CAGR from 2025 to 2033. This expansion is fueled by several key drivers. Increased disposable incomes and a growing preference for leisure travel, particularly among millennials and Gen Z, are significantly boosting demand. The rise of online travel agencies (OTAs) like Expedia, Booking.com, and Airbnb, offering convenience and competitive pricing, further contributes to market growth. The market is segmented by platform (mobile apps and websites) and booking mode (third-party and direct portals), with mobile apps witnessing particularly rapid adoption. While the ongoing economic uncertainty presents a potential restraint, the inherent resilience of the travel sector and the innovative offerings of accommodation providers are expected to mitigate these challenges. Regional variations exist, with the Northeast, Southeast, Midwest, Southwest, and West regions all contributing to the overall market size, though specific regional market shares would require further analysis. The historical period (2019-2024) likely reflected fluctuating trends influenced by global events, establishing a baseline for the projected growth trajectory.
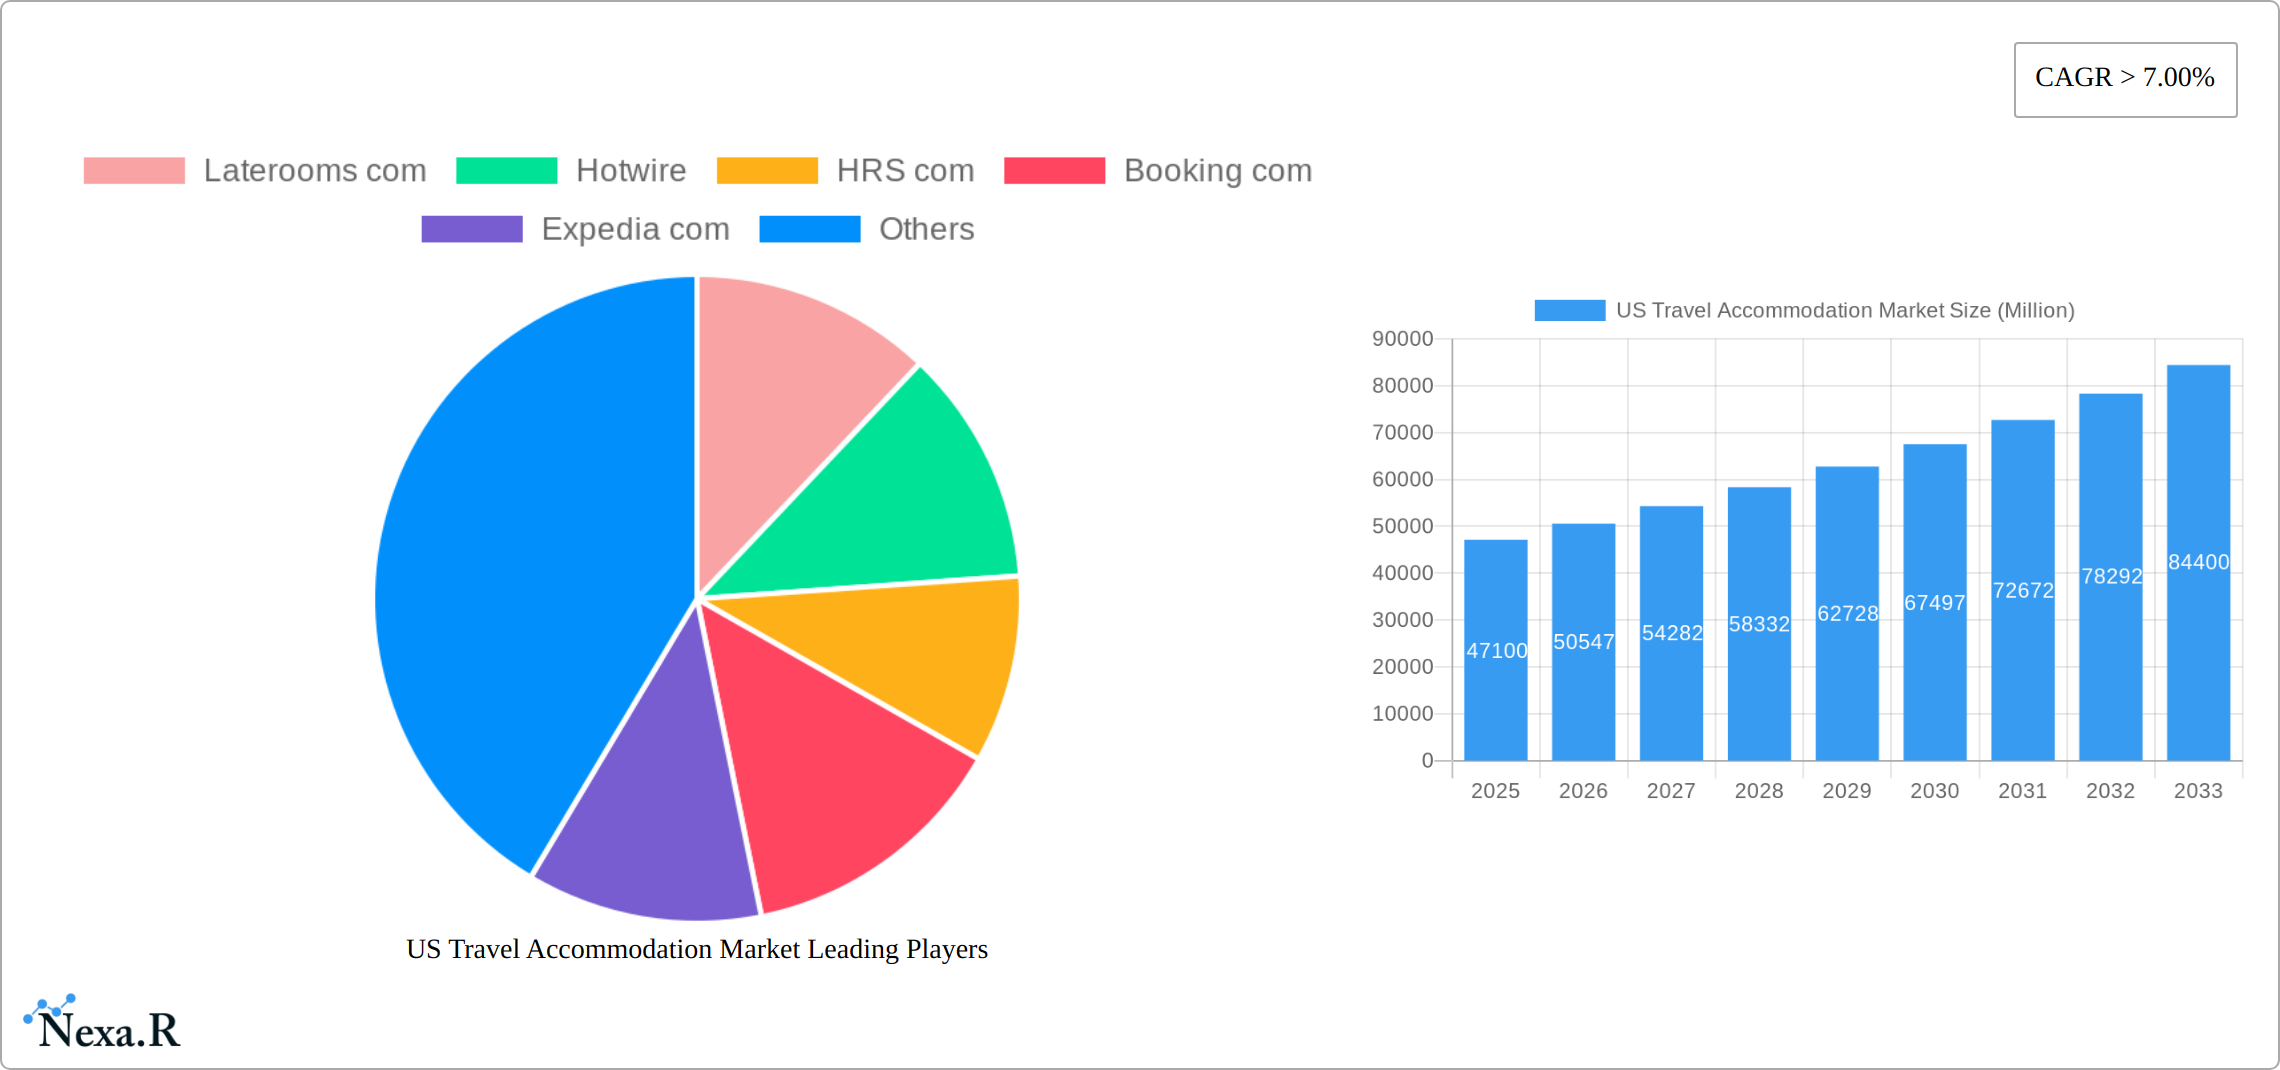
US Travel Accommodation Market Market Size (In Billion)
The competitive landscape is highly fragmented, with major players including Booking.com, Expedia, Airbnb, and others vying for market share. These companies continuously invest in technology and marketing to enhance user experience and attract customers. Differentiation strategies, such as specialized niche offerings (e.g., eco-friendly accommodations, luxury stays) are gaining traction, allowing smaller players to compete effectively. The future of the US travel accommodation market hinges on factors including technological advancements (e.g., AI-powered booking tools, personalized travel recommendations), evolving consumer preferences, and the overall economic climate. The continued expansion of the OTA sector and the increasing popularity of alternative accommodation options like Airbnb suggest continued growth potential within this dynamic market.
US Travel Accommodation Market Company Market Share
US Travel Accommodation Market Report: 2019-2033
This comprehensive report provides an in-depth analysis of the US travel accommodation market, encompassing historical data (2019-2024), the base year (2025), and a detailed forecast (2025-2033). It examines market dynamics, growth trends, dominant segments, key players, and emerging opportunities within this lucrative sector. The report is crucial for industry professionals, investors, and strategic decision-makers seeking to understand and capitalize on the evolving landscape of US travel accommodations. The market is segmented by platform type (Mobile Application, Website) and booking type (Third Party online portals, Direct/Captive portals).
US Travel Accommodation Market Market Dynamics & Structure
The US travel accommodation market is a highly dynamic and competitive landscape, characterized by significant consolidation, technological advancements, and evolving consumer preferences. Market concentration is relatively high, with a few major players holding substantial market share. The market size in 2025 is estimated at $XX Billion. Technological innovation, particularly in areas such as online booking platforms, mobile applications, and personalized travel recommendations, significantly drives market growth. However, regulatory frameworks related to data privacy, consumer protection, and fair competition pose challenges. The emergence of alternative accommodation options, such as Airbnb, presents a competitive threat to traditional hotels. Demographic shifts, such as the rise of millennial and Gen Z travelers with distinct preferences, further shape market dynamics. M&A activity has been considerable, with xx deals recorded in the past five years, averaging xx million USD in deal value per annum.
- Market Concentration: High, with top 5 players controlling xx% of market share in 2025.
- Technological Innovation: Driving force behind improved booking experiences, personalized services, and dynamic pricing models.
- Regulatory Framework: Influences data privacy, consumer protection, and competition policies.
- Competitive Substitutes: Airbnb and other alternative accommodations challenge traditional hotel chains.
- End-User Demographics: Millennials and Gen Z are driving demand for unique experiences and personalized travel options.
- M&A Trends: Significant consolidation activity, reflecting a move toward market dominance and scale.
US Travel Accommodation Market Growth Trends & Insights
The US travel accommodation market experienced significant growth during the historical period (2019-2024), driven by factors such as increasing disposable incomes, rising tourism, and the proliferation of online booking platforms. The market is projected to continue its expansion throughout the forecast period (2025-2033), exhibiting a Compound Annual Growth Rate (CAGR) of xx%. Technological disruptions, particularly the adoption of mobile booking apps and AI-powered travel recommendations, are reshaping consumer behavior. Consumers increasingly prioritize personalized experiences, value-added services, and seamless booking processes. Market penetration of online booking platforms has reached xx% in 2025, projected to rise to xx% by 2033. The shift toward mobile-first booking is also evident, with mobile applications accounting for xx% of all bookings in 2025.
Dominant Regions, Countries, or Segments in US Travel Accommodation Market
The US travel accommodation market is geographically diverse, with significant revenue generation concentrated in major metropolitan areas and popular tourist destinations. California, Florida, and New York consistently rank among the top performers. However, growth rates vary considerably across regions. Market segmentation reveals a dynamic landscape. The mobile application segment exhibits robust growth, fueled by rising smartphone penetration and consumer preference for seamless, on-the-go booking. Simultaneously, third-party online travel portals (OTAs) maintain a substantial market share, leveraging extensive customer reach and competitive pricing strategies. The increasing popularity of short-term rentals, such as those offered through platforms like Airbnb and VRBO, also significantly impacts the overall market share distribution. This diversification presents both opportunities and challenges for established players.
- Key Drivers (Mobile Application Segment): High smartphone penetration, increased mobile payment adoption, convenience, personalized offers, and location-based services integration.
- Key Drivers (Third-Party Online Portals): Wide selection of accommodations, competitive pricing, user-friendly interfaces, robust customer reviews, and loyalty programs.
- Key Drivers (Short-Term Rentals): Affordability, unique lodging options, home-like amenities, and localized experiences.
- Dominance Factors: Strong brand recognition, extensive inventory, effective marketing strategies, technological capabilities, and strategic partnerships.
- Growth Potential: Continued expansion across all segments, driven by technological advancements, evolving consumer preferences, and the rise of alternative accommodations.
US Travel Accommodation Market Product Landscape
The US travel accommodation market encompasses a broad spectrum of offerings, including traditional hotels (ranging from budget-friendly to luxury properties), boutique hotels emphasizing unique experiences, vacation rentals (houses, condos, and apartments), and alternative accommodations like hostels, glamping sites, and unique stays (e.g., treehouses, yurts). Innovation is key, with a strong focus on enhancing the customer journey through personalized recommendations (powered by AI and data analytics), streamlined booking processes, comprehensive loyalty programs, and value-added services such as bundled packages (flights, activities, and transportation), exclusive offers, and concierge services. Technological advancements, including AI-powered chatbots for instant support, virtual reality (VR) tours offering immersive previews, and dynamic pricing strategies optimizing revenue management, are reshaping the industry's operational efficiency and customer engagement. Unique selling propositions (USPs) increasingly emphasize superior customer service, personalized experiences, loyalty program benefits, and innovative amenities tailored to the diverse needs and preferences of modern travelers.
Key Drivers, Barriers & Challenges in US Travel Accommodation Market
Key Drivers:
- Rising disposable incomes and increased leisure travel, particularly among millennials and Gen Z.
- Technological advancements enhancing booking experience, personalization, and customer service.
- Growing popularity of online travel agencies (OTAs) and metasearch engines.
- The rise of experiential travel and the demand for unique accommodations.
Challenges & Restraints:
- Intense competition among established players and disruptive new entrants, leading to price pressures and impacting profitability. (This requires quantifiable data, e.g., "a 15% reduction in average daily rate (ADR) observed in Q3 2023 in select markets").
- Economic downturns and fluctuations in consumer spending, impacting discretionary travel budgets.
- Regulatory changes and compliance costs, particularly regarding data privacy and environmental regulations.
- Supply chain disruptions impacting hotel operations, staffing, and the availability of goods and services.
- Seasonal fluctuations in demand and occupancy rates.
Emerging Opportunities in US Travel Accommodation Market
- Growth in sustainable and eco-friendly travel options, catering to environmentally conscious travelers.
- Increasing demand for unique and experiential travel, driving the popularity of boutique hotels and alternative accommodations.
- Expansion into niche markets, such as luxury travel, adventure tourism, wellness tourism, and bleisure travel (blending business and leisure).
- Development of innovative booking technologies, including AI-powered personalized recommendations and seamless integration with other travel services.
- Leveraging data analytics to improve operational efficiency, personalize marketing efforts, and optimize pricing strategies.
Growth Accelerators in the US Travel Accommodation Market Industry
Technological innovations, strategic partnerships, and expansion into untapped markets are key growth catalysts. The integration of AI and machine learning for personalized recommendations and efficient customer service is transforming the industry. Strategic collaborations between OTAs and airlines, hotels, and activity providers are creating seamless travel experiences. Expanding into underserved markets and offering customized travel packages tailored to specific demographics are crucial strategies for long-term growth.
Key Players Shaping the US Travel Accommodation Market Market
- Laterooms com
- Hotwire
- HRS com
- Booking com
- Expedia com
- Tripadvisor com
- Orbitz com
- Hotels com
- Airbnb com
- Priceline com
- Agoda com
Notable Milestones in US Travel Accommodation Market Sector
- September 2023: Philippine Airlines launched PAL Holidays powered by Expedia Group, expanding the reach of online travel platforms and enhancing the booking experience for a broader audience. This highlights the strategic partnerships forming within the travel sector.
- March 2023: Expedia Group's partnership with Wheel the World significantly improved accessibility for travelers with disabilities, highlighting a growing focus on inclusive travel options and the increasing importance of catering to diverse traveler needs.
- [Add another recent milestone here with a date and brief description] - Consider adding a relevant milestone showcasing technological advancements, a significant merger or acquisition, or a new market trend.
In-Depth US Travel Accommodation Market Market Outlook
The US travel accommodation market is poised for continued growth, driven by technological innovation, evolving consumer preferences, and strategic partnerships. The focus on personalized experiences, sustainable travel, and accessible booking platforms will shape future market dynamics. Strategic investments in technology, expanding into niche segments, and fostering strong brand loyalty will be critical for success in this competitive landscape. The market is expected to reach $YY Billion by 2033.
US Travel Accommodation Market Segmentation
-
1. Platform Type
- 1.1. Mobile Application
- 1.2. Website
-
2. Mode of Booking Type
- 2.1. Third Party online portals
- 2.2. Direct/Captive portals
US Travel Accommodation Market Segmentation By Geography
-
1. North America
- 1.1. United States
- 1.2. Canada
- 1.3. Mexico
-
2. South America
- 2.1. Brazil
- 2.2. Argentina
- 2.3. Rest of South America
-
3. Europe
- 3.1. United Kingdom
- 3.2. Germany
- 3.3. France
- 3.4. Italy
- 3.5. Spain
- 3.6. Russia
- 3.7. Benelux
- 3.8. Nordics
- 3.9. Rest of Europe
-
4. Middle East & Africa
- 4.1. Turkey
- 4.2. Israel
- 4.3. GCC
- 4.4. North Africa
- 4.5. South Africa
- 4.6. Rest of Middle East & Africa
-
5. Asia Pacific
- 5.1. China
- 5.2. India
- 5.3. Japan
- 5.4. South Korea
- 5.5. ASEAN
- 5.6. Oceania
- 5.7. Rest of Asia Pacific
US Travel Accommodation Market Regional Market Share
Geographic Coverage of US Travel Accommodation Market
US Travel Accommodation Market REPORT HIGHLIGHTS
| Aspects | Details |
|---|---|
| Study Period | 2020-2034 |
| Base Year | 2025 |
| Estimated Year | 2026 |
| Forecast Period | 2026-2034 |
| Historical Period | 2020-2025 |
| Growth Rate | CAGR of > 7.00% from 2020-2034 |
| Segmentation |
|
Table of Contents
- 1. Introduction
- 1.1. Research Scope
- 1.2. Market Segmentation
- 1.3. Research Objective
- 1.4. Definitions and Assumptions
- 2. Executive Summary
- 2.1. Market Snapshot
- 3. Market Dynamics
- 3.1. Market Drivers
- 3.2. Market Restrains
- 3.3. Market Trends
- 3.4. Market Opportunities
- 4. Market Factor Analysis
- 4.1. Porters Five Forces
- 4.1.1. Bargaining Power of Suppliers
- 4.1.2. Bargaining Power of Buyers
- 4.1.3. Threat of New Entrants
- 4.1.4. Threat of Substitutes
- 4.1.5. Competitive Rivalry
- 4.2. PESTEL analysis
- 4.3. BCG Analysis
- 4.3.1. Stars (High Growth, High Market Share)
- 4.3.2. Cash Cows (Low Growth, High Market Share)
- 4.3.3. Question Mark (High Growth, Low Market Share)
- 4.3.4. Dogs (Low Growth, Low Market Share)
- 4.4. Ansoff Matrix Analysis
- 4.5. Supply Chain Analysis
- 4.6. Regulatory Landscape
- 4.7. Current Market Potential and Opportunity Assessment (TAM–SAM–SOM Framework)
- 4.8. NRP Analyst Note
- 4.1. Porters Five Forces
- 5. Market Analysis, Insights and Forecast 2021-2033
- 5.1. Market Analysis, Insights and Forecast - by Platform Type
- 5.1.1. Mobile Application
- 5.1.2. Website
- 5.2. Market Analysis, Insights and Forecast - by Mode of Booking Type
- 5.2.1. Third Party online portals
- 5.2.2. Direct/Captive portals
- 5.3. Market Analysis, Insights and Forecast - by Region
- 5.3.1. North America
- 5.3.2. South America
- 5.3.3. Europe
- 5.3.4. Middle East & Africa
- 5.3.5. Asia Pacific
- 5.1. Market Analysis, Insights and Forecast - by Platform Type
- 6. Global US Travel Accommodation Market Analysis, Insights and Forecast, 2021-2033
- 6.1. Market Analysis, Insights and Forecast - by Platform Type
- 6.1.1. Mobile Application
- 6.1.2. Website
- 6.2. Market Analysis, Insights and Forecast - by Mode of Booking Type
- 6.2.1. Third Party online portals
- 6.2.2. Direct/Captive portals
- 6.1. Market Analysis, Insights and Forecast - by Platform Type
- 7. North America US Travel Accommodation Market Analysis, Insights and Forecast, 2020-2032
- 7.1. Market Analysis, Insights and Forecast - by Platform Type
- 7.1.1. Mobile Application
- 7.1.2. Website
- 7.2. Market Analysis, Insights and Forecast - by Mode of Booking Type
- 7.2.1. Third Party online portals
- 7.2.2. Direct/Captive portals
- 7.1. Market Analysis, Insights and Forecast - by Platform Type
- 8. South America US Travel Accommodation Market Analysis, Insights and Forecast, 2020-2032
- 8.1. Market Analysis, Insights and Forecast - by Platform Type
- 8.1.1. Mobile Application
- 8.1.2. Website
- 8.2. Market Analysis, Insights and Forecast - by Mode of Booking Type
- 8.2.1. Third Party online portals
- 8.2.2. Direct/Captive portals
- 8.1. Market Analysis, Insights and Forecast - by Platform Type
- 9. Europe US Travel Accommodation Market Analysis, Insights and Forecast, 2020-2032
- 9.1. Market Analysis, Insights and Forecast - by Platform Type
- 9.1.1. Mobile Application
- 9.1.2. Website
- 9.2. Market Analysis, Insights and Forecast - by Mode of Booking Type
- 9.2.1. Third Party online portals
- 9.2.2. Direct/Captive portals
- 9.1. Market Analysis, Insights and Forecast - by Platform Type
- 10. Middle East & Africa US Travel Accommodation Market Analysis, Insights and Forecast, 2020-2032
- 10.1. Market Analysis, Insights and Forecast - by Platform Type
- 10.1.1. Mobile Application
- 10.1.2. Website
- 10.2. Market Analysis, Insights and Forecast - by Mode of Booking Type
- 10.2.1. Third Party online portals
- 10.2.2. Direct/Captive portals
- 10.1. Market Analysis, Insights and Forecast - by Platform Type
- 11. Asia Pacific US Travel Accommodation Market Analysis, Insights and Forecast, 2020-2032
- 11.1. Market Analysis, Insights and Forecast - by Platform Type
- 11.1.1. Mobile Application
- 11.1.2. Website
- 11.2. Market Analysis, Insights and Forecast - by Mode of Booking Type
- 11.2.1. Third Party online portals
- 11.2.2. Direct/Captive portals
- 11.1. Market Analysis, Insights and Forecast - by Platform Type
- 12. Competitive Analysis
- 12.1. Company Profiles
- 12.1.1 Laterooms com
- 12.1.1.1. Company Overview
- 12.1.1.2. Products
- 12.1.1.3. Company Financials
- 12.1.1.4. SWOT Analysis
- 12.1.2 Hotwire
- 12.1.2.1. Company Overview
- 12.1.2.2. Products
- 12.1.2.3. Company Financials
- 12.1.2.4. SWOT Analysis
- 12.1.3 HRS com
- 12.1.3.1. Company Overview
- 12.1.3.2. Products
- 12.1.3.3. Company Financials
- 12.1.3.4. SWOT Analysis
- 12.1.4 Booking com
- 12.1.4.1. Company Overview
- 12.1.4.2. Products
- 12.1.4.3. Company Financials
- 12.1.4.4. SWOT Analysis
- 12.1.5 Expedia com
- 12.1.5.1. Company Overview
- 12.1.5.2. Products
- 12.1.5.3. Company Financials
- 12.1.5.4. SWOT Analysis
- 12.1.6 Tripadvisor com**List Not Exhaustive
- 12.1.6.1. Company Overview
- 12.1.6.2. Products
- 12.1.6.3. Company Financials
- 12.1.6.4. SWOT Analysis
- 12.1.7 Orbitz com
- 12.1.7.1. Company Overview
- 12.1.7.2. Products
- 12.1.7.3. Company Financials
- 12.1.7.4. SWOT Analysis
- 12.1.8 Hotels com
- 12.1.8.1. Company Overview
- 12.1.8.2. Products
- 12.1.8.3. Company Financials
- 12.1.8.4. SWOT Analysis
- 12.1.9 Airbnb com
- 12.1.9.1. Company Overview
- 12.1.9.2. Products
- 12.1.9.3. Company Financials
- 12.1.9.4. SWOT Analysis
- 12.1.10 Priceline com
- 12.1.10.1. Company Overview
- 12.1.10.2. Products
- 12.1.10.3. Company Financials
- 12.1.10.4. SWOT Analysis
- 12.1.11 Agoda com
- 12.1.11.1. Company Overview
- 12.1.11.2. Products
- 12.1.11.3. Company Financials
- 12.1.11.4. SWOT Analysis
- 12.1.1 Laterooms com
- 12.2. Market Entropy
- 12.2.1 Company's Key Areas Served
- 12.2.2 Recent Developments
- 12.3. Company Market Share Analysis 2025
- 12.3.1 Top 5 Companies Market Share Analysis
- 12.3.2 Top 3 Companies Market Share Analysis
- 12.4. List of Potential Customers
- 13. Research Methodology
List of Figures
- Figure 1: Global US Travel Accommodation Market Revenue Breakdown (Million, %) by Region 2025 & 2033
- Figure 2: North America US Travel Accommodation Market Revenue (Million), by Platform Type 2025 & 2033
- Figure 3: North America US Travel Accommodation Market Revenue Share (%), by Platform Type 2025 & 2033
- Figure 4: North America US Travel Accommodation Market Revenue (Million), by Mode of Booking Type 2025 & 2033
- Figure 5: North America US Travel Accommodation Market Revenue Share (%), by Mode of Booking Type 2025 & 2033
- Figure 6: North America US Travel Accommodation Market Revenue (Million), by Country 2025 & 2033
- Figure 7: North America US Travel Accommodation Market Revenue Share (%), by Country 2025 & 2033
- Figure 8: South America US Travel Accommodation Market Revenue (Million), by Platform Type 2025 & 2033
- Figure 9: South America US Travel Accommodation Market Revenue Share (%), by Platform Type 2025 & 2033
- Figure 10: South America US Travel Accommodation Market Revenue (Million), by Mode of Booking Type 2025 & 2033
- Figure 11: South America US Travel Accommodation Market Revenue Share (%), by Mode of Booking Type 2025 & 2033
- Figure 12: South America US Travel Accommodation Market Revenue (Million), by Country 2025 & 2033
- Figure 13: South America US Travel Accommodation Market Revenue Share (%), by Country 2025 & 2033
- Figure 14: Europe US Travel Accommodation Market Revenue (Million), by Platform Type 2025 & 2033
- Figure 15: Europe US Travel Accommodation Market Revenue Share (%), by Platform Type 2025 & 2033
- Figure 16: Europe US Travel Accommodation Market Revenue (Million), by Mode of Booking Type 2025 & 2033
- Figure 17: Europe US Travel Accommodation Market Revenue Share (%), by Mode of Booking Type 2025 & 2033
- Figure 18: Europe US Travel Accommodation Market Revenue (Million), by Country 2025 & 2033
- Figure 19: Europe US Travel Accommodation Market Revenue Share (%), by Country 2025 & 2033
- Figure 20: Middle East & Africa US Travel Accommodation Market Revenue (Million), by Platform Type 2025 & 2033
- Figure 21: Middle East & Africa US Travel Accommodation Market Revenue Share (%), by Platform Type 2025 & 2033
- Figure 22: Middle East & Africa US Travel Accommodation Market Revenue (Million), by Mode of Booking Type 2025 & 2033
- Figure 23: Middle East & Africa US Travel Accommodation Market Revenue Share (%), by Mode of Booking Type 2025 & 2033
- Figure 24: Middle East & Africa US Travel Accommodation Market Revenue (Million), by Country 2025 & 2033
- Figure 25: Middle East & Africa US Travel Accommodation Market Revenue Share (%), by Country 2025 & 2033
- Figure 26: Asia Pacific US Travel Accommodation Market Revenue (Million), by Platform Type 2025 & 2033
- Figure 27: Asia Pacific US Travel Accommodation Market Revenue Share (%), by Platform Type 2025 & 2033
- Figure 28: Asia Pacific US Travel Accommodation Market Revenue (Million), by Mode of Booking Type 2025 & 2033
- Figure 29: Asia Pacific US Travel Accommodation Market Revenue Share (%), by Mode of Booking Type 2025 & 2033
- Figure 30: Asia Pacific US Travel Accommodation Market Revenue (Million), by Country 2025 & 2033
- Figure 31: Asia Pacific US Travel Accommodation Market Revenue Share (%), by Country 2025 & 2033
List of Tables
- Table 1: Global US Travel Accommodation Market Revenue Million Forecast, by Platform Type 2020 & 2033
- Table 2: Global US Travel Accommodation Market Revenue Million Forecast, by Mode of Booking Type 2020 & 2033
- Table 3: Global US Travel Accommodation Market Revenue Million Forecast, by Region 2020 & 2033
- Table 4: Global US Travel Accommodation Market Revenue Million Forecast, by Platform Type 2020 & 2033
- Table 5: Global US Travel Accommodation Market Revenue Million Forecast, by Mode of Booking Type 2020 & 2033
- Table 6: Global US Travel Accommodation Market Revenue Million Forecast, by Country 2020 & 2033
- Table 7: United States US Travel Accommodation Market Revenue (Million) Forecast, by Application 2020 & 2033
- Table 8: Canada US Travel Accommodation Market Revenue (Million) Forecast, by Application 2020 & 2033
- Table 9: Mexico US Travel Accommodation Market Revenue (Million) Forecast, by Application 2020 & 2033
- Table 10: Global US Travel Accommodation Market Revenue Million Forecast, by Platform Type 2020 & 2033
- Table 11: Global US Travel Accommodation Market Revenue Million Forecast, by Mode of Booking Type 2020 & 2033
- Table 12: Global US Travel Accommodation Market Revenue Million Forecast, by Country 2020 & 2033
- Table 13: Brazil US Travel Accommodation Market Revenue (Million) Forecast, by Application 2020 & 2033
- Table 14: Argentina US Travel Accommodation Market Revenue (Million) Forecast, by Application 2020 & 2033
- Table 15: Rest of South America US Travel Accommodation Market Revenue (Million) Forecast, by Application 2020 & 2033
- Table 16: Global US Travel Accommodation Market Revenue Million Forecast, by Platform Type 2020 & 2033
- Table 17: Global US Travel Accommodation Market Revenue Million Forecast, by Mode of Booking Type 2020 & 2033
- Table 18: Global US Travel Accommodation Market Revenue Million Forecast, by Country 2020 & 2033
- Table 19: United Kingdom US Travel Accommodation Market Revenue (Million) Forecast, by Application 2020 & 2033
- Table 20: Germany US Travel Accommodation Market Revenue (Million) Forecast, by Application 2020 & 2033
- Table 21: France US Travel Accommodation Market Revenue (Million) Forecast, by Application 2020 & 2033
- Table 22: Italy US Travel Accommodation Market Revenue (Million) Forecast, by Application 2020 & 2033
- Table 23: Spain US Travel Accommodation Market Revenue (Million) Forecast, by Application 2020 & 2033
- Table 24: Russia US Travel Accommodation Market Revenue (Million) Forecast, by Application 2020 & 2033
- Table 25: Benelux US Travel Accommodation Market Revenue (Million) Forecast, by Application 2020 & 2033
- Table 26: Nordics US Travel Accommodation Market Revenue (Million) Forecast, by Application 2020 & 2033
- Table 27: Rest of Europe US Travel Accommodation Market Revenue (Million) Forecast, by Application 2020 & 2033
- Table 28: Global US Travel Accommodation Market Revenue Million Forecast, by Platform Type 2020 & 2033
- Table 29: Global US Travel Accommodation Market Revenue Million Forecast, by Mode of Booking Type 2020 & 2033
- Table 30: Global US Travel Accommodation Market Revenue Million Forecast, by Country 2020 & 2033
- Table 31: Turkey US Travel Accommodation Market Revenue (Million) Forecast, by Application 2020 & 2033
- Table 32: Israel US Travel Accommodation Market Revenue (Million) Forecast, by Application 2020 & 2033
- Table 33: GCC US Travel Accommodation Market Revenue (Million) Forecast, by Application 2020 & 2033
- Table 34: North Africa US Travel Accommodation Market Revenue (Million) Forecast, by Application 2020 & 2033
- Table 35: South Africa US Travel Accommodation Market Revenue (Million) Forecast, by Application 2020 & 2033
- Table 36: Rest of Middle East & Africa US Travel Accommodation Market Revenue (Million) Forecast, by Application 2020 & 2033
- Table 37: Global US Travel Accommodation Market Revenue Million Forecast, by Platform Type 2020 & 2033
- Table 38: Global US Travel Accommodation Market Revenue Million Forecast, by Mode of Booking Type 2020 & 2033
- Table 39: Global US Travel Accommodation Market Revenue Million Forecast, by Country 2020 & 2033
- Table 40: China US Travel Accommodation Market Revenue (Million) Forecast, by Application 2020 & 2033
- Table 41: India US Travel Accommodation Market Revenue (Million) Forecast, by Application 2020 & 2033
- Table 42: Japan US Travel Accommodation Market Revenue (Million) Forecast, by Application 2020 & 2033
- Table 43: South Korea US Travel Accommodation Market Revenue (Million) Forecast, by Application 2020 & 2033
- Table 44: ASEAN US Travel Accommodation Market Revenue (Million) Forecast, by Application 2020 & 2033
- Table 45: Oceania US Travel Accommodation Market Revenue (Million) Forecast, by Application 2020 & 2033
- Table 46: Rest of Asia Pacific US Travel Accommodation Market Revenue (Million) Forecast, by Application 2020 & 2033
Frequently Asked Questions
1. What is the projected Compound Annual Growth Rate (CAGR) of the US Travel Accommodation Market?
The projected CAGR is approximately > 7.00%.
2. Which companies are prominent players in the US Travel Accommodation Market?
Key companies in the market include Laterooms com, Hotwire, HRS com, Booking com, Expedia com, Tripadvisor com**List Not Exhaustive, Orbitz com, Hotels com, Airbnb com, Priceline com, Agoda com.
3. What are the main segments of the US Travel Accommodation Market?
The market segments include Platform Type, Mode of Booking Type.
4. Can you provide details about the market size?
The market size is estimated to be USD 47.10 Million as of 2022.
5. What are some drivers contributing to market growth?
Airbnb in United States is Dominating the Market; The US Online Accommodation Market is Booming due to an Increase in Domestic Trips.
6. What are the notable trends driving market growth?
Rise in the Number of Visitors in California.
7. Are there any restraints impacting market growth?
Booking Cancellation.
8. Can you provide examples of recent developments in the market?
September 2023: Philippine Airlines launched PAL Holidays powered by Expedia Group, a one-stop travel website that offers travelers a seamless and comprehensive platform for all their travel needs. The new site is now live in the US, Canada, Australia, and the Philippines. The new platform is powered by Expedia Group’s White Label Template technology. It is designed to help passengers effortlessly plan and book their entire journey, including PAL flights, hotels, transportation, and exciting travel activities, all in one convenient location.
9. What pricing options are available for accessing the report?
Pricing options include single-user, multi-user, and enterprise licenses priced at USD 3800, USD 4500, and USD 5800 respectively.
10. Is the market size provided in terms of value or volume?
The market size is provided in terms of value, measured in Million.
11. Are there any specific market keywords associated with the report?
Yes, the market keyword associated with the report is "US Travel Accommodation Market," which aids in identifying and referencing the specific market segment covered.
12. How do I determine which pricing option suits my needs best?
The pricing options vary based on user requirements and access needs. Individual users may opt for single-user licenses, while businesses requiring broader access may choose multi-user or enterprise licenses for cost-effective access to the report.
13. Are there any additional resources or data provided in the US Travel Accommodation Market report?
While the report offers comprehensive insights, it's advisable to review the specific contents or supplementary materials provided to ascertain if additional resources or data are available.
14. How can I stay updated on further developments or reports in the US Travel Accommodation Market?
To stay informed about further developments, trends, and reports in the US Travel Accommodation Market, consider subscribing to industry newsletters, following relevant companies and organizations, or regularly checking reputable industry news sources and publications.
Methodology
Step 1 - Identification of Relevant Samples Size from Population Database


Step 2 - Approaches for Defining Global Market Size (Value, Volume* & Price*)

Note*: In applicable scenarios
Step 3 - Data Sources
Primary Research
- Web Analytics
- Survey Reports
- Research Institute
- Latest Research Reports
- Opinion Leaders
Secondary Research
- Annual Reports
- White Paper
- Latest Press Release
- Industry Association
- Paid Database
- Investor Presentations

Step 4 - Data Triangulation
Involves using different sources of information in order to increase the validity of a study
These sources are likely to be stakeholders in a program - participants, other researchers, program staff, other community members, and so on.
Then we put all data in single framework & apply various statistical tools to find out the dynamic on the market.
During the analysis stage, feedback from the stakeholder groups would be compared to determine areas of agreement as well as areas of divergence