

Key Insights
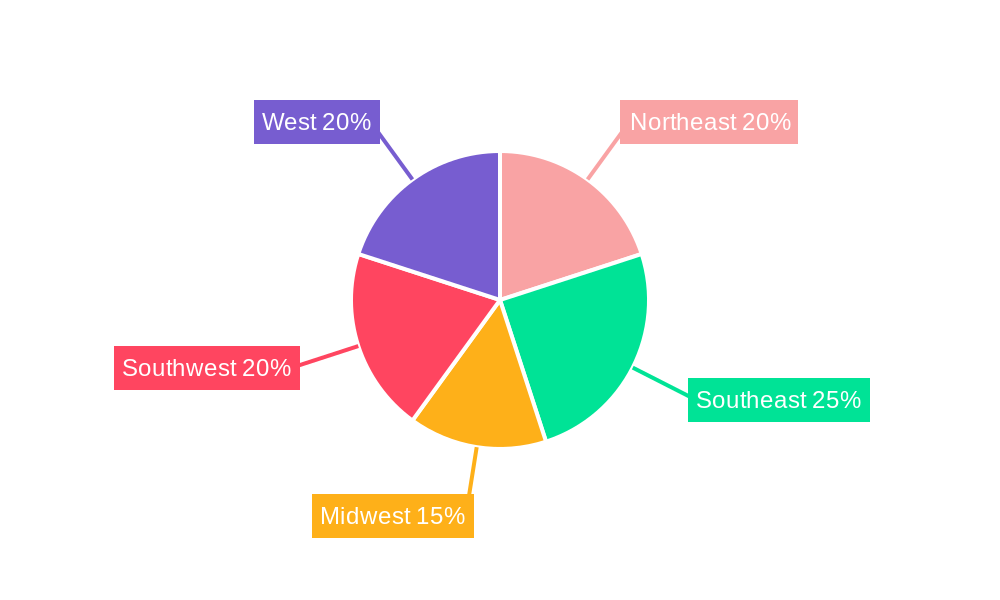
The US amusement and theme park industry, valued at $23.77 billion in 2025, is projected to experience robust growth, exhibiting a Compound Annual Growth Rate (CAGR) exceeding 3.50% from 2025 to 2033. This expansion is fueled by several key drivers. Increased disposable incomes, particularly amongst millennials and Gen Z, coupled with a growing preference for experiential entertainment, are significantly boosting attendance. Furthermore, continuous innovation in ride technology, immersive themed experiences, and strategic investments in park infrastructure are enhancing the overall guest experience and driving repeat visitation. The industry's segmentation, encompassing land and water rides, diverse revenue streams (tickets, food & beverage, merchandise, and hospitality), and a geographically dispersed market across the United States (Northeast, Southeast, Midwest, Southwest, and West), contributes to its resilience and growth potential. While potential economic downturns could act as a restraint, the industry's adaptability and capacity to offer various price points and targeted experiences mitigate this risk. Major players like Disney Parks, Universal Parks & Resorts, Six Flags, and Cedar Fair are leveraging strategic partnerships, brand extensions, and technological advancements to maintain a competitive edge and capture market share. The increasing popularity of family-friendly destinations and the integration of technology, such as augmented and virtual reality experiences, further propel market growth.
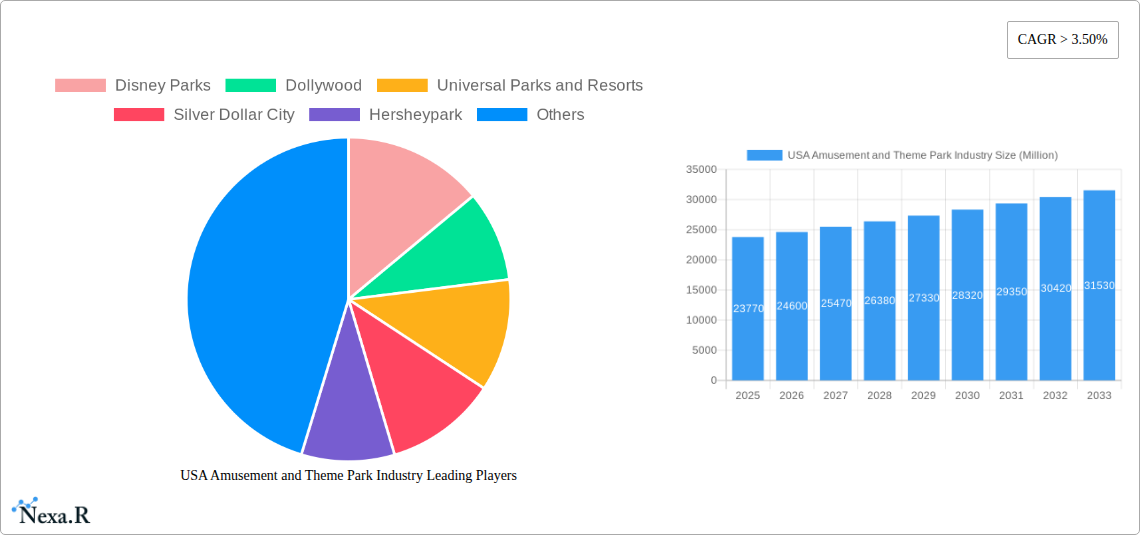
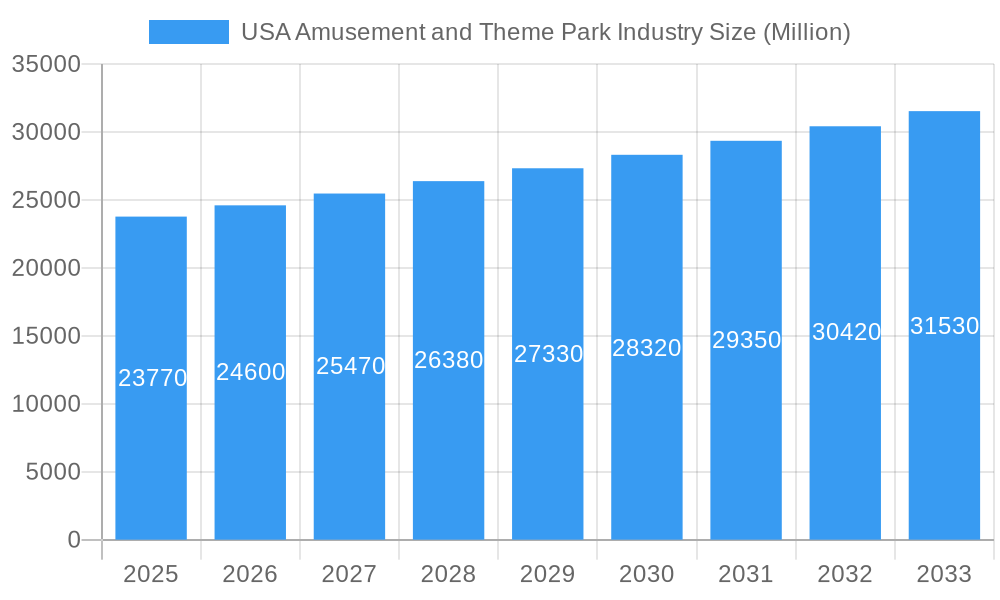
USA Amusement and Theme Park Industry Market Size (In Billion)
The competitive landscape is marked by both established giants and regional players. Disney and Universal, with their globally recognized brands and iconic attractions, maintain dominant positions. However, regional parks like Dollywood and Silver Dollar City are thriving by offering unique, localized experiences catering to specific demographics and preferences. This dynamic interplay between large corporations and smaller, niche players ensures a vibrant and evolving market. The forecast for 2025-2033 anticipates consistent growth, driven by the continuous evolution of the industry's offerings and the enduring appeal of amusement and theme parks as a favored leisure activity for families and individuals alike. The ongoing focus on enhancing safety standards and guest satisfaction will be crucial to maintaining the industry's positive trajectory and fostering its long-term sustainability.
USA Amusement and Theme Park Industry Company Market Share
USA Amusement and Theme Park Industry Market Report: 2019-2033
This comprehensive report provides an in-depth analysis of the USA Amusement and Theme Park industry, covering market dynamics, growth trends, key players, and future outlook. With a study period spanning 2019-2033, a base year of 2025, and a forecast period of 2025-2033, this report is an essential resource for industry professionals, investors, and anyone seeking to understand this dynamic sector. The report analyzes both parent market (Amusement Parks) and child markets (e.g., Water Parks, Theme Parks). Market values are presented in millions of USD.
USA Amusement and Theme Park Industry Market Dynamics & Structure
The US amusement and theme park industry is characterized by a moderately concentrated market structure, with a few major players like Disney Parks, Universal Parks & Resorts, and Six Flags Inc. holding significant market share (estimated at xx% combined in 2025). Technological innovation, particularly in ride technology and immersive experiences, is a key driver, but high initial investment and integration complexities present barriers. Regulatory frameworks concerning safety, accessibility, and environmental impact play a significant role. Competitive substitutes include other forms of entertainment, such as video games and streaming services, impacting overall market growth. End-user demographics are shifting, with a growing emphasis on family-friendly experiences and attractions catering to diverse age groups. M&A activity, as seen in recent acquisitions of hotels near theme parks, is a prominent trend.
- Market Concentration: High (xx% for top 3 players in 2025)
- Technological Innovation: VR/AR integration, robotics, enhanced theming.
- Regulatory Framework: Safety standards, accessibility regulations, environmental concerns.
- Competitive Substitutes: Video games, streaming services, sporting events.
- End-User Demographics: Growing family segment, increased focus on diverse age groups.
- M&A Activity: xx deals recorded between 2019-2024, with increasing focus on hospitality integration.
USA Amusement and Theme Park Industry Growth Trends & Insights
The US amusement and theme park market experienced a period of fluctuation between 2019 and 2024, influenced by global events. However, the market is projected to exhibit robust growth from 2025 onwards. Driven by rising disposable incomes, increasing tourism, and the introduction of innovative attractions, the market size is estimated to reach $xx million in 2025, growing at a CAGR of xx% from 2025 to 2033. This growth is fueled by technological advancements creating immersive experiences and the adaptation of marketing strategies to attract a wider demographic. Consumer behavior trends show increasing demand for personalized experiences, convenient booking options, and enhanced safety measures. The adoption rate of new technologies within the industry is expected to increase, leading to a higher average spend per visitor and improved customer satisfaction.
Dominant Regions, Countries, or Segments in USA Amusement and Theme Park Industry
Florida and California remain dominant regions, driven by the presence of major players like Disney and Universal. However, other states with significant tourism infrastructure are also experiencing growth. The "Tickets" segment continues to be the largest revenue source, but "Foods & Beverages" and "Merchandise" are also substantial revenue streams, showing significant growth potential. The Land Rides segment maintains market dominance due to its broad appeal across age groups, while the Water Rides segment is also steadily growing.
- Key Drivers (Florida & California): Established tourism infrastructure, major theme park presence, favorable climate.
- Revenue Segment Dominance: Tickets (xx% of total revenue in 2025), followed by Foods & Beverages (xx%) and Merchandise (xx%).
- Type Segment Dominance: Land Rides (xx% of total revenue in 2025), followed by Water Rides (xx%).
- Growth Potential: Regional expansion into states with high tourism potential, diversification of revenue streams beyond ticket sales.
USA Amusement and Theme Park Industry Product Landscape
The industry showcases continuous product innovation, with a focus on immersive experiences using virtual and augmented reality, interactive rides, and advanced theming. These innovations cater to evolving consumer preferences, offering unique selling propositions and generating higher customer satisfaction and increased spending. Performance metrics, such as average ride duration, customer satisfaction scores, and revenue per visitor, are crucial indicators of success.
Key Drivers, Barriers & Challenges in USA Amusement and Theme Park Industry
Key Drivers: Technological advancements, increasing disposable incomes, rising tourism, favorable government policies promoting tourism.
Challenges: High capital expenditure required for new attractions, competition from alternative entertainment options, potential for seasonality impacts, workforce management challenges, and supply chain disruptions (e.g., material shortages impacting construction of new attractions resulting in xx million loss in 2024).
Emerging Opportunities in USA Amusement and Theme Park Industry
Untapped markets include smaller regional parks focusing on niche experiences, the integration of e-sports and interactive gaming into amusement parks, and the development of sustainable and eco-friendly practices. Personalized experiences tailored to individual preferences through data analysis and mobile applications represent another significant opportunity.
Growth Accelerators in the USA Amusement and Theme Park Industry Industry
Long-term growth will be fueled by strategic partnerships, the development of advanced technologies creating truly unique experiences, and international market expansion strategies leveraging successful domestic models.
Key Players Shaping the USA Amusement and Theme Park Industry Market
- Disney Parks
- Dollywood
- Universal Parks and Resorts
- Silver Dollar City
- Hersheypark
- Six Flags Inc
- Busch Gardens
- The Island in Pigeon Forge
- Cedar Fair Entertainment Company
- Magic Kingdom Park
- Dells Waterpark
- Seaworld Parks and Entertainment
Notable Milestones in USA Amusement and Theme Park Industry Sector
- September 2023: Crescent Real Estate LLC acquired the Element Orlando Universal Blvd. hotel, expanding hospitality offerings near Icon Park.
- July 2023: Asacha Media Group acquired a majority share in Arrow International Media, the producer of Disney's Animal Kingdom, impacting creative content production within the industry.
In-Depth USA Amusement and Theme Park Industry Market Outlook
The US amusement and theme park industry is poised for continued growth, driven by technological innovation and strategic investments. The focus on immersive experiences, personalized offerings, and sustainable practices will shape future market dynamics. Strategic partnerships and international expansion present significant opportunities for key players to expand market share and drive profitability.
USA Amusement and Theme Park Industry Segmentation
-
1. Type
- 1.1. Land Rides
- 1.2. Water Rides
- 1.3. Other Types
-
2. Source of Revenue
- 2.1. Tickets
- 2.2. Foods & Beverages
- 2.3. Merchandise
- 2.4. Hospitality
- 2.5. Other Source of Revenues
USA Amusement and Theme Park Industry Segmentation By Geography
-
1. North America
- 1.1. United States
- 1.2. Canada
- 1.3. Mexico
-
2. South America
- 2.1. Brazil
- 2.2. Argentina
- 2.3. Rest of South America
-
3. Europe
- 3.1. United Kingdom
- 3.2. Germany
- 3.3. France
- 3.4. Italy
- 3.5. Spain
- 3.6. Russia
- 3.7. Benelux
- 3.8. Nordics
- 3.9. Rest of Europe
-
4. Middle East & Africa
- 4.1. Turkey
- 4.2. Israel
- 4.3. GCC
- 4.4. North Africa
- 4.5. South Africa
- 4.6. Rest of Middle East & Africa
-
5. Asia Pacific
- 5.1. China
- 5.2. India
- 5.3. Japan
- 5.4. South Korea
- 5.5. ASEAN
- 5.6. Oceania
- 5.7. Rest of Asia Pacific
USA Amusement and Theme Park Industry Regional Market Share
Geographic Coverage of USA Amusement and Theme Park Industry
USA Amusement and Theme Park Industry REPORT HIGHLIGHTS
| Aspects | Details |
|---|---|
| Study Period | 2020-2034 |
| Base Year | 2025 |
| Estimated Year | 2026 |
| Forecast Period | 2026-2034 |
| Historical Period | 2020-2025 |
| Growth Rate | CAGR of > 3.50% from 2020-2034 |
| Segmentation |
|
Table of Contents
- 1. Introduction
- 1.1. Research Scope
- 1.2. Market Segmentation
- 1.3. Research Objective
- 1.4. Definitions and Assumptions
- 2. Executive Summary
- 2.1. Market Snapshot
- 3. Market Dynamics
- 3.1. Market Drivers
- 3.2. Market Restrains
- 3.3. Market Trends
- 3.4. Market Opportunities
- 4. Market Factor Analysis
- 4.1. Porters Five Forces
- 4.1.1. Bargaining Power of Suppliers
- 4.1.2. Bargaining Power of Buyers
- 4.1.3. Threat of New Entrants
- 4.1.4. Threat of Substitutes
- 4.1.5. Competitive Rivalry
- 4.2. PESTEL analysis
- 4.3. BCG Analysis
- 4.3.1. Stars (High Growth, High Market Share)
- 4.3.2. Cash Cows (Low Growth, High Market Share)
- 4.3.3. Question Mark (High Growth, Low Market Share)
- 4.3.4. Dogs (Low Growth, Low Market Share)
- 4.4. Ansoff Matrix Analysis
- 4.5. Supply Chain Analysis
- 4.6. Regulatory Landscape
- 4.7. Current Market Potential and Opportunity Assessment (TAM–SAM–SOM Framework)
- 4.8. NRP Analyst Note
- 4.1. Porters Five Forces
- 5. Market Analysis, Insights and Forecast 2021-2033
- 5.1. Market Analysis, Insights and Forecast - by Type
- 5.1.1. Land Rides
- 5.1.2. Water Rides
- 5.1.3. Other Types
- 5.2. Market Analysis, Insights and Forecast - by Source of Revenue
- 5.2.1. Tickets
- 5.2.2. Foods & Beverages
- 5.2.3. Merchandise
- 5.2.4. Hospitality
- 5.2.5. Other Source of Revenues
- 5.3. Market Analysis, Insights and Forecast - by Region
- 5.3.1. North America
- 5.3.2. South America
- 5.3.3. Europe
- 5.3.4. Middle East & Africa
- 5.3.5. Asia Pacific
- 5.1. Market Analysis, Insights and Forecast - by Type
- 6. Global USA Amusement and Theme Park Industry Analysis, Insights and Forecast, 2021-2033
- 6.1. Market Analysis, Insights and Forecast - by Type
- 6.1.1. Land Rides
- 6.1.2. Water Rides
- 6.1.3. Other Types
- 6.2. Market Analysis, Insights and Forecast - by Source of Revenue
- 6.2.1. Tickets
- 6.2.2. Foods & Beverages
- 6.2.3. Merchandise
- 6.2.4. Hospitality
- 6.2.5. Other Source of Revenues
- 6.1. Market Analysis, Insights and Forecast - by Type
- 7. North America USA Amusement and Theme Park Industry Analysis, Insights and Forecast, 2020-2032
- 7.1. Market Analysis, Insights and Forecast - by Type
- 7.1.1. Land Rides
- 7.1.2. Water Rides
- 7.1.3. Other Types
- 7.2. Market Analysis, Insights and Forecast - by Source of Revenue
- 7.2.1. Tickets
- 7.2.2. Foods & Beverages
- 7.2.3. Merchandise
- 7.2.4. Hospitality
- 7.2.5. Other Source of Revenues
- 7.1. Market Analysis, Insights and Forecast - by Type
- 8. South America USA Amusement and Theme Park Industry Analysis, Insights and Forecast, 2020-2032
- 8.1. Market Analysis, Insights and Forecast - by Type
- 8.1.1. Land Rides
- 8.1.2. Water Rides
- 8.1.3. Other Types
- 8.2. Market Analysis, Insights and Forecast - by Source of Revenue
- 8.2.1. Tickets
- 8.2.2. Foods & Beverages
- 8.2.3. Merchandise
- 8.2.4. Hospitality
- 8.2.5. Other Source of Revenues
- 8.1. Market Analysis, Insights and Forecast - by Type
- 9. Europe USA Amusement and Theme Park Industry Analysis, Insights and Forecast, 2020-2032
- 9.1. Market Analysis, Insights and Forecast - by Type
- 9.1.1. Land Rides
- 9.1.2. Water Rides
- 9.1.3. Other Types
- 9.2. Market Analysis, Insights and Forecast - by Source of Revenue
- 9.2.1. Tickets
- 9.2.2. Foods & Beverages
- 9.2.3. Merchandise
- 9.2.4. Hospitality
- 9.2.5. Other Source of Revenues
- 9.1. Market Analysis, Insights and Forecast - by Type
- 10. Middle East & Africa USA Amusement and Theme Park Industry Analysis, Insights and Forecast, 2020-2032
- 10.1. Market Analysis, Insights and Forecast - by Type
- 10.1.1. Land Rides
- 10.1.2. Water Rides
- 10.1.3. Other Types
- 10.2. Market Analysis, Insights and Forecast - by Source of Revenue
- 10.2.1. Tickets
- 10.2.2. Foods & Beverages
- 10.2.3. Merchandise
- 10.2.4. Hospitality
- 10.2.5. Other Source of Revenues
- 10.1. Market Analysis, Insights and Forecast - by Type
- 11. Asia Pacific USA Amusement and Theme Park Industry Analysis, Insights and Forecast, 2020-2032
- 11.1. Market Analysis, Insights and Forecast - by Type
- 11.1.1. Land Rides
- 11.1.2. Water Rides
- 11.1.3. Other Types
- 11.2. Market Analysis, Insights and Forecast - by Source of Revenue
- 11.2.1. Tickets
- 11.2.2. Foods & Beverages
- 11.2.3. Merchandise
- 11.2.4. Hospitality
- 11.2.5. Other Source of Revenues
- 11.1. Market Analysis, Insights and Forecast - by Type
- 12. Competitive Analysis
- 12.1. Company Profiles
- 12.1.1 Disney Parks
- 12.1.1.1. Company Overview
- 12.1.1.2. Products
- 12.1.1.3. Company Financials
- 12.1.1.4. SWOT Analysis
- 12.1.2 Dollywood
- 12.1.2.1. Company Overview
- 12.1.2.2. Products
- 12.1.2.3. Company Financials
- 12.1.2.4. SWOT Analysis
- 12.1.3 Universal Parks and Resorts
- 12.1.3.1. Company Overview
- 12.1.3.2. Products
- 12.1.3.3. Company Financials
- 12.1.3.4. SWOT Analysis
- 12.1.4 Silver Dollar City
- 12.1.4.1. Company Overview
- 12.1.4.2. Products
- 12.1.4.3. Company Financials
- 12.1.4.4. SWOT Analysis
- 12.1.5 Hersheypark
- 12.1.5.1. Company Overview
- 12.1.5.2. Products
- 12.1.5.3. Company Financials
- 12.1.5.4. SWOT Analysis
- 12.1.6 Six Flags Inc
- 12.1.6.1. Company Overview
- 12.1.6.2. Products
- 12.1.6.3. Company Financials
- 12.1.6.4. SWOT Analysis
- 12.1.7 Busch Garden
- 12.1.7.1. Company Overview
- 12.1.7.2. Products
- 12.1.7.3. Company Financials
- 12.1.7.4. SWOT Analysis
- 12.1.8 The Island in Pigeon Forge
- 12.1.8.1. Company Overview
- 12.1.8.2. Products
- 12.1.8.3. Company Financials
- 12.1.8.4. SWOT Analysis
- 12.1.9 Cedar Fair Entertainment Company
- 12.1.9.1. Company Overview
- 12.1.9.2. Products
- 12.1.9.3. Company Financials
- 12.1.9.4. SWOT Analysis
- 12.1.10 Magic Kingdom Park
- 12.1.10.1. Company Overview
- 12.1.10.2. Products
- 12.1.10.3. Company Financials
- 12.1.10.4. SWOT Analysis
- 12.1.11 Dells Waterpark**List Not Exhaustive
- 12.1.11.1. Company Overview
- 12.1.11.2. Products
- 12.1.11.3. Company Financials
- 12.1.11.4. SWOT Analysis
- 12.1.12 Seaworld Parks and Entertainment
- 12.1.12.1. Company Overview
- 12.1.12.2. Products
- 12.1.12.3. Company Financials
- 12.1.12.4. SWOT Analysis
- 12.1.1 Disney Parks
- 12.2. Market Entropy
- 12.2.1 Company's Key Areas Served
- 12.2.2 Recent Developments
- 12.3. Company Market Share Analysis 2025
- 12.3.1 Top 5 Companies Market Share Analysis
- 12.3.2 Top 3 Companies Market Share Analysis
- 12.4. List of Potential Customers
- 13. Research Methodology
List of Figures
- Figure 1: Global USA Amusement and Theme Park Industry Revenue Breakdown (Million, %) by Region 2025 & 2033
- Figure 2: North America USA Amusement and Theme Park Industry Revenue (Million), by Type 2025 & 2033
- Figure 3: North America USA Amusement and Theme Park Industry Revenue Share (%), by Type 2025 & 2033
- Figure 4: North America USA Amusement and Theme Park Industry Revenue (Million), by Source of Revenue 2025 & 2033
- Figure 5: North America USA Amusement and Theme Park Industry Revenue Share (%), by Source of Revenue 2025 & 2033
- Figure 6: North America USA Amusement and Theme Park Industry Revenue (Million), by Country 2025 & 2033
- Figure 7: North America USA Amusement and Theme Park Industry Revenue Share (%), by Country 2025 & 2033
- Figure 8: South America USA Amusement and Theme Park Industry Revenue (Million), by Type 2025 & 2033
- Figure 9: South America USA Amusement and Theme Park Industry Revenue Share (%), by Type 2025 & 2033
- Figure 10: South America USA Amusement and Theme Park Industry Revenue (Million), by Source of Revenue 2025 & 2033
- Figure 11: South America USA Amusement and Theme Park Industry Revenue Share (%), by Source of Revenue 2025 & 2033
- Figure 12: South America USA Amusement and Theme Park Industry Revenue (Million), by Country 2025 & 2033
- Figure 13: South America USA Amusement and Theme Park Industry Revenue Share (%), by Country 2025 & 2033
- Figure 14: Europe USA Amusement and Theme Park Industry Revenue (Million), by Type 2025 & 2033
- Figure 15: Europe USA Amusement and Theme Park Industry Revenue Share (%), by Type 2025 & 2033
- Figure 16: Europe USA Amusement and Theme Park Industry Revenue (Million), by Source of Revenue 2025 & 2033
- Figure 17: Europe USA Amusement and Theme Park Industry Revenue Share (%), by Source of Revenue 2025 & 2033
- Figure 18: Europe USA Amusement and Theme Park Industry Revenue (Million), by Country 2025 & 2033
- Figure 19: Europe USA Amusement and Theme Park Industry Revenue Share (%), by Country 2025 & 2033
- Figure 20: Middle East & Africa USA Amusement and Theme Park Industry Revenue (Million), by Type 2025 & 2033
- Figure 21: Middle East & Africa USA Amusement and Theme Park Industry Revenue Share (%), by Type 2025 & 2033
- Figure 22: Middle East & Africa USA Amusement and Theme Park Industry Revenue (Million), by Source of Revenue 2025 & 2033
- Figure 23: Middle East & Africa USA Amusement and Theme Park Industry Revenue Share (%), by Source of Revenue 2025 & 2033
- Figure 24: Middle East & Africa USA Amusement and Theme Park Industry Revenue (Million), by Country 2025 & 2033
- Figure 25: Middle East & Africa USA Amusement and Theme Park Industry Revenue Share (%), by Country 2025 & 2033
- Figure 26: Asia Pacific USA Amusement and Theme Park Industry Revenue (Million), by Type 2025 & 2033
- Figure 27: Asia Pacific USA Amusement and Theme Park Industry Revenue Share (%), by Type 2025 & 2033
- Figure 28: Asia Pacific USA Amusement and Theme Park Industry Revenue (Million), by Source of Revenue 2025 & 2033
- Figure 29: Asia Pacific USA Amusement and Theme Park Industry Revenue Share (%), by Source of Revenue 2025 & 2033
- Figure 30: Asia Pacific USA Amusement and Theme Park Industry Revenue (Million), by Country 2025 & 2033
- Figure 31: Asia Pacific USA Amusement and Theme Park Industry Revenue Share (%), by Country 2025 & 2033
List of Tables
- Table 1: Global USA Amusement and Theme Park Industry Revenue Million Forecast, by Type 2020 & 2033
- Table 2: Global USA Amusement and Theme Park Industry Revenue Million Forecast, by Source of Revenue 2020 & 2033
- Table 3: Global USA Amusement and Theme Park Industry Revenue Million Forecast, by Region 2020 & 2033
- Table 4: Global USA Amusement and Theme Park Industry Revenue Million Forecast, by Type 2020 & 2033
- Table 5: Global USA Amusement and Theme Park Industry Revenue Million Forecast, by Source of Revenue 2020 & 2033
- Table 6: Global USA Amusement and Theme Park Industry Revenue Million Forecast, by Country 2020 & 2033
- Table 7: United States USA Amusement and Theme Park Industry Revenue (Million) Forecast, by Application 2020 & 2033
- Table 8: Canada USA Amusement and Theme Park Industry Revenue (Million) Forecast, by Application 2020 & 2033
- Table 9: Mexico USA Amusement and Theme Park Industry Revenue (Million) Forecast, by Application 2020 & 2033
- Table 10: Global USA Amusement and Theme Park Industry Revenue Million Forecast, by Type 2020 & 2033
- Table 11: Global USA Amusement and Theme Park Industry Revenue Million Forecast, by Source of Revenue 2020 & 2033
- Table 12: Global USA Amusement and Theme Park Industry Revenue Million Forecast, by Country 2020 & 2033
- Table 13: Brazil USA Amusement and Theme Park Industry Revenue (Million) Forecast, by Application 2020 & 2033
- Table 14: Argentina USA Amusement and Theme Park Industry Revenue (Million) Forecast, by Application 2020 & 2033
- Table 15: Rest of South America USA Amusement and Theme Park Industry Revenue (Million) Forecast, by Application 2020 & 2033
- Table 16: Global USA Amusement and Theme Park Industry Revenue Million Forecast, by Type 2020 & 2033
- Table 17: Global USA Amusement and Theme Park Industry Revenue Million Forecast, by Source of Revenue 2020 & 2033
- Table 18: Global USA Amusement and Theme Park Industry Revenue Million Forecast, by Country 2020 & 2033
- Table 19: United Kingdom USA Amusement and Theme Park Industry Revenue (Million) Forecast, by Application 2020 & 2033
- Table 20: Germany USA Amusement and Theme Park Industry Revenue (Million) Forecast, by Application 2020 & 2033
- Table 21: France USA Amusement and Theme Park Industry Revenue (Million) Forecast, by Application 2020 & 2033
- Table 22: Italy USA Amusement and Theme Park Industry Revenue (Million) Forecast, by Application 2020 & 2033
- Table 23: Spain USA Amusement and Theme Park Industry Revenue (Million) Forecast, by Application 2020 & 2033
- Table 24: Russia USA Amusement and Theme Park Industry Revenue (Million) Forecast, by Application 2020 & 2033
- Table 25: Benelux USA Amusement and Theme Park Industry Revenue (Million) Forecast, by Application 2020 & 2033
- Table 26: Nordics USA Amusement and Theme Park Industry Revenue (Million) Forecast, by Application 2020 & 2033
- Table 27: Rest of Europe USA Amusement and Theme Park Industry Revenue (Million) Forecast, by Application 2020 & 2033
- Table 28: Global USA Amusement and Theme Park Industry Revenue Million Forecast, by Type 2020 & 2033
- Table 29: Global USA Amusement and Theme Park Industry Revenue Million Forecast, by Source of Revenue 2020 & 2033
- Table 30: Global USA Amusement and Theme Park Industry Revenue Million Forecast, by Country 2020 & 2033
- Table 31: Turkey USA Amusement and Theme Park Industry Revenue (Million) Forecast, by Application 2020 & 2033
- Table 32: Israel USA Amusement and Theme Park Industry Revenue (Million) Forecast, by Application 2020 & 2033
- Table 33: GCC USA Amusement and Theme Park Industry Revenue (Million) Forecast, by Application 2020 & 2033
- Table 34: North Africa USA Amusement and Theme Park Industry Revenue (Million) Forecast, by Application 2020 & 2033
- Table 35: South Africa USA Amusement and Theme Park Industry Revenue (Million) Forecast, by Application 2020 & 2033
- Table 36: Rest of Middle East & Africa USA Amusement and Theme Park Industry Revenue (Million) Forecast, by Application 2020 & 2033
- Table 37: Global USA Amusement and Theme Park Industry Revenue Million Forecast, by Type 2020 & 2033
- Table 38: Global USA Amusement and Theme Park Industry Revenue Million Forecast, by Source of Revenue 2020 & 2033
- Table 39: Global USA Amusement and Theme Park Industry Revenue Million Forecast, by Country 2020 & 2033
- Table 40: China USA Amusement and Theme Park Industry Revenue (Million) Forecast, by Application 2020 & 2033
- Table 41: India USA Amusement and Theme Park Industry Revenue (Million) Forecast, by Application 2020 & 2033
- Table 42: Japan USA Amusement and Theme Park Industry Revenue (Million) Forecast, by Application 2020 & 2033
- Table 43: South Korea USA Amusement and Theme Park Industry Revenue (Million) Forecast, by Application 2020 & 2033
- Table 44: ASEAN USA Amusement and Theme Park Industry Revenue (Million) Forecast, by Application 2020 & 2033
- Table 45: Oceania USA Amusement and Theme Park Industry Revenue (Million) Forecast, by Application 2020 & 2033
- Table 46: Rest of Asia Pacific USA Amusement and Theme Park Industry Revenue (Million) Forecast, by Application 2020 & 2033
Frequently Asked Questions
1. What is the projected Compound Annual Growth Rate (CAGR) of the USA Amusement and Theme Park Industry?
The projected CAGR is approximately > 3.50%.
2. Which companies are prominent players in the USA Amusement and Theme Park Industry?
Key companies in the market include Disney Parks, Dollywood, Universal Parks and Resorts, Silver Dollar City, Hersheypark, Six Flags Inc, Busch Garden, The Island in Pigeon Forge, Cedar Fair Entertainment Company, Magic Kingdom Park, Dells Waterpark**List Not Exhaustive, Seaworld Parks and Entertainment.
3. What are the main segments of the USA Amusement and Theme Park Industry?
The market segments include Type, Source of Revenue.
4. Can you provide details about the market size?
The market size is estimated to be USD 23.77 Million as of 2022.
5. What are some drivers contributing to market growth?
The number of baby-boomer tourists is expected to increase. which will fuel the growth of the worldwide amusement park market.; Incorporating energy-saving innovations like LED lighting and solar panels.
6. What are the notable trends driving market growth?
Increase in the number of visitors in amusement and theme parks.
7. Are there any restraints impacting market growth?
Theme parks are raising admission costs and letting guests ride every ride without waiting in queue; Theme parks utilising virtual reality are becoming more and more common..
8. Can you provide examples of recent developments in the market?
September 2023: Crescent Real Estate LLC acquired the Element Orlando Universal Blvd., a 165-key hotel operated under a franchise agreement with Marriott International. Located just outside the confines of the mixed-use development known as Icon Park, Element Orlando hotel guests have immediate access to 20 acres of entertainment opportunities.
9. What pricing options are available for accessing the report?
Pricing options include single-user, multi-user, and enterprise licenses priced at USD 3800, USD 4500, and USD 5800 respectively.
10. Is the market size provided in terms of value or volume?
The market size is provided in terms of value, measured in Million.
11. Are there any specific market keywords associated with the report?
Yes, the market keyword associated with the report is "USA Amusement and Theme Park Industry," which aids in identifying and referencing the specific market segment covered.
12. How do I determine which pricing option suits my needs best?
The pricing options vary based on user requirements and access needs. Individual users may opt for single-user licenses, while businesses requiring broader access may choose multi-user or enterprise licenses for cost-effective access to the report.
13. Are there any additional resources or data provided in the USA Amusement and Theme Park Industry report?
While the report offers comprehensive insights, it's advisable to review the specific contents or supplementary materials provided to ascertain if additional resources or data are available.
14. How can I stay updated on further developments or reports in the USA Amusement and Theme Park Industry?
To stay informed about further developments, trends, and reports in the USA Amusement and Theme Park Industry, consider subscribing to industry newsletters, following relevant companies and organizations, or regularly checking reputable industry news sources and publications.
Methodology
Step 1 - Identification of Relevant Samples Size from Population Database


Step 2 - Approaches for Defining Global Market Size (Value, Volume* & Price*)

Note*: In applicable scenarios
Step 3 - Data Sources
Primary Research
- Web Analytics
- Survey Reports
- Research Institute
- Latest Research Reports
- Opinion Leaders
Secondary Research
- Annual Reports
- White Paper
- Latest Press Release
- Industry Association
- Paid Database
- Investor Presentations

Step 4 - Data Triangulation
Involves using different sources of information in order to increase the validity of a study
These sources are likely to be stakeholders in a program - participants, other researchers, program staff, other community members, and so on.
Then we put all data in single framework & apply various statistical tools to find out the dynamic on the market.
During the analysis stage, feedback from the stakeholder groups would be compared to determine areas of agreement as well as areas of divergence