

Key Insights for Virtual Assistant Services Market
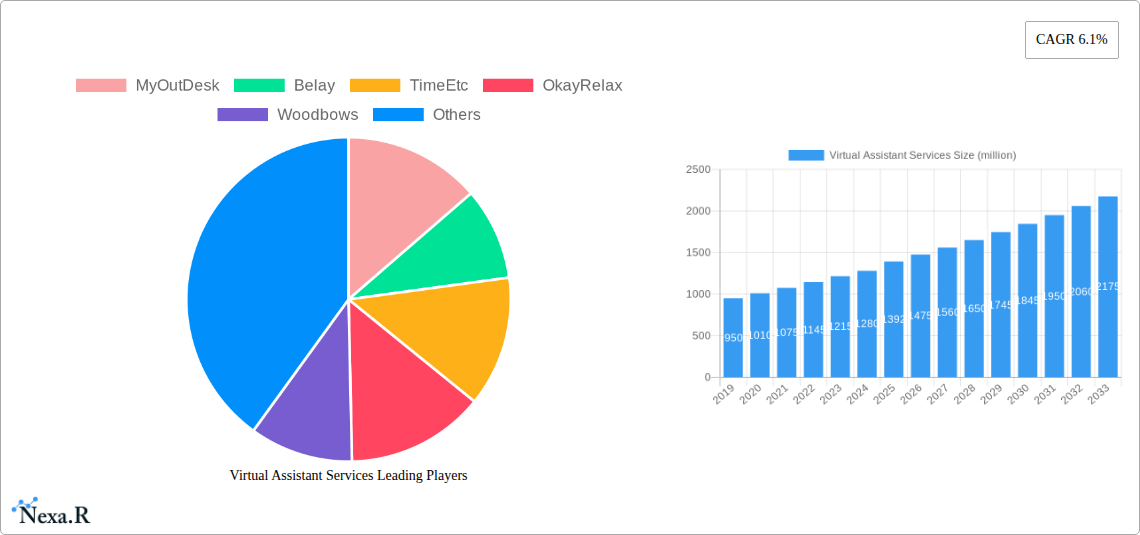
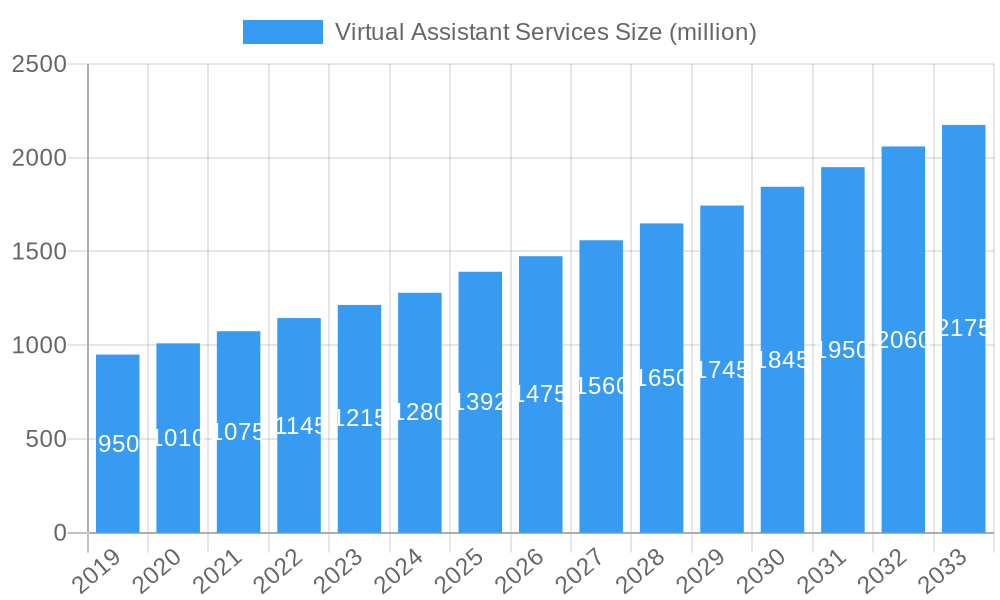
The Virtual Assistant Services Market is undergoing a significant transformation, driven by an accelerating shift towards remote work models, digital transformation initiatives, and the pervasive need for operational efficiencies across diverse industry verticals. Valued at an estimated $1392 million in 2026, the market is poised for robust expansion, projecting a compound annual growth rate (CAGR) of 6.1% through 2034. This consistent growth trajectory is anticipated to propel the market valuation to approximately $2244.6 million by the end of the forecast period.
Virtual Assistant Services Market Size (In Billion)
Key demand drivers are multifaceted, encompassing the increasing demand for flexible staffing solutions, the globalization of the workforce, and the strategic imperative for businesses to focus on core competencies. The rise of the Small and Medium Business Market (SMBs) as primary adopters seeking cost-effective administrative and specialized support, alongside large enterprises leveraging virtual assistants for scalable solutions, underpins much of this demand. Technological advancements, particularly in natural language processing and machine learning, are enhancing the capabilities and scope of services offered by virtual assistants, expanding their utility beyond traditional administrative tasks to complex data analysis, marketing, and specialized technical support.
Virtual Assistant Services Company Market Share
Macro tailwinds include the widespread acceptance of remote collaboration tools, which has normalized distributed teams and facilitated seamless integration of virtual assistant services into existing workflows. Furthermore, the imperative for cost optimization in competitive economic landscapes continues to drive enterprises to explore alternatives to traditional in-house staffing. The increasing sophistication of virtual assistant platforms, often delivered as a service leveraging the Cloud Computing Services Market, ensures scalability, security, and accessibility for a global clientele. The market’s forward-looking outlook suggests a continued emphasis on niche specialization, with providers offering tailored solutions for specific industries or functions. Integration with advanced AI technologies will further automate routine tasks, allowing human virtual assistants to focus on higher-value strategic contributions and complex problem-solving. This evolution ensures the Virtual Assistant Services Market remains a critical enabler of business agility and efficiency in the digital age.
End-User Dominance in Virtual Assistant Services Market
Within the Virtual Assistant Services Market, end-user segmentation reveals a significant revenue share attributed to businesses, with the Small and Medium Business Market (SMBs) and Large Enterprises collectively forming the dominant force. SMBs, in particular, represent a critical segment driving market expansion. These businesses often operate with lean teams and limited in-house resources, making virtual assistants an attractive and cost-effective solution for managing administrative overhead, customer inquiries, marketing efforts, and specialized tasks that would otherwise require dedicated full-time hires. The flexibility offered by virtual assistant services—ranging from hourly engagements to retainer-based packages—aligns perfectly with the fluctuating operational needs and budget constraints characteristic of SMBs. This segment primarily leverages virtual assistants for tasks such as scheduling, email management, social media moderation, data entry, and basic Technical Support Services Market functions, allowing internal staff to concentrate on core revenue-generating activities. Companies like MyTasker and Fancy Hands cater extensively to this segment, offering scalable and accessible virtual support.
Large Enterprises, while possessing more robust internal structures, also contribute substantially to the Virtual Assistant Services Market. Their demand is often driven by the need for specialized skills, the ability to scale operations rapidly, and the strategic outsourcing of non-core functions to achieve greater efficiency and cost savings. Virtual assistants in large enterprises might handle more complex tasks, including project management support, market research, content creation, and highly specialized finance or legal administrative functions. The adoption of virtual assistants by large corporations is often part of a broader Business Process Outsourcing Market strategy, seeking to leverage global talent pools and optimized service delivery models. The burgeoning requirement for enhanced Customer Experience Management Market solutions has also led large organizations to integrate virtual assistants into their front-line and back-office customer support operations, often via omnichannel platforms that blend text-based and voice-based interactions. The continued emphasis on digital transformation initiatives across the Enterprise Solutions Market further solidifies the position of large businesses as key consumers, as virtual assistants play an integral role in managing digital workflows and data.
While individuals and government entities also engage virtual assistant services, their combined revenue share is comparatively smaller than that of businesses. Individuals typically seek assistance for personal tasks, scheduling, and basic digital organization. Government and public sectors may utilize virtual assistants for administrative support during peak workloads or for specialized project-based assistance, but often face more stringent procurement processes and data security requirements. The trend within the business-focused segments points towards continued growth, with an increasing consolidation of service offerings as providers aim to deliver comprehensive, integrated solutions that address diverse business needs, from basic administrative support to complex, specialized tasks, further cementing the dominance of SMBs and large enterprises in driving the Virtual Assistant Services Market.
Key Market Drivers Fueling Virtual Assistant Services Market Expansion
The Virtual Assistant Services Market is experiencing significant propulsion from several interconnected drivers, each contributing to its sustained growth. A primary catalyst is the accelerating global adoption of remote work models. The post-pandemic landscape has solidified remote and hybrid work as a standard operational paradigm for countless organizations. This structural shift necessitates robust support systems for geographically dispersed teams, ranging from administrative coordination to technical troubleshooting. Virtual assistants seamlessly fill this void, providing crucial operational continuity without requiring physical presence, directly addressing the logistical challenges of a distributed workforce.
Another significant driver is the pervasive imperative for digital transformation. As businesses increasingly digitize their operations and embrace cloud-based tools, the demand for proficient digital support grows concurrently. Virtual assistants are integral to managing digital workflows, maintaining online presence, handling digital data, and navigating complex software ecosystems. This demand is further amplified by the growth in the Digital Transformation Services Market, where virtual assistants offer scalable support for implementing and managing new digital solutions. The reliance on virtual platforms also underscores the vital role of the Cloud Computing Services Market in enabling the seamless delivery and scalability of these services.
Cost optimization and efficiency gains remain a perennial driver, particularly for the Small and Medium Business Market. Organizations are consistently seeking ways to reduce overheads associated with full-time employment, including benefits, office space, and recruitment costs, while simultaneously boosting productivity. Virtual assistants offer a flexible, on-demand alternative, allowing businesses to access specialized skills only when needed, converting fixed costs into variable operational expenses. This strategic financial advantage is a powerful incentive for adoption across various sectors.
Furthermore, the access to specialized skills without geographical limitations is a critical factor. Virtual assistant services provide immediate access to a global talent pool, offering expertise in areas like advanced data analytics, specific software proficiencies, multi-lingual support, or niche marketing strategies that might be difficult or expensive to source locally. This expanded access to human capital, often managed through platforms within the Human Capital Management Software Market, allows businesses to remain agile and competitive. Finally, the rapid advancements in Artificial Intelligence Services Market are revolutionizing virtual assistance. The integration of AI and machine learning enhances virtual assistants' capabilities, moving beyond rudimentary task execution to include sophisticated data analysis, predictive scheduling, and highly personalized customer interactions. These technological enhancements are not only improving efficiency but also broadening the scope and value proposition of virtual assistant services.
Competitive Ecosystem of Virtual Assistant Services Market
The Virtual Assistant Services Market is characterized by a fragmented yet evolving competitive landscape, comprising numerous specialized agencies, independent contractors, and technology-driven platforms. Key players are continually innovating to offer niche services, enhance platform capabilities, and broaden their geographic reach.
- Virtalent: This company specializes in connecting UK businesses with highly skilled virtual assistants, focusing on quality matching and long-term client relationships to provide comprehensive administrative, marketing, and executive support.
- MyTasker: An India-based virtual assistant service provider, MyTasker offers a broad spectrum of services from administrative and accounting to web development and digital marketing, catering to a global clientele with a cost-effective model.
- MyOutDesk: Specializing in virtual assistant solutions for the real estate and mortgage industries, MyOutDesk provides dedicated VAs to help professionals scale their businesses by handling administrative, marketing, and client-facing tasks.
- Belay Solutions: Belay offers premium virtual assistant, bookkeeping, and web support services, emphasizing a meticulous client-matching process and a focus on US-based talent to deliver high-quality, dependable support to businesses.
- Okay Relax: This provider focuses on simplifying personal and professional lives by offering a wide range of virtual assistant services, from scheduling and research to travel arrangements, aiming to alleviate daily task burdens.
- WoodBows: WoodBows provides dedicated virtual assistants for various business needs, including administrative, marketing, and technical support, leveraging a global talent pool to offer flexible and scalable solutions.
- Prialto: Prialto offers executive virtual assistant services, helping busy executives and teams streamline their workflows, manage schedules, and enhance productivity through proactive and skilled administrative support.
- Fancy Hands: Known for its task-based virtual assistant service, Fancy Hands allows users to submit individual requests for a wide array of personal and business tasks, operating on a subscription model for convenience.
- Time Etc: This service connects clients with experienced virtual assistants who can handle a diverse range of tasks, from administrative support to marketing and copywriting, emphasizing expertise and reliability.
- Magic: Magic offers on-demand virtual assistant services for both personal and business needs, leveraging a combination of human intelligence and AI tools to fulfill complex requests efficiently.
- Upwork: As a leading freelancing platform, Upwork enables businesses to find and hire independent virtual assistants globally, providing a marketplace model that offers flexibility and access to a vast talent pool.
- Zirtual: Zirtual provides US-based virtual assistants, focusing on delivering high-quality, dedicated support for executives, entrepreneurs, and teams across various industries, emphasizing reliability and professional communication.
Recent Developments & Milestones in Virtual Assistant Services Market
The Virtual Assistant Services Market has witnessed a flurry of activities reflecting its dynamic growth and increasing integration with advanced technologies. These developments underscore a trend towards specialization, enhanced technological capabilities, and strategic partnerships.
- January 2024: Several prominent virtual assistant platforms announced enhanced AI integration, leveraging large language models (LLMs) to automate routine inquiries and improve the efficiency of text-based virtual assistants. This move aims to free up human assistants for more complex, higher-value tasks, contributing to the growth of the Artificial Intelligence Services Market.
- March 2024: A major US-based virtual assistant provider launched a specialized service package tailored for the Small and Medium Business Market, offering tiered subscription models that bundle administrative, marketing, and customer support services, making professional assistance more accessible to smaller enterprises.
- May 2024: A leading European virtual assistant agency announced a strategic partnership with a Human Capital Management Software Market vendor. This collaboration aims to provide clients with integrated solutions for managing their virtual teams, including advanced time tracking, performance monitoring, and compliance management features.
- July 2024: Following increased concerns over data privacy, several virtual assistant service providers introduced new end-to-end encryption protocols for client communications and data storage. This development reflects a growing emphasis on security and compliance within the Data Center Services Market and service delivery frameworks.
- September 2024: A Canadian virtual assistant firm expanded its offerings to include dedicated Technical Support Services Market, catering to the growing demand from tech startups and e-commerce businesses for specialized IT and troubleshooting assistance delivered remotely.
- November 2024: In response to the growing global distributed workforce, an Asia-Pacific virtual assistant company launched new Omnichannel/Multichannel support capabilities, allowing seamless client interaction across email, chat, and voice platforms, thereby enhancing Customer Experience Management Market efforts for their clients.
Regional Market Breakdown for Virtual Assistant Services Market
The Virtual Assistant Services Market exhibits distinct regional dynamics, influenced by varying levels of digital adoption, labor costs, and business process outsourcing maturity. Analyzing key regions provides insight into demand drivers and growth trajectories.
North America holds the largest revenue share in the Virtual Assistant Services Market. This dominance is primarily attributable to a mature digital infrastructure, high adoption rates of remote work technologies, and relatively high labor costs that incentivize outsourcing administrative and specialized tasks. The presence of a vast Small and Medium Business Market and numerous large enterprises, particularly in the United States and Canada, drives consistent demand for virtual administrative, marketing, and Technical Support Services Market. Innovation in Artificial Intelligence Services Market and Cloud Computing Services Market also originates significantly from this region, further enhancing the capabilities and scope of virtual assistant offerings. The region's focus on efficiency and scalability underpins its leading position.
Europe represents a substantial segment of the market, with strong growth driven by increasing digitalization across diverse economies like the UK, Germany, and France. European businesses are increasingly leveraging virtual assistants for language-specific support, specialized consulting, and compliance-related administrative tasks. The intricate regulatory landscape, particularly concerning data privacy (e.g., GDPR), necessitates that providers operating in this region offer robust security and compliance frameworks. The demand here is often for highly skilled, professional virtual assistants who can integrate seamlessly into complex business environments.
Asia Pacific is poised to be the fastest-growing region in the Virtual Assistant Services Market during the forecast period. This accelerated growth is fueled by rapid digital transformation initiatives in emerging economies like India, China, and Southeast Asian nations. A large, skilled, and cost-effective talent pool, combined with increasing internet penetration and smartphone adoption, makes the region both a significant provider and consumer of virtual assistant services. Businesses in the region are recognizing the efficiency and scalability benefits, driving demand across the Enterprise Solutions Market and SMBs. The rise of outsourcing hubs also strengthens this region's position.
Middle East & Africa and South America are emerging markets for virtual assistant services, albeit with smaller current revenue shares. Digital transformation efforts, diversification away from traditional industries, and the growing need for cost-efficient business solutions are stimulating demand in these regions. While challenges such as nascent digital infrastructure and varying regulatory frameworks exist, the increasing proliferation of remote work tools and the global nature of virtual assistance services suggest significant growth potential in the coming years. Demand in these regions is often driven by startups and small businesses seeking to expand their operational capacity without the overhead of traditional hires.
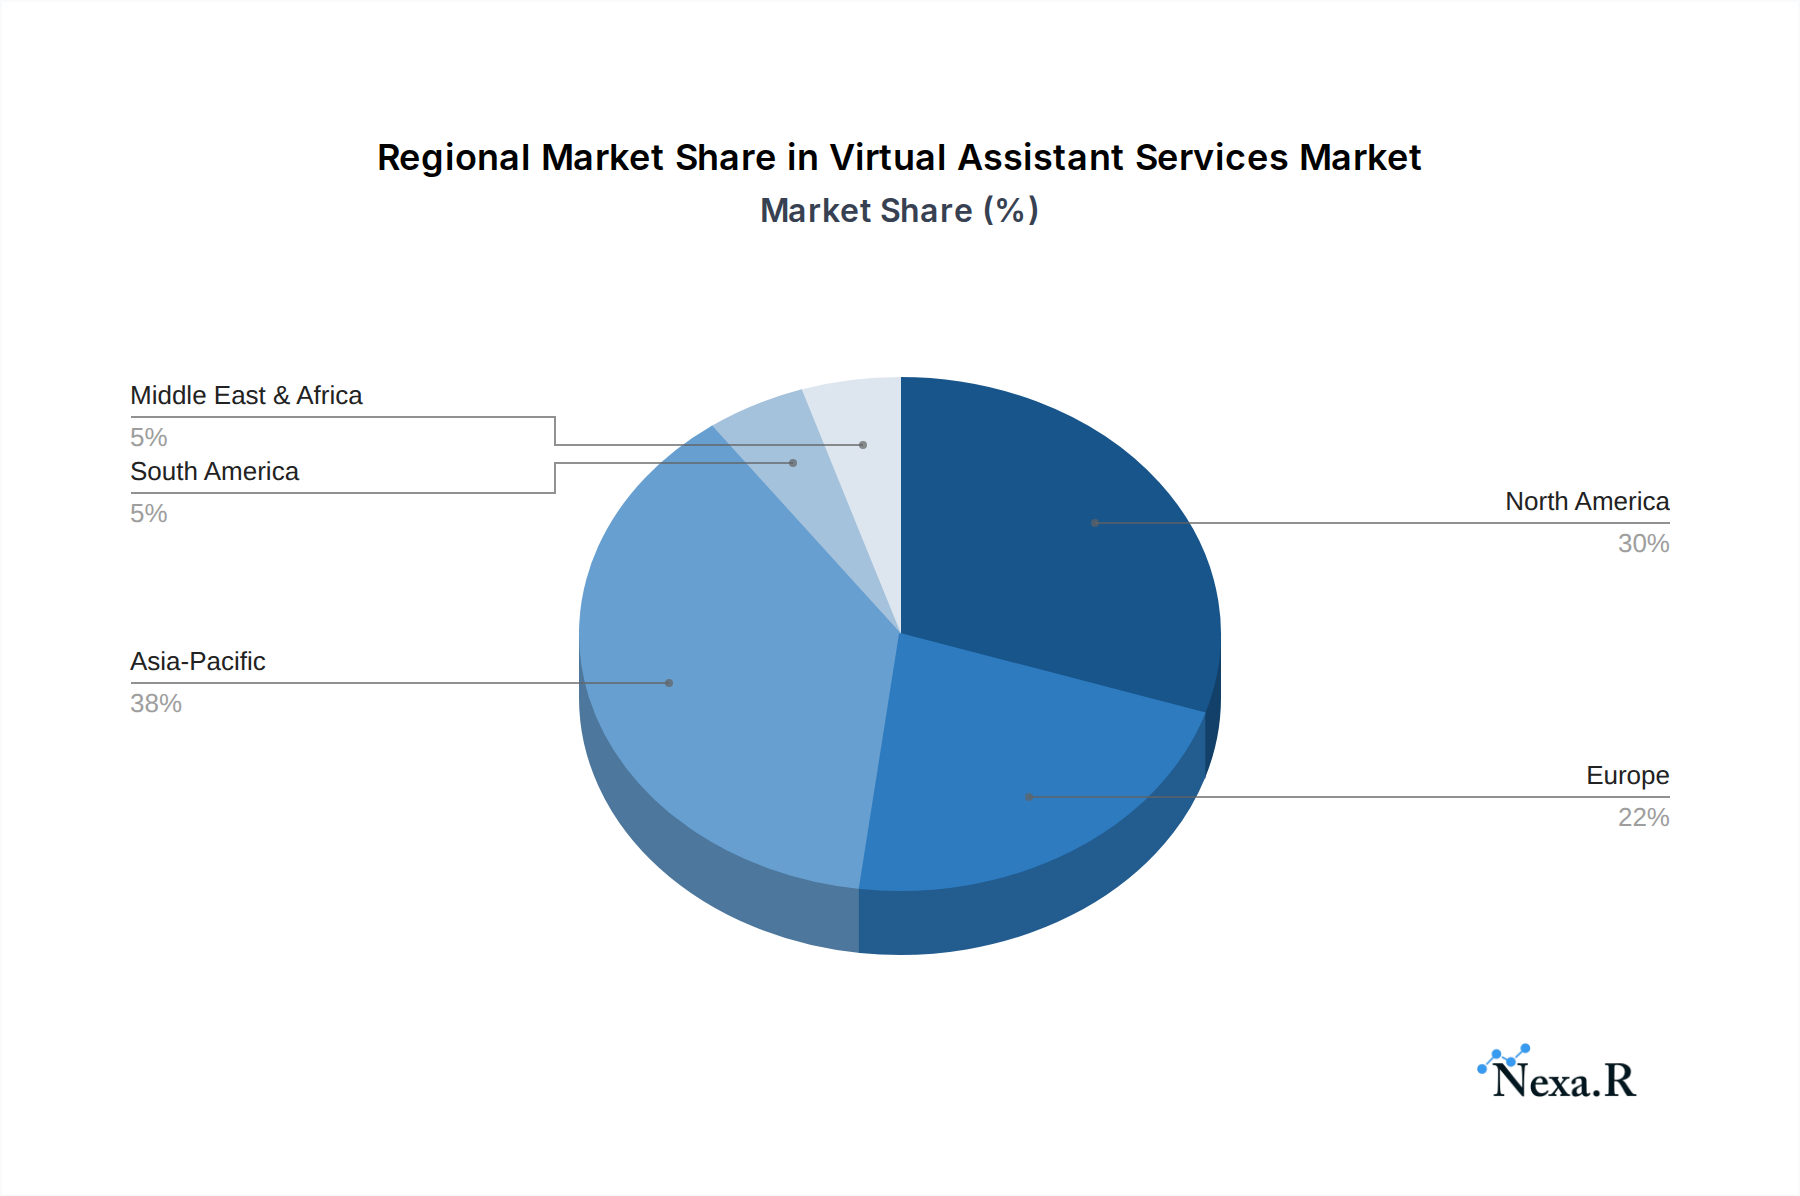
Virtual Assistant Services Regional Market Share
Supply Chain & Raw Material Dynamics for Virtual Assistant Services Market
For a service-oriented sector like the Virtual Assistant Services Market, the concept of "raw materials" translates primarily into intellectual capital, technology infrastructure, and enabling services. The upstream dependencies are multi-layered. The most critical input is human talent: a skilled workforce possessing diverse capabilities such as administrative proficiency, technical aptitude, digital marketing expertise, and Customer Experience Management Market skills. Sourcing risks include talent scarcity in specialized niches, wage inflation, and geographical limitations on available expertise. The global nature of the Virtual Assistant Services Market mitigates some of these risks by allowing access to a wider pool, but competition for top talent remains intense. Labor costs represent a primary component of service pricing, and their volatility, driven by economic conditions, inflation, and demand, directly impacts the profitability and pricing strategies of virtual assistant providers.
Beyond human capital, technology platforms constitute essential components. This includes licenses for productivity software (e.g., Microsoft 365, Google Workspace), project management tools (e.g., Asana, Trello), communication platforms (e.g., Zoom, Slack), and specialized industry software. The availability and pricing of these software-as-a-service (SaaS) solutions, often underpinned by the Cloud Computing Services Market, directly influence operational costs. Further upstream, the Data Center Services Market and network infrastructure provide the backbone for storing client data, hosting applications, and ensuring seamless connectivity for remote operations. Any disruptions in these foundational services, such as internet outages or data center failures, can severely impact service delivery and client satisfaction.
Another critical input is cybersecurity infrastructure and tools. Given the sensitive nature of client data handled by virtual assistants, robust security software, encryption technologies, and compliance tools are indispensable. Price trends for these components tend to be stable or incrementally increasing as security threats evolve. Supply chain disruptions can manifest as skill gaps among available talent, increased subscription costs for essential software, or outages in cloud and network services, directly impacting service quality and operational continuity. The reliance on the Human Capital Management Software Market for recruiting, onboarding, and managing virtual teams also highlights an important upstream dependency, with features like performance tracking and payroll integration being vital.
Regulatory & Policy Landscape Shaping Virtual Assistant Services Market
The Virtual Assistant Services Market operates within a complex and evolving regulatory and policy landscape, which varies significantly across different geographies and profoundly impacts service delivery, data handling, and labor practices. One of the most critical areas is data privacy and protection. Regulations such as the General Data Protection Regulation (GDPR) in Europe, the California Consumer Privacy Act (CCPA) in the United States, and similar frameworks globally (e.g., Brazil's LGPD, India's DPDP Bill) dictate how virtual assistant providers must collect, process, store, and transfer personal and sensitive client data. Non-compliance can lead to substantial fines and reputational damage. These policies necessitate robust cybersecurity measures, transparent data handling practices, and strict adherence to data residency requirements, especially for services leveraging the Data Center Services Market across borders.
Labor laws and classification of workers present another significant regulatory challenge. The classification of virtual assistants as independent contractors versus employees has wide-ranging implications for minimum wage, benefits, worker protections, and tax obligations. Jurisdictions like California (with AB5) have attempted to reclassify gig workers, directly impacting the operational models of many virtual assistant agencies and platforms, particularly those resembling a Business Process Outsourcing Market structure. These policy discussions are ongoing globally and could necessitate changes in how virtual assistants are hired, managed through Human Capital Management Software Market solutions, and compensated, potentially increasing operational costs for providers.
Cross-border data transfer regulations are particularly relevant for a market that inherently leverages a global workforce. Rules governing the transfer of personal data outside its country of origin, such as standard contractual clauses (SCCs) and adequacy decisions under GDPR, directly impact where virtual assistants can be located and how client data is accessed and processed globally. Any changes to these international transfer mechanisms can create significant operational hurdles. Furthermore, sector-specific regulations, such as HIPAA for healthcare data or FINRA rules for financial services, impose additional compliance burdens on virtual assistants operating in these specialized areas. Recent policy shifts generally indicate a global trend towards greater data protection, increased scrutiny of gig economy worker rights, and efforts to regulate artificial intelligence. These changes are projected to drive up compliance costs, necessitate greater investment in secure technologies, and potentially reshape service delivery models within the Virtual Assistant Services Market, pushing providers towards greater transparency and accountability.
Virtual Assistant Services Segmentation
-
1. Type
- 1.1. Administrative Virtual Assistant
- 1.2. Customer Facing Virtual Assistant
- 1.3. Creative/Design Virtual Assistant
- 1.4. Technical Virtual Assistant
- 1.5. Finance/Accounting Virtual Assistant
-
2. Channel
- 2.1. Text-based
- 2.2. Voice-based
- 2.3. Omnichannel/Multichannel
-
3. Pricing
- 3.1. Hourly/Task-Based
- 3.2. Retainer / Package-based
- 3.3. Subscription-based
-
4. End User
- 4.1. Individuals
- 4.2. SMBs
- 4.3. Large Enterprises
- 4.4. Government and Public
Virtual Assistant Services Segmentation By Geography
-
1. North America
- 1.1. United States
- 1.2. Canada
- 1.3. Mexico
-
2. South America
- 2.1. Brazil
- 2.2. Argentina
- 2.3. Rest of South America
-
3. Europe
- 3.1. United Kingdom
- 3.2. Germany
- 3.3. France
- 3.4. Italy
- 3.5. Spain
- 3.6. Russia
- 3.7. Benelux
- 3.8. Nordics
- 3.9. Rest of Europe
-
4. Middle East & Africa
- 4.1. Turkey
- 4.2. Israel
- 4.3. GCC
- 4.4. North Africa
- 4.5. South Africa
- 4.6. Rest of Middle East & Africa
-
5. Asia Pacific
- 5.1. China
- 5.2. India
- 5.3. Japan
- 5.4. South Korea
- 5.5. ASEAN
- 5.6. Oceania
- 5.7. Rest of Asia Pacific
Virtual Assistant Services Regional Market Share
Geographic Coverage of Virtual Assistant Services
Virtual Assistant Services REPORT HIGHLIGHTS
| Aspects | Details |
|---|---|
| Study Period | 2020-2034 |
| Base Year | 2025 |
| Estimated Year | 2026 |
| Forecast Period | 2026-2034 |
| Historical Period | 2020-2025 |
| Growth Rate | CAGR of 6.1% from 2020-2034 |
| Segmentation |
|
Table of Contents
- 1. Introduction
- 1.1. Research Scope
- 1.2. Market Segmentation
- 1.3. Research Objective
- 1.4. Definitions and Assumptions
- 2. Executive Summary
- 2.1. Market Snapshot
- 3. Market Dynamics
- 3.1. Market Drivers
- 3.2. Market Restrains
- 3.3. Market Trends
- 3.4. Market Opportunities
- 4. Market Factor Analysis
- 4.1. Porters Five Forces
- 4.1.1. Bargaining Power of Suppliers
- 4.1.2. Bargaining Power of Buyers
- 4.1.3. Threat of New Entrants
- 4.1.4. Threat of Substitutes
- 4.1.5. Competitive Rivalry
- 4.2. PESTEL analysis
- 4.3. BCG Analysis
- 4.3.1. Stars (High Growth, High Market Share)
- 4.3.2. Cash Cows (Low Growth, High Market Share)
- 4.3.3. Question Mark (High Growth, Low Market Share)
- 4.3.4. Dogs (Low Growth, Low Market Share)
- 4.4. Ansoff Matrix Analysis
- 4.5. Supply Chain Analysis
- 4.6. Regulatory Landscape
- 4.7. Current Market Potential and Opportunity Assessment (TAM–SAM–SOM Framework)
- 4.8. NRP Analyst Note
- 4.1. Porters Five Forces
- 5. Market Analysis, Insights and Forecast 2021-2033
- 5.1. Market Analysis, Insights and Forecast - by Type
- 5.1.1. Administrative Virtual Assistant
- 5.1.2. Customer Facing Virtual Assistant
- 5.1.3. Creative/Design Virtual Assistant
- 5.1.4. Technical Virtual Assistant
- 5.1.5. Finance/Accounting Virtual Assistant
- 5.2. Market Analysis, Insights and Forecast - by Channel
- 5.2.1. Text-based
- 5.2.2. Voice-based
- 5.2.3. Omnichannel/Multichannel
- 5.3. Market Analysis, Insights and Forecast - by Pricing
- 5.3.1. Hourly/Task-Based
- 5.3.2. Retainer / Package-based
- 5.3.3. Subscription-based
- 5.4. Market Analysis, Insights and Forecast - by End User
- 5.4.1. Individuals
- 5.4.2. SMBs
- 5.4.3. Large Enterprises
- 5.4.4. Government and Public
- 5.5. Market Analysis, Insights and Forecast - by Region
- 5.5.1. North America
- 5.5.2. South America
- 5.5.3. Europe
- 5.5.4. Middle East & Africa
- 5.5.5. Asia Pacific
- 5.1. Market Analysis, Insights and Forecast - by Type
- 6. Global Virtual Assistant Services Analysis, Insights and Forecast, 2021-2033
- 6.1. Market Analysis, Insights and Forecast - by Type
- 6.1.1. Administrative Virtual Assistant
- 6.1.2. Customer Facing Virtual Assistant
- 6.1.3. Creative/Design Virtual Assistant
- 6.1.4. Technical Virtual Assistant
- 6.1.5. Finance/Accounting Virtual Assistant
- 6.2. Market Analysis, Insights and Forecast - by Channel
- 6.2.1. Text-based
- 6.2.2. Voice-based
- 6.2.3. Omnichannel/Multichannel
- 6.3. Market Analysis, Insights and Forecast - by Pricing
- 6.3.1. Hourly/Task-Based
- 6.3.2. Retainer / Package-based
- 6.3.3. Subscription-based
- 6.4. Market Analysis, Insights and Forecast - by End User
- 6.4.1. Individuals
- 6.4.2. SMBs
- 6.4.3. Large Enterprises
- 6.4.4. Government and Public
- 6.1. Market Analysis, Insights and Forecast - by Type
- 7. North America Virtual Assistant Services Analysis, Insights and Forecast, 2020-2032
- 7.1. Market Analysis, Insights and Forecast - by Type
- 7.1.1. Administrative Virtual Assistant
- 7.1.2. Customer Facing Virtual Assistant
- 7.1.3. Creative/Design Virtual Assistant
- 7.1.4. Technical Virtual Assistant
- 7.1.5. Finance/Accounting Virtual Assistant
- 7.2. Market Analysis, Insights and Forecast - by Channel
- 7.2.1. Text-based
- 7.2.2. Voice-based
- 7.2.3. Omnichannel/Multichannel
- 7.3. Market Analysis, Insights and Forecast - by Pricing
- 7.3.1. Hourly/Task-Based
- 7.3.2. Retainer / Package-based
- 7.3.3. Subscription-based
- 7.4. Market Analysis, Insights and Forecast - by End User
- 7.4.1. Individuals
- 7.4.2. SMBs
- 7.4.3. Large Enterprises
- 7.4.4. Government and Public
- 7.1. Market Analysis, Insights and Forecast - by Type
- 8. South America Virtual Assistant Services Analysis, Insights and Forecast, 2020-2032
- 8.1. Market Analysis, Insights and Forecast - by Type
- 8.1.1. Administrative Virtual Assistant
- 8.1.2. Customer Facing Virtual Assistant
- 8.1.3. Creative/Design Virtual Assistant
- 8.1.4. Technical Virtual Assistant
- 8.1.5. Finance/Accounting Virtual Assistant
- 8.2. Market Analysis, Insights and Forecast - by Channel
- 8.2.1. Text-based
- 8.2.2. Voice-based
- 8.2.3. Omnichannel/Multichannel
- 8.3. Market Analysis, Insights and Forecast - by Pricing
- 8.3.1. Hourly/Task-Based
- 8.3.2. Retainer / Package-based
- 8.3.3. Subscription-based
- 8.4. Market Analysis, Insights and Forecast - by End User
- 8.4.1. Individuals
- 8.4.2. SMBs
- 8.4.3. Large Enterprises
- 8.4.4. Government and Public
- 8.1. Market Analysis, Insights and Forecast - by Type
- 9. Europe Virtual Assistant Services Analysis, Insights and Forecast, 2020-2032
- 9.1. Market Analysis, Insights and Forecast - by Type
- 9.1.1. Administrative Virtual Assistant
- 9.1.2. Customer Facing Virtual Assistant
- 9.1.3. Creative/Design Virtual Assistant
- 9.1.4. Technical Virtual Assistant
- 9.1.5. Finance/Accounting Virtual Assistant
- 9.2. Market Analysis, Insights and Forecast - by Channel
- 9.2.1. Text-based
- 9.2.2. Voice-based
- 9.2.3. Omnichannel/Multichannel
- 9.3. Market Analysis, Insights and Forecast - by Pricing
- 9.3.1. Hourly/Task-Based
- 9.3.2. Retainer / Package-based
- 9.3.3. Subscription-based
- 9.4. Market Analysis, Insights and Forecast - by End User
- 9.4.1. Individuals
- 9.4.2. SMBs
- 9.4.3. Large Enterprises
- 9.4.4. Government and Public
- 9.1. Market Analysis, Insights and Forecast - by Type
- 10. Middle East & Africa Virtual Assistant Services Analysis, Insights and Forecast, 2020-2032
- 10.1. Market Analysis, Insights and Forecast - by Type
- 10.1.1. Administrative Virtual Assistant
- 10.1.2. Customer Facing Virtual Assistant
- 10.1.3. Creative/Design Virtual Assistant
- 10.1.4. Technical Virtual Assistant
- 10.1.5. Finance/Accounting Virtual Assistant
- 10.2. Market Analysis, Insights and Forecast - by Channel
- 10.2.1. Text-based
- 10.2.2. Voice-based
- 10.2.3. Omnichannel/Multichannel
- 10.3. Market Analysis, Insights and Forecast - by Pricing
- 10.3.1. Hourly/Task-Based
- 10.3.2. Retainer / Package-based
- 10.3.3. Subscription-based
- 10.4. Market Analysis, Insights and Forecast - by End User
- 10.4.1. Individuals
- 10.4.2. SMBs
- 10.4.3. Large Enterprises
- 10.4.4. Government and Public
- 10.1. Market Analysis, Insights and Forecast - by Type
- 11. Asia Pacific Virtual Assistant Services Analysis, Insights and Forecast, 2020-2032
- 11.1. Market Analysis, Insights and Forecast - by Type
- 11.1.1. Administrative Virtual Assistant
- 11.1.2. Customer Facing Virtual Assistant
- 11.1.3. Creative/Design Virtual Assistant
- 11.1.4. Technical Virtual Assistant
- 11.1.5. Finance/Accounting Virtual Assistant
- 11.2. Market Analysis, Insights and Forecast - by Channel
- 11.2.1. Text-based
- 11.2.2. Voice-based
- 11.2.3. Omnichannel/Multichannel
- 11.3. Market Analysis, Insights and Forecast - by Pricing
- 11.3.1. Hourly/Task-Based
- 11.3.2. Retainer / Package-based
- 11.3.3. Subscription-based
- 11.4. Market Analysis, Insights and Forecast - by End User
- 11.4.1. Individuals
- 11.4.2. SMBs
- 11.4.3. Large Enterprises
- 11.4.4. Government and Public
- 11.1. Market Analysis, Insights and Forecast - by Type
- 12. Competitive Analysis
- 12.1. Company Profiles
- 12.1.1 Virtalent
- 12.1.1.1. Company Overview
- 12.1.1.2. Products
- 12.1.1.3. Company Financials
- 12.1.1.4. SWOT Analysis
- 12.1.2 MyTasker
- 12.1.2.1. Company Overview
- 12.1.2.2. Products
- 12.1.2.3. Company Financials
- 12.1.2.4. SWOT Analysis
- 12.1.3 MyOutDesk
- 12.1.3.1. Company Overview
- 12.1.3.2. Products
- 12.1.3.3. Company Financials
- 12.1.3.4. SWOT Analysis
- 12.1.4 Belay Solutions
- 12.1.4.1. Company Overview
- 12.1.4.2. Products
- 12.1.4.3. Company Financials
- 12.1.4.4. SWOT Analysis
- 12.1.5 Okay Relax
- 12.1.5.1. Company Overview
- 12.1.5.2. Products
- 12.1.5.3. Company Financials
- 12.1.5.4. SWOT Analysis
- 12.1.6 WoodBows
- 12.1.6.1. Company Overview
- 12.1.6.2. Products
- 12.1.6.3. Company Financials
- 12.1.6.4. SWOT Analysis
- 12.1.7 Prialto
- 12.1.7.1. Company Overview
- 12.1.7.2. Products
- 12.1.7.3. Company Financials
- 12.1.7.4. SWOT Analysis
- 12.1.8 Fancy Hands
- 12.1.8.1. Company Overview
- 12.1.8.2. Products
- 12.1.8.3. Company Financials
- 12.1.8.4. SWOT Analysis
- 12.1.9 Time Etc
- 12.1.9.1. Company Overview
- 12.1.9.2. Products
- 12.1.9.3. Company Financials
- 12.1.9.4. SWOT Analysis
- 12.1.10 Magic
- 12.1.10.1. Company Overview
- 12.1.10.2. Products
- 12.1.10.3. Company Financials
- 12.1.10.4. SWOT Analysis
- 12.1.11 Upwork
- 12.1.11.1. Company Overview
- 12.1.11.2. Products
- 12.1.11.3. Company Financials
- 12.1.11.4. SWOT Analysis
- 12.1.12 Uassist.ME
- 12.1.12.1. Company Overview
- 12.1.12.2. Products
- 12.1.12.3. Company Financials
- 12.1.12.4. SWOT Analysis
- 12.1.13 Virtual Assistant Canada
- 12.1.13.1. Company Overview
- 12.1.13.2. Products
- 12.1.13.3. Company Financials
- 12.1.13.4. SWOT Analysis
- 12.1.14 Virtual Gurus
- 12.1.14.1. Company Overview
- 12.1.14.2. Products
- 12.1.14.3. Company Financials
- 12.1.14.4. SWOT Analysis
- 12.1.15 Pepper Virtual Assistant Services
- 12.1.15.1. Company Overview
- 12.1.15.2. Products
- 12.1.15.3. Company Financials
- 12.1.15.4. SWOT Analysis
- 12.1.16 CIBC
- 12.1.16.1. Company Overview
- 12.1.16.2. Products
- 12.1.16.3. Company Financials
- 12.1.16.4. SWOT Analysis
- 12.1.17 Valenta
- 12.1.17.1. Company Overview
- 12.1.17.2. Products
- 12.1.17.3. Company Financials
- 12.1.17.4. SWOT Analysis
- 12.1.18 Zirtual
- 12.1.18.1. Company Overview
- 12.1.18.2. Products
- 12.1.18.3. Company Financials
- 12.1.18.4. SWOT Analysis
- 12.1.19 Nuance
- 12.1.19.1. Company Overview
- 12.1.19.2. Products
- 12.1.19.3. Company Financials
- 12.1.19.4. SWOT Analysis
- 12.1.20 Fidelity
- 12.1.20.1. Company Overview
- 12.1.20.2. Products
- 12.1.20.3. Company Financials
- 12.1.20.4. SWOT Analysis
- 12.1.21 Others
- 12.1.21.1. Company Overview
- 12.1.21.2. Products
- 12.1.21.3. Company Financials
- 12.1.21.4. SWOT Analysis
- 12.1.1 Virtalent
- 12.2. Market Entropy
- 12.2.1 Company's Key Areas Served
- 12.2.2 Recent Developments
- 12.3. Company Market Share Analysis 2025
- 12.3.1 Top 5 Companies Market Share Analysis
- 12.3.2 Top 3 Companies Market Share Analysis
- 12.4. List of Potential Customers
- 13. Research Methodology
List of Figures
- Figure 1: Global Virtual Assistant Services Revenue Breakdown (million, %) by Region 2025 & 2033
- Figure 2: North America Virtual Assistant Services Revenue (million), by Type 2025 & 2033
- Figure 3: North America Virtual Assistant Services Revenue Share (%), by Type 2025 & 2033
- Figure 4: North America Virtual Assistant Services Revenue (million), by Channel 2025 & 2033
- Figure 5: North America Virtual Assistant Services Revenue Share (%), by Channel 2025 & 2033
- Figure 6: North America Virtual Assistant Services Revenue (million), by Pricing 2025 & 2033
- Figure 7: North America Virtual Assistant Services Revenue Share (%), by Pricing 2025 & 2033
- Figure 8: North America Virtual Assistant Services Revenue (million), by End User 2025 & 2033
- Figure 9: North America Virtual Assistant Services Revenue Share (%), by End User 2025 & 2033
- Figure 10: North America Virtual Assistant Services Revenue (million), by Country 2025 & 2033
- Figure 11: North America Virtual Assistant Services Revenue Share (%), by Country 2025 & 2033
- Figure 12: South America Virtual Assistant Services Revenue (million), by Type 2025 & 2033
- Figure 13: South America Virtual Assistant Services Revenue Share (%), by Type 2025 & 2033
- Figure 14: South America Virtual Assistant Services Revenue (million), by Channel 2025 & 2033
- Figure 15: South America Virtual Assistant Services Revenue Share (%), by Channel 2025 & 2033
- Figure 16: South America Virtual Assistant Services Revenue (million), by Pricing 2025 & 2033
- Figure 17: South America Virtual Assistant Services Revenue Share (%), by Pricing 2025 & 2033
- Figure 18: South America Virtual Assistant Services Revenue (million), by End User 2025 & 2033
- Figure 19: South America Virtual Assistant Services Revenue Share (%), by End User 2025 & 2033
- Figure 20: South America Virtual Assistant Services Revenue (million), by Country 2025 & 2033
- Figure 21: South America Virtual Assistant Services Revenue Share (%), by Country 2025 & 2033
- Figure 22: Europe Virtual Assistant Services Revenue (million), by Type 2025 & 2033
- Figure 23: Europe Virtual Assistant Services Revenue Share (%), by Type 2025 & 2033
- Figure 24: Europe Virtual Assistant Services Revenue (million), by Channel 2025 & 2033
- Figure 25: Europe Virtual Assistant Services Revenue Share (%), by Channel 2025 & 2033
- Figure 26: Europe Virtual Assistant Services Revenue (million), by Pricing 2025 & 2033
- Figure 27: Europe Virtual Assistant Services Revenue Share (%), by Pricing 2025 & 2033
- Figure 28: Europe Virtual Assistant Services Revenue (million), by End User 2025 & 2033
- Figure 29: Europe Virtual Assistant Services Revenue Share (%), by End User 2025 & 2033
- Figure 30: Europe Virtual Assistant Services Revenue (million), by Country 2025 & 2033
- Figure 31: Europe Virtual Assistant Services Revenue Share (%), by Country 2025 & 2033
- Figure 32: Middle East & Africa Virtual Assistant Services Revenue (million), by Type 2025 & 2033
- Figure 33: Middle East & Africa Virtual Assistant Services Revenue Share (%), by Type 2025 & 2033
- Figure 34: Middle East & Africa Virtual Assistant Services Revenue (million), by Channel 2025 & 2033
- Figure 35: Middle East & Africa Virtual Assistant Services Revenue Share (%), by Channel 2025 & 2033
- Figure 36: Middle East & Africa Virtual Assistant Services Revenue (million), by Pricing 2025 & 2033
- Figure 37: Middle East & Africa Virtual Assistant Services Revenue Share (%), by Pricing 2025 & 2033
- Figure 38: Middle East & Africa Virtual Assistant Services Revenue (million), by End User 2025 & 2033
- Figure 39: Middle East & Africa Virtual Assistant Services Revenue Share (%), by End User 2025 & 2033
- Figure 40: Middle East & Africa Virtual Assistant Services Revenue (million), by Country 2025 & 2033
- Figure 41: Middle East & Africa Virtual Assistant Services Revenue Share (%), by Country 2025 & 2033
- Figure 42: Asia Pacific Virtual Assistant Services Revenue (million), by Type 2025 & 2033
- Figure 43: Asia Pacific Virtual Assistant Services Revenue Share (%), by Type 2025 & 2033
- Figure 44: Asia Pacific Virtual Assistant Services Revenue (million), by Channel 2025 & 2033
- Figure 45: Asia Pacific Virtual Assistant Services Revenue Share (%), by Channel 2025 & 2033
- Figure 46: Asia Pacific Virtual Assistant Services Revenue (million), by Pricing 2025 & 2033
- Figure 47: Asia Pacific Virtual Assistant Services Revenue Share (%), by Pricing 2025 & 2033
- Figure 48: Asia Pacific Virtual Assistant Services Revenue (million), by End User 2025 & 2033
- Figure 49: Asia Pacific Virtual Assistant Services Revenue Share (%), by End User 2025 & 2033
- Figure 50: Asia Pacific Virtual Assistant Services Revenue (million), by Country 2025 & 2033
- Figure 51: Asia Pacific Virtual Assistant Services Revenue Share (%), by Country 2025 & 2033
List of Tables
- Table 1: Global Virtual Assistant Services Revenue million Forecast, by Type 2020 & 2033
- Table 2: Global Virtual Assistant Services Revenue million Forecast, by Channel 2020 & 2033
- Table 3: Global Virtual Assistant Services Revenue million Forecast, by Pricing 2020 & 2033
- Table 4: Global Virtual Assistant Services Revenue million Forecast, by End User 2020 & 2033
- Table 5: Global Virtual Assistant Services Revenue million Forecast, by Region 2020 & 2033
- Table 6: Global Virtual Assistant Services Revenue million Forecast, by Type 2020 & 2033
- Table 7: Global Virtual Assistant Services Revenue million Forecast, by Channel 2020 & 2033
- Table 8: Global Virtual Assistant Services Revenue million Forecast, by Pricing 2020 & 2033
- Table 9: Global Virtual Assistant Services Revenue million Forecast, by End User 2020 & 2033
- Table 10: Global Virtual Assistant Services Revenue million Forecast, by Country 2020 & 2033
- Table 11: United States Virtual Assistant Services Revenue (million) Forecast, by Application 2020 & 2033
- Table 12: Canada Virtual Assistant Services Revenue (million) Forecast, by Application 2020 & 2033
- Table 13: Mexico Virtual Assistant Services Revenue (million) Forecast, by Application 2020 & 2033
- Table 14: Global Virtual Assistant Services Revenue million Forecast, by Type 2020 & 2033
- Table 15: Global Virtual Assistant Services Revenue million Forecast, by Channel 2020 & 2033
- Table 16: Global Virtual Assistant Services Revenue million Forecast, by Pricing 2020 & 2033
- Table 17: Global Virtual Assistant Services Revenue million Forecast, by End User 2020 & 2033
- Table 18: Global Virtual Assistant Services Revenue million Forecast, by Country 2020 & 2033
- Table 19: Brazil Virtual Assistant Services Revenue (million) Forecast, by Application 2020 & 2033
- Table 20: Argentina Virtual Assistant Services Revenue (million) Forecast, by Application 2020 & 2033
- Table 21: Rest of South America Virtual Assistant Services Revenue (million) Forecast, by Application 2020 & 2033
- Table 22: Global Virtual Assistant Services Revenue million Forecast, by Type 2020 & 2033
- Table 23: Global Virtual Assistant Services Revenue million Forecast, by Channel 2020 & 2033
- Table 24: Global Virtual Assistant Services Revenue million Forecast, by Pricing 2020 & 2033
- Table 25: Global Virtual Assistant Services Revenue million Forecast, by End User 2020 & 2033
- Table 26: Global Virtual Assistant Services Revenue million Forecast, by Country 2020 & 2033
- Table 27: United Kingdom Virtual Assistant Services Revenue (million) Forecast, by Application 2020 & 2033
- Table 28: Germany Virtual Assistant Services Revenue (million) Forecast, by Application 2020 & 2033
- Table 29: France Virtual Assistant Services Revenue (million) Forecast, by Application 2020 & 2033
- Table 30: Italy Virtual Assistant Services Revenue (million) Forecast, by Application 2020 & 2033
- Table 31: Spain Virtual Assistant Services Revenue (million) Forecast, by Application 2020 & 2033
- Table 32: Russia Virtual Assistant Services Revenue (million) Forecast, by Application 2020 & 2033
- Table 33: Benelux Virtual Assistant Services Revenue (million) Forecast, by Application 2020 & 2033
- Table 34: Nordics Virtual Assistant Services Revenue (million) Forecast, by Application 2020 & 2033
- Table 35: Rest of Europe Virtual Assistant Services Revenue (million) Forecast, by Application 2020 & 2033
- Table 36: Global Virtual Assistant Services Revenue million Forecast, by Type 2020 & 2033
- Table 37: Global Virtual Assistant Services Revenue million Forecast, by Channel 2020 & 2033
- Table 38: Global Virtual Assistant Services Revenue million Forecast, by Pricing 2020 & 2033
- Table 39: Global Virtual Assistant Services Revenue million Forecast, by End User 2020 & 2033
- Table 40: Global Virtual Assistant Services Revenue million Forecast, by Country 2020 & 2033
- Table 41: Turkey Virtual Assistant Services Revenue (million) Forecast, by Application 2020 & 2033
- Table 42: Israel Virtual Assistant Services Revenue (million) Forecast, by Application 2020 & 2033
- Table 43: GCC Virtual Assistant Services Revenue (million) Forecast, by Application 2020 & 2033
- Table 44: North Africa Virtual Assistant Services Revenue (million) Forecast, by Application 2020 & 2033
- Table 45: South Africa Virtual Assistant Services Revenue (million) Forecast, by Application 2020 & 2033
- Table 46: Rest of Middle East & Africa Virtual Assistant Services Revenue (million) Forecast, by Application 2020 & 2033
- Table 47: Global Virtual Assistant Services Revenue million Forecast, by Type 2020 & 2033
- Table 48: Global Virtual Assistant Services Revenue million Forecast, by Channel 2020 & 2033
- Table 49: Global Virtual Assistant Services Revenue million Forecast, by Pricing 2020 & 2033
- Table 50: Global Virtual Assistant Services Revenue million Forecast, by End User 2020 & 2033
- Table 51: Global Virtual Assistant Services Revenue million Forecast, by Country 2020 & 2033
- Table 52: China Virtual Assistant Services Revenue (million) Forecast, by Application 2020 & 2033
- Table 53: India Virtual Assistant Services Revenue (million) Forecast, by Application 2020 & 2033
- Table 54: Japan Virtual Assistant Services Revenue (million) Forecast, by Application 2020 & 2033
- Table 55: South Korea Virtual Assistant Services Revenue (million) Forecast, by Application 2020 & 2033
- Table 56: ASEAN Virtual Assistant Services Revenue (million) Forecast, by Application 2020 & 2033
- Table 57: Oceania Virtual Assistant Services Revenue (million) Forecast, by Application 2020 & 2033
- Table 58: Rest of Asia Pacific Virtual Assistant Services Revenue (million) Forecast, by Application 2020 & 2033
Frequently Asked Questions
1. What is the projected Compound Annual Growth Rate (CAGR) of the Virtual Assistant Services?
The projected CAGR is approximately 6.1%.
2. Which companies are prominent players in the Virtual Assistant Services?
Key companies in the market include Virtalent, MyTasker, MyOutDesk, Belay Solutions, Okay Relax, WoodBows, Prialto, Fancy Hands, Time Etc, Magic, Upwork, Uassist.ME, Virtual Assistant Canada, Virtual Gurus, Pepper Virtual Assistant Services, CIBC, Valenta, Zirtual, Nuance, Fidelity, Others.
3. What are the main segments of the Virtual Assistant Services?
The market segments include Type, Channel, Pricing, End User.
4. Can you provide details about the market size?
The market size is estimated to be USD 1392 million as of 2022.
5. What are some drivers contributing to market growth?
N/A
6. What are the notable trends driving market growth?
N/A
7. Are there any restraints impacting market growth?
N/A
8. Can you provide examples of recent developments in the market?
N/A
9. What pricing options are available for accessing the report?
Pricing options include single-user, multi-user, and enterprise licenses priced at USD 4900.00, USD 7350.00, and USD 9800.00 respectively.
10. Is the market size provided in terms of value or volume?
The market size is provided in terms of value, measured in million.
11. Are there any specific market keywords associated with the report?
Yes, the market keyword associated with the report is "Virtual Assistant Services," which aids in identifying and referencing the specific market segment covered.
12. How do I determine which pricing option suits my needs best?
The pricing options vary based on user requirements and access needs. Individual users may opt for single-user licenses, while businesses requiring broader access may choose multi-user or enterprise licenses for cost-effective access to the report.
13. Are there any additional resources or data provided in the Virtual Assistant Services report?
While the report offers comprehensive insights, it's advisable to review the specific contents or supplementary materials provided to ascertain if additional resources or data are available.
14. How can I stay updated on further developments or reports in the Virtual Assistant Services?
To stay informed about further developments, trends, and reports in the Virtual Assistant Services, consider subscribing to industry newsletters, following relevant companies and organizations, or regularly checking reputable industry news sources and publications.
Methodology
Step 1 - Identification of Relevant Samples Size from Population Database


Step 2 - Approaches for Defining Global Market Size (Value, Volume* & Price*)

Note*: In applicable scenarios
Step 3 - Data Sources
Primary Research
- Web Analytics
- Survey Reports
- Research Institute
- Latest Research Reports
- Opinion Leaders
Secondary Research
- Annual Reports
- White Paper
- Latest Press Release
- Industry Association
- Paid Database
- Investor Presentations

Step 4 - Data Triangulation
Involves using different sources of information in order to increase the validity of a study
These sources are likely to be stakeholders in a program - participants, other researchers, program staff, other community members, and so on.
Then we put all data in single framework & apply various statistical tools to find out the dynamic on the market.
During the analysis stage, feedback from the stakeholder groups would be compared to determine areas of agreement as well as areas of divergence