

Key Insights
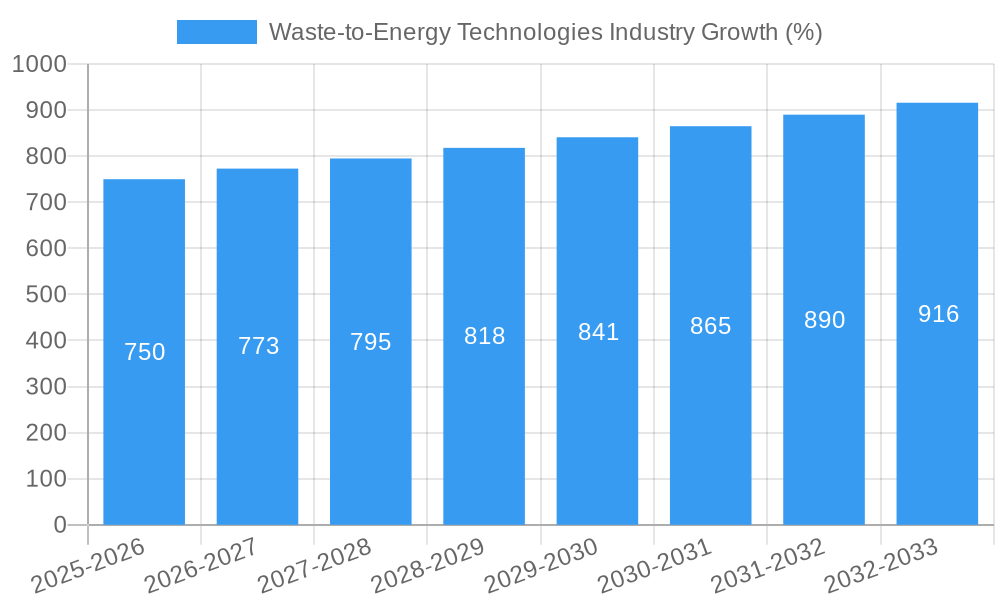
The Waste-to-Energy (WtE) Technologies market is experiencing robust growth, projected to maintain a Compound Annual Growth Rate (CAGR) exceeding 3% from 2025 to 2033. This expansion is driven by increasing global concerns regarding landfill waste management, stringent environmental regulations promoting sustainable waste disposal solutions, and the rising demand for renewable energy sources. Technological advancements in incineration, co-processing, pyrolysis, and gasification are further fueling market growth, offering more efficient and environmentally friendly methods to convert waste into energy. Municipal Solid Waste (MSW) incineration currently dominates the technology segment, but other technologies like pyrolysis and gasification are gaining traction due to their potential for higher energy recovery and reduced emissions. Key players like Veolia, Suez, and Covanta are strategically investing in research and development and expanding their global footprints to capitalize on the market's growth trajectory. Growth is geographically diverse, with North America and Europe currently leading in market share due to well-established infrastructure and supportive policies; however, rapid industrialization and increasing urbanization in regions like Asia-Pacific are expected to drive significant future growth. Challenges remain, including public perception concerns surrounding incineration and the high capital investment required for certain technologies. However, ongoing technological innovations and supportive government policies are mitigating these challenges.
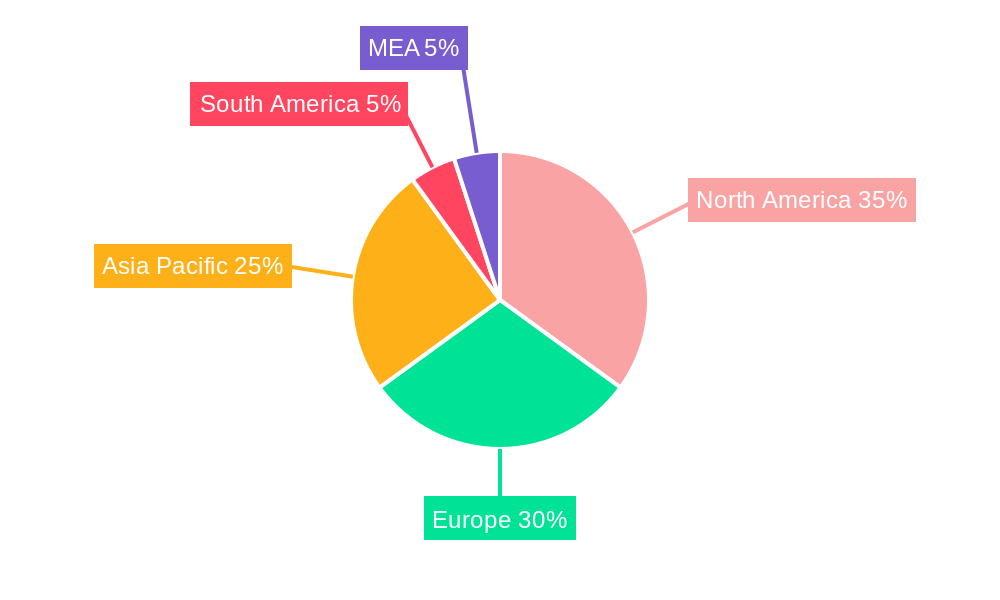
The geographical distribution of the market reflects varying levels of infrastructure development and regulatory environments. North America and Europe, possessing mature waste management systems and strong environmental regulations, currently hold significant market share. However, the Asia-Pacific region, particularly China and India, exhibits substantial growth potential due to rapid urbanization, increasing waste generation, and government initiatives promoting renewable energy sources. South America and the Middle East and Africa (MEA) regions also present promising opportunities, albeit at a slower pace, as infrastructure development and environmental awareness increase. The competitive landscape is characterized by a mix of large multinational corporations and specialized regional players. Strategic mergers and acquisitions, technological collaborations, and expansion into emerging markets are expected to shape the industry's competitive dynamics in the coming years. The market's future success hinges on overcoming technological and regulatory hurdles, fostering public acceptance, and continuing to innovate in waste-to-energy conversion technologies.
Waste-to-Energy Technologies Industry Market Report: 2019-2033
This comprehensive report provides a detailed analysis of the Waste-to-Energy Technologies industry, encompassing market dynamics, growth trends, regional insights, and key player strategies. With a study period spanning 2019-2033, a base year of 2025, and a forecast period of 2025-2033, this report offers invaluable insights for industry professionals, investors, and strategic decision-makers. The report covers parent markets (renewable energy, waste management) and child markets (specific waste-to-energy technologies). Market values are presented in millions.
Waste-to-Energy Technologies Industry Market Dynamics & Structure
The Waste-to-Energy (WtE) technologies market is characterized by a moderately consolidated structure with several multinational players dominating. Market concentration is influenced by technological expertise, geographical presence, and access to capital. Technological innovation, primarily driven by improving energy efficiency and reducing environmental impact, is a key driver. Stringent environmental regulations globally are pushing adoption, but inconsistent regulatory frameworks across different regions remain a challenge. Competitive substitutes include landfill disposal and other renewable energy sources, although the WtE sector offers a solution for waste management alongside energy generation. End-user demographics are largely municipal governments, industrial entities, and private waste management companies. M&A activity in the sector reflects strategic consolidation and expansion efforts. While precise figures for M&A deal volumes are unavailable (xx Million), a noticeable increase was observed in the period 2021-2023 driven primarily by larger players acquiring smaller, specialized firms.
- Market Concentration: Moderately consolidated, with top players holding significant market share (estimated at xx%).
- Technological Innovation: Focused on improving energy efficiency, reducing emissions, and diversifying waste feedstocks.
- Regulatory Framework: Varied globally, influencing adoption rates and investment decisions. Stringent environmental norms in Europe and North America propel growth, while inconsistencies elsewhere are barriers.
- Competitive Substitutes: Landfill disposal, other renewable energy sources.
- End-User Demographics: Municipal governments, industrial entities, and private waste management companies.
- M&A Trends: Strategic consolidation and expansion, with an observed increase in deals in recent years.
Waste-to-Energy Technologies Industry Growth Trends & Insights
The global Waste-to-Energy technologies market witnessed significant growth during the historical period (2019-2024), expanding from xx Million in 2019 to xx Million in 2024. This growth is primarily attributed to increasing urbanization, growing volumes of municipal solid waste (MSW), and stricter environmental regulations promoting sustainable waste management solutions. The adoption rate of WtE technologies varies considerably across regions, influenced by factors such as economic development, technological infrastructure, and policy support. Technological disruptions in the form of advanced gasification, pyrolysis, and plasma technologies are enhancing efficiency and expanding the range of waste types that can be processed. Consumer behavior shifts are witnessing a growing preference for sustainable waste management solutions and renewable energy, further bolstering market growth. The Compound Annual Growth Rate (CAGR) for the historical period is estimated at xx%, with a projected CAGR of xx% during the forecast period (2025-2033), reaching a market size of xx Million by 2033. Market penetration is expected to increase by xx% during the forecast period. This expansion will be driven by government initiatives, rising environmental awareness, and technological advancements resulting in enhanced efficiency and reduced costs.
Dominant Regions, Countries, or Segments in Waste-to-Energy Technologies Industry
Europe and Asia are the dominant regions in the WtE technologies market. Within Europe, Germany and the UK lead in terms of installed capacity and technological advancements, driven by strong environmental regulations and established infrastructure. In Asia, China and Japan are prominent players, fueled by rapid urbanization and increasing waste generation. Within technology segments, Municipal Solid Waste (MSW) Incineration holds the largest market share due to its mature technology and widespread adoption. However, Pyrolysis and Gasification technologies are experiencing rapid growth due to their potential for higher energy recovery and valuable byproduct generation. The following factors drive growth in dominant segments and regions:
- Europe: Stringent environmental regulations, established infrastructure, technological advancements.
- Asia: Rapid urbanization, increasing waste generation, government support for renewable energy.
- MSW Incineration: Mature technology, widespread adoption, cost-effectiveness for large-scale waste management.
- Pyrolysis and Gasification: High energy recovery potential, valuable byproduct generation, growing environmental consciousness.
Waste-to-Energy Technologies Industry Product Landscape
The WtE technology landscape features a diverse range of solutions, including incineration plants with energy recovery, anaerobic digestion systems, gasification and pyrolysis units, and co-processing technologies. Continuous advancements are focused on improving energy efficiency, reducing emissions (particularly greenhouse gases), and expanding the range of waste materials that can be effectively processed. Innovative technologies, such as advanced gasification and plasma arc systems, offer increased energy recovery and reduced environmental footprint. Unique selling propositions frequently include improved efficiency, reduced emissions, and the ability to handle diverse waste streams.
Key Drivers, Barriers & Challenges in Waste-to-Energy Technologies Industry
Key Drivers:
- Stringent environmental regulations: Governments globally are implementing stricter waste management regulations.
- Growing waste generation: Urbanization and rising consumption are leading to increased waste volumes.
- Renewable energy targets: Many countries are aiming to increase their share of renewable energy.
Key Challenges & Restraints:
- High capital costs: The initial investment for WtE facilities is substantial, acting as a barrier to entry, particularly in developing economies. (estimated impact: xx% reduction in market growth).
- Public perception: Negative perceptions surrounding waste incineration can hinder project development and approval (estimated impact: xx% delay in project implementation).
- Technological complexity: Advanced WtE technologies require specialized expertise and maintenance.
Emerging Opportunities in Waste-to-Energy Technologies Industry
- Untapped markets: Developing countries present significant growth potential.
- Innovative applications: The use of WtE technologies for waste-to-chemicals and biofuels is expanding.
- Evolving consumer preferences: Growing demand for sustainable and environmentally friendly waste management.
Growth Accelerators in the Waste-to-Energy Technologies Industry
Technological breakthroughs in gasification and pyrolysis, coupled with supportive government policies and strategic partnerships between technology providers and waste management companies, are accelerating market growth. The development of modular and smaller-scale WtE plants offers cost-effective solutions for regions with limited infrastructure, expanding the reach of the technology to a wider range of locations. This combined with increasing public awareness of sustainable waste management solutions, fuels market expansion and adoption of WtE technology.
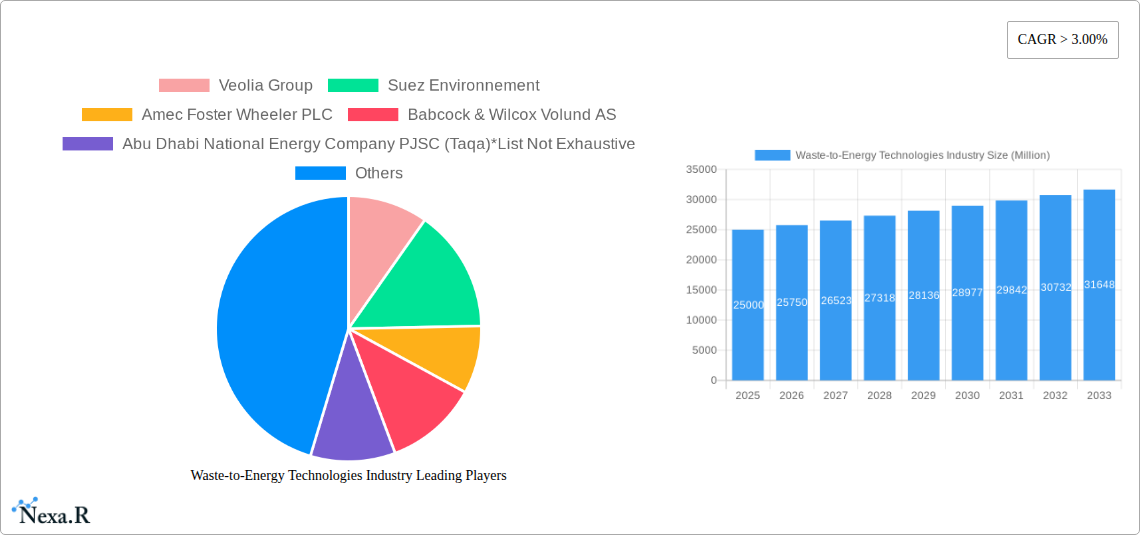
Key Players Shaping the Waste-to-Energy Technologies Industry Market
- Veolia Group
- Suez Environnement
- Amec Foster Wheeler PLC
- Babcock & Wilcox Volund AS
- Abu Dhabi National Energy Company PJSC (Taqa)
- Covanta Holding Corporation
- Ramboll Group AS
- Babcock & Wilcox Enterprises Inc
- Hitachi Zosen Inova AG
- China Everbright International Limited
Notable Milestones in Waste-to-Energy Technologies Industry Sector
- July 2022: Construction of Delhi's fourth waste-to-energy plant nearing completion (25 MW capacity).
- April 2022: Construction of a modern WtE plant in Wiesbaden, Germany (240,000 ton/year capacity).
- December 2022: Thailand plans to build 79 WtE facilities (619.28 MW total capacity) over the next few years.
In-Depth Waste-to-Energy Technologies Industry Market Outlook
The Waste-to-Energy technologies market holds significant future potential, driven by the converging trends of growing waste generation, stringent environmental regulations, and the increasing adoption of renewable energy solutions. Strategic opportunities lie in developing innovative technologies, expanding into untapped markets, and forging strategic partnerships to accelerate market penetration. The focus on efficient and environmentally friendly technologies, alongside supportive government policies, promises continued strong growth in the coming years.
Waste-to-Energy Technologies Industry Segmentation
-
1. Technology
- 1.1. Municipal Solid Waste (MSW) Incineration
- 1.2. Co-processing
- 1.3. Pyrolysis and Gasification
- 1.4. Other Technologies
Waste-to-Energy Technologies Industry Segmentation By Geography
- 1. North America
- 2. Asia Pacific
- 3. Europe
- 4. South America
- 5. Middle East and Africa
Waste-to-Energy Technologies Industry REPORT HIGHLIGHTS
| Aspects | Details |
|---|---|
| Study Period | 2019-2033 |
| Base Year | 2024 |
| Estimated Year | 2025 |
| Forecast Period | 2025-2033 |
| Historical Period | 2019-2024 |
| Growth Rate | CAGR of > 3.00% from 2019-2033 |
| Segmentation |
|
Table of Contents
- 1. Introduction
- 1.1. Research Scope
- 1.2. Market Segmentation
- 1.3. Research Methodology
- 1.4. Definitions and Assumptions
- 2. Executive Summary
- 2.1. Introduction
- 3. Market Dynamics
- 3.1. Introduction
- 3.2. Market Drivers
- 3.2.1. 4.; Declining Lithium-Ion Battery Prices4.; Increasing Adoption Of Electric Vehicles
- 3.3. Market Restrains
- 3.3.1. 4.; Safety Concerns Related To Lithium-Ion Battery
- 3.4. Market Trends
- 3.4.1. Municipal Solid Waste Incineration (MSWI) as a Prominent Technology
- 4. Market Factor Analysis
- 4.1. Porters Five Forces
- 4.2. Supply/Value Chain
- 4.3. PESTEL analysis
- 4.4. Market Entropy
- 4.5. Patent/Trademark Analysis
- 5. Global Waste-to-Energy Technologies Industry Analysis, Insights and Forecast, 2019-2031
- 5.1. Market Analysis, Insights and Forecast - by Technology
- 5.1.1. Municipal Solid Waste (MSW) Incineration
- 5.1.2. Co-processing
- 5.1.3. Pyrolysis and Gasification
- 5.1.4. Other Technologies
- 5.2. Market Analysis, Insights and Forecast - by Region
- 5.2.1. North America
- 5.2.2. Asia Pacific
- 5.2.3. Europe
- 5.2.4. South America
- 5.2.5. Middle East and Africa
- 5.1. Market Analysis, Insights and Forecast - by Technology
- 6. North America Waste-to-Energy Technologies Industry Analysis, Insights and Forecast, 2019-2031
- 6.1. Market Analysis, Insights and Forecast - by Technology
- 6.1.1. Municipal Solid Waste (MSW) Incineration
- 6.1.2. Co-processing
- 6.1.3. Pyrolysis and Gasification
- 6.1.4. Other Technologies
- 6.1. Market Analysis, Insights and Forecast - by Technology
- 7. Asia Pacific Waste-to-Energy Technologies Industry Analysis, Insights and Forecast, 2019-2031
- 7.1. Market Analysis, Insights and Forecast - by Technology
- 7.1.1. Municipal Solid Waste (MSW) Incineration
- 7.1.2. Co-processing
- 7.1.3. Pyrolysis and Gasification
- 7.1.4. Other Technologies
- 7.1. Market Analysis, Insights and Forecast - by Technology
- 8. Europe Waste-to-Energy Technologies Industry Analysis, Insights and Forecast, 2019-2031
- 8.1. Market Analysis, Insights and Forecast - by Technology
- 8.1.1. Municipal Solid Waste (MSW) Incineration
- 8.1.2. Co-processing
- 8.1.3. Pyrolysis and Gasification
- 8.1.4. Other Technologies
- 8.1. Market Analysis, Insights and Forecast - by Technology
- 9. South America Waste-to-Energy Technologies Industry Analysis, Insights and Forecast, 2019-2031
- 9.1. Market Analysis, Insights and Forecast - by Technology
- 9.1.1. Municipal Solid Waste (MSW) Incineration
- 9.1.2. Co-processing
- 9.1.3. Pyrolysis and Gasification
- 9.1.4. Other Technologies
- 9.1. Market Analysis, Insights and Forecast - by Technology
- 10. Middle East and Africa Waste-to-Energy Technologies Industry Analysis, Insights and Forecast, 2019-2031
- 10.1. Market Analysis, Insights and Forecast - by Technology
- 10.1.1. Municipal Solid Waste (MSW) Incineration
- 10.1.2. Co-processing
- 10.1.3. Pyrolysis and Gasification
- 10.1.4. Other Technologies
- 10.1. Market Analysis, Insights and Forecast - by Technology
- 11. North America Waste-to-Energy Technologies Industry Analysis, Insights and Forecast, 2019-2031
- 11.1. Market Analysis, Insights and Forecast - By Country/Sub-region
- 11.1.1 United States
- 11.1.2 Canada
- 11.1.3 Mexico
- 12. Europe Waste-to-Energy Technologies Industry Analysis, Insights and Forecast, 2019-2031
- 12.1. Market Analysis, Insights and Forecast - By Country/Sub-region
- 12.1.1 Germany
- 12.1.2 United Kingdom
- 12.1.3 France
- 12.1.4 Spain
- 12.1.5 Italy
- 12.1.6 Spain
- 12.1.7 Belgium
- 12.1.8 Netherland
- 12.1.9 Nordics
- 12.1.10 Rest of Europe
- 13. Asia Pacific Waste-to-Energy Technologies Industry Analysis, Insights and Forecast, 2019-2031
- 13.1. Market Analysis, Insights and Forecast - By Country/Sub-region
- 13.1.1 China
- 13.1.2 Japan
- 13.1.3 India
- 13.1.4 South Korea
- 13.1.5 Southeast Asia
- 13.1.6 Australia
- 13.1.7 Indonesia
- 13.1.8 Phillipes
- 13.1.9 Singapore
- 13.1.10 Thailandc
- 13.1.11 Rest of Asia Pacific
- 14. South America Waste-to-Energy Technologies Industry Analysis, Insights and Forecast, 2019-2031
- 14.1. Market Analysis, Insights and Forecast - By Country/Sub-region
- 14.1.1 Brazil
- 14.1.2 Argentina
- 14.1.3 Peru
- 14.1.4 Chile
- 14.1.5 Colombia
- 14.1.6 Ecuador
- 14.1.7 Venezuela
- 14.1.8 Rest of South America
- 15. North America Waste-to-Energy Technologies Industry Analysis, Insights and Forecast, 2019-2031
- 15.1. Market Analysis, Insights and Forecast - By Country/Sub-region
- 15.1.1 United States
- 15.1.2 Canada
- 15.1.3 Mexico
- 16. MEA Waste-to-Energy Technologies Industry Analysis, Insights and Forecast, 2019-2031
- 16.1. Market Analysis, Insights and Forecast - By Country/Sub-region
- 16.1.1 United Arab Emirates
- 16.1.2 Saudi Arabia
- 16.1.3 South Africa
- 16.1.4 Rest of Middle East and Africa
- 17. Competitive Analysis
- 17.1. Global Market Share Analysis 2024
- 17.2. Company Profiles
- 17.2.1 Veolia Group
- 17.2.1.1. Overview
- 17.2.1.2. Products
- 17.2.1.3. SWOT Analysis
- 17.2.1.4. Recent Developments
- 17.2.1.5. Financials (Based on Availability)
- 17.2.2 Suez Environnement
- 17.2.2.1. Overview
- 17.2.2.2. Products
- 17.2.2.3. SWOT Analysis
- 17.2.2.4. Recent Developments
- 17.2.2.5. Financials (Based on Availability)
- 17.2.3 Amec Foster Wheeler PLC
- 17.2.3.1. Overview
- 17.2.3.2. Products
- 17.2.3.3. SWOT Analysis
- 17.2.3.4. Recent Developments
- 17.2.3.5. Financials (Based on Availability)
- 17.2.4 Babcock & Wilcox Volund AS
- 17.2.4.1. Overview
- 17.2.4.2. Products
- 17.2.4.3. SWOT Analysis
- 17.2.4.4. Recent Developments
- 17.2.4.5. Financials (Based on Availability)
- 17.2.5 Abu Dhabi National Energy Company PJSC (Taqa)*List Not Exhaustive
- 17.2.5.1. Overview
- 17.2.5.2. Products
- 17.2.5.3. SWOT Analysis
- 17.2.5.4. Recent Developments
- 17.2.5.5. Financials (Based on Availability)
- 17.2.6 Covanta Holding Corporation
- 17.2.6.1. Overview
- 17.2.6.2. Products
- 17.2.6.3. SWOT Analysis
- 17.2.6.4. Recent Developments
- 17.2.6.5. Financials (Based on Availability)
- 17.2.7 Ramboll Group AS
- 17.2.7.1. Overview
- 17.2.7.2. Products
- 17.2.7.3. SWOT Analysis
- 17.2.7.4. Recent Developments
- 17.2.7.5. Financials (Based on Availability)
- 17.2.8 Babcock & Wilcox Enterprises Inc
- 17.2.8.1. Overview
- 17.2.8.2. Products
- 17.2.8.3. SWOT Analysis
- 17.2.8.4. Recent Developments
- 17.2.8.5. Financials (Based on Availability)
- 17.2.9 Hitachi Zosen Inova AG
- 17.2.9.1. Overview
- 17.2.9.2. Products
- 17.2.9.3. SWOT Analysis
- 17.2.9.4. Recent Developments
- 17.2.9.5. Financials (Based on Availability)
- 17.2.10 China Everbright International Limited
- 17.2.10.1. Overview
- 17.2.10.2. Products
- 17.2.10.3. SWOT Analysis
- 17.2.10.4. Recent Developments
- 17.2.10.5. Financials (Based on Availability)
- 17.2.1 Veolia Group
List of Figures
- Figure 1: Global Waste-to-Energy Technologies Industry Revenue Breakdown (Million, %) by Region 2024 & 2032
- Figure 2: North America Waste-to-Energy Technologies Industry Revenue (Million), by Country 2024 & 2032
- Figure 3: North America Waste-to-Energy Technologies Industry Revenue Share (%), by Country 2024 & 2032
- Figure 4: Europe Waste-to-Energy Technologies Industry Revenue (Million), by Country 2024 & 2032
- Figure 5: Europe Waste-to-Energy Technologies Industry Revenue Share (%), by Country 2024 & 2032
- Figure 6: Asia Pacific Waste-to-Energy Technologies Industry Revenue (Million), by Country 2024 & 2032
- Figure 7: Asia Pacific Waste-to-Energy Technologies Industry Revenue Share (%), by Country 2024 & 2032
- Figure 8: South America Waste-to-Energy Technologies Industry Revenue (Million), by Country 2024 & 2032
- Figure 9: South America Waste-to-Energy Technologies Industry Revenue Share (%), by Country 2024 & 2032
- Figure 10: North America Waste-to-Energy Technologies Industry Revenue (Million), by Country 2024 & 2032
- Figure 11: North America Waste-to-Energy Technologies Industry Revenue Share (%), by Country 2024 & 2032
- Figure 12: MEA Waste-to-Energy Technologies Industry Revenue (Million), by Country 2024 & 2032
- Figure 13: MEA Waste-to-Energy Technologies Industry Revenue Share (%), by Country 2024 & 2032
- Figure 14: North America Waste-to-Energy Technologies Industry Revenue (Million), by Technology 2024 & 2032
- Figure 15: North America Waste-to-Energy Technologies Industry Revenue Share (%), by Technology 2024 & 2032
- Figure 16: North America Waste-to-Energy Technologies Industry Revenue (Million), by Country 2024 & 2032
- Figure 17: North America Waste-to-Energy Technologies Industry Revenue Share (%), by Country 2024 & 2032
- Figure 18: Asia Pacific Waste-to-Energy Technologies Industry Revenue (Million), by Technology 2024 & 2032
- Figure 19: Asia Pacific Waste-to-Energy Technologies Industry Revenue Share (%), by Technology 2024 & 2032
- Figure 20: Asia Pacific Waste-to-Energy Technologies Industry Revenue (Million), by Country 2024 & 2032
- Figure 21: Asia Pacific Waste-to-Energy Technologies Industry Revenue Share (%), by Country 2024 & 2032
- Figure 22: Europe Waste-to-Energy Technologies Industry Revenue (Million), by Technology 2024 & 2032
- Figure 23: Europe Waste-to-Energy Technologies Industry Revenue Share (%), by Technology 2024 & 2032
- Figure 24: Europe Waste-to-Energy Technologies Industry Revenue (Million), by Country 2024 & 2032
- Figure 25: Europe Waste-to-Energy Technologies Industry Revenue Share (%), by Country 2024 & 2032
- Figure 26: South America Waste-to-Energy Technologies Industry Revenue (Million), by Technology 2024 & 2032
- Figure 27: South America Waste-to-Energy Technologies Industry Revenue Share (%), by Technology 2024 & 2032
- Figure 28: South America Waste-to-Energy Technologies Industry Revenue (Million), by Country 2024 & 2032
- Figure 29: South America Waste-to-Energy Technologies Industry Revenue Share (%), by Country 2024 & 2032
- Figure 30: Middle East and Africa Waste-to-Energy Technologies Industry Revenue (Million), by Technology 2024 & 2032
- Figure 31: Middle East and Africa Waste-to-Energy Technologies Industry Revenue Share (%), by Technology 2024 & 2032
- Figure 32: Middle East and Africa Waste-to-Energy Technologies Industry Revenue (Million), by Country 2024 & 2032
- Figure 33: Middle East and Africa Waste-to-Energy Technologies Industry Revenue Share (%), by Country 2024 & 2032
List of Tables
- Table 1: Global Waste-to-Energy Technologies Industry Revenue Million Forecast, by Region 2019 & 2032
- Table 2: Global Waste-to-Energy Technologies Industry Revenue Million Forecast, by Technology 2019 & 2032
- Table 3: Global Waste-to-Energy Technologies Industry Revenue Million Forecast, by Region 2019 & 2032
- Table 4: Global Waste-to-Energy Technologies Industry Revenue Million Forecast, by Country 2019 & 2032
- Table 5: United States Waste-to-Energy Technologies Industry Revenue (Million) Forecast, by Application 2019 & 2032
- Table 6: Canada Waste-to-Energy Technologies Industry Revenue (Million) Forecast, by Application 2019 & 2032
- Table 7: Mexico Waste-to-Energy Technologies Industry Revenue (Million) Forecast, by Application 2019 & 2032
- Table 8: Global Waste-to-Energy Technologies Industry Revenue Million Forecast, by Country 2019 & 2032
- Table 9: Germany Waste-to-Energy Technologies Industry Revenue (Million) Forecast, by Application 2019 & 2032
- Table 10: United Kingdom Waste-to-Energy Technologies Industry Revenue (Million) Forecast, by Application 2019 & 2032
- Table 11: France Waste-to-Energy Technologies Industry Revenue (Million) Forecast, by Application 2019 & 2032
- Table 12: Spain Waste-to-Energy Technologies Industry Revenue (Million) Forecast, by Application 2019 & 2032
- Table 13: Italy Waste-to-Energy Technologies Industry Revenue (Million) Forecast, by Application 2019 & 2032
- Table 14: Spain Waste-to-Energy Technologies Industry Revenue (Million) Forecast, by Application 2019 & 2032
- Table 15: Belgium Waste-to-Energy Technologies Industry Revenue (Million) Forecast, by Application 2019 & 2032
- Table 16: Netherland Waste-to-Energy Technologies Industry Revenue (Million) Forecast, by Application 2019 & 2032
- Table 17: Nordics Waste-to-Energy Technologies Industry Revenue (Million) Forecast, by Application 2019 & 2032
- Table 18: Rest of Europe Waste-to-Energy Technologies Industry Revenue (Million) Forecast, by Application 2019 & 2032
- Table 19: Global Waste-to-Energy Technologies Industry Revenue Million Forecast, by Country 2019 & 2032
- Table 20: China Waste-to-Energy Technologies Industry Revenue (Million) Forecast, by Application 2019 & 2032
- Table 21: Japan Waste-to-Energy Technologies Industry Revenue (Million) Forecast, by Application 2019 & 2032
- Table 22: India Waste-to-Energy Technologies Industry Revenue (Million) Forecast, by Application 2019 & 2032
- Table 23: South Korea Waste-to-Energy Technologies Industry Revenue (Million) Forecast, by Application 2019 & 2032
- Table 24: Southeast Asia Waste-to-Energy Technologies Industry Revenue (Million) Forecast, by Application 2019 & 2032
- Table 25: Australia Waste-to-Energy Technologies Industry Revenue (Million) Forecast, by Application 2019 & 2032
- Table 26: Indonesia Waste-to-Energy Technologies Industry Revenue (Million) Forecast, by Application 2019 & 2032
- Table 27: Phillipes Waste-to-Energy Technologies Industry Revenue (Million) Forecast, by Application 2019 & 2032
- Table 28: Singapore Waste-to-Energy Technologies Industry Revenue (Million) Forecast, by Application 2019 & 2032
- Table 29: Thailandc Waste-to-Energy Technologies Industry Revenue (Million) Forecast, by Application 2019 & 2032
- Table 30: Rest of Asia Pacific Waste-to-Energy Technologies Industry Revenue (Million) Forecast, by Application 2019 & 2032
- Table 31: Global Waste-to-Energy Technologies Industry Revenue Million Forecast, by Country 2019 & 2032
- Table 32: Brazil Waste-to-Energy Technologies Industry Revenue (Million) Forecast, by Application 2019 & 2032
- Table 33: Argentina Waste-to-Energy Technologies Industry Revenue (Million) Forecast, by Application 2019 & 2032
- Table 34: Peru Waste-to-Energy Technologies Industry Revenue (Million) Forecast, by Application 2019 & 2032
- Table 35: Chile Waste-to-Energy Technologies Industry Revenue (Million) Forecast, by Application 2019 & 2032
- Table 36: Colombia Waste-to-Energy Technologies Industry Revenue (Million) Forecast, by Application 2019 & 2032
- Table 37: Ecuador Waste-to-Energy Technologies Industry Revenue (Million) Forecast, by Application 2019 & 2032
- Table 38: Venezuela Waste-to-Energy Technologies Industry Revenue (Million) Forecast, by Application 2019 & 2032
- Table 39: Rest of South America Waste-to-Energy Technologies Industry Revenue (Million) Forecast, by Application 2019 & 2032
- Table 40: Global Waste-to-Energy Technologies Industry Revenue Million Forecast, by Country 2019 & 2032
- Table 41: United States Waste-to-Energy Technologies Industry Revenue (Million) Forecast, by Application 2019 & 2032
- Table 42: Canada Waste-to-Energy Technologies Industry Revenue (Million) Forecast, by Application 2019 & 2032
- Table 43: Mexico Waste-to-Energy Technologies Industry Revenue (Million) Forecast, by Application 2019 & 2032
- Table 44: Global Waste-to-Energy Technologies Industry Revenue Million Forecast, by Country 2019 & 2032
- Table 45: United Arab Emirates Waste-to-Energy Technologies Industry Revenue (Million) Forecast, by Application 2019 & 2032
- Table 46: Saudi Arabia Waste-to-Energy Technologies Industry Revenue (Million) Forecast, by Application 2019 & 2032
- Table 47: South Africa Waste-to-Energy Technologies Industry Revenue (Million) Forecast, by Application 2019 & 2032
- Table 48: Rest of Middle East and Africa Waste-to-Energy Technologies Industry Revenue (Million) Forecast, by Application 2019 & 2032
- Table 49: Global Waste-to-Energy Technologies Industry Revenue Million Forecast, by Technology 2019 & 2032
- Table 50: Global Waste-to-Energy Technologies Industry Revenue Million Forecast, by Country 2019 & 2032
- Table 51: Global Waste-to-Energy Technologies Industry Revenue Million Forecast, by Technology 2019 & 2032
- Table 52: Global Waste-to-Energy Technologies Industry Revenue Million Forecast, by Country 2019 & 2032
- Table 53: Global Waste-to-Energy Technologies Industry Revenue Million Forecast, by Technology 2019 & 2032
- Table 54: Global Waste-to-Energy Technologies Industry Revenue Million Forecast, by Country 2019 & 2032
- Table 55: Global Waste-to-Energy Technologies Industry Revenue Million Forecast, by Technology 2019 & 2032
- Table 56: Global Waste-to-Energy Technologies Industry Revenue Million Forecast, by Country 2019 & 2032
- Table 57: Global Waste-to-Energy Technologies Industry Revenue Million Forecast, by Technology 2019 & 2032
- Table 58: Global Waste-to-Energy Technologies Industry Revenue Million Forecast, by Country 2019 & 2032
Frequently Asked Questions
1. What is the projected Compound Annual Growth Rate (CAGR) of the Waste-to-Energy Technologies Industry?
The projected CAGR is approximately > 3.00%.
2. Which companies are prominent players in the Waste-to-Energy Technologies Industry?
Key companies in the market include Veolia Group, Suez Environnement, Amec Foster Wheeler PLC, Babcock & Wilcox Volund AS, Abu Dhabi National Energy Company PJSC (Taqa)*List Not Exhaustive, Covanta Holding Corporation, Ramboll Group AS, Babcock & Wilcox Enterprises Inc, Hitachi Zosen Inova AG, China Everbright International Limited.
3. What are the main segments of the Waste-to-Energy Technologies Industry?
The market segments include Technology.
4. Can you provide details about the market size?
The market size is estimated to be USD XX Million as of 2022.
5. What are some drivers contributing to market growth?
4.; Declining Lithium-Ion Battery Prices4.; Increasing Adoption Of Electric Vehicles.
6. What are the notable trends driving market growth?
Municipal Solid Waste Incineration (MSWI) as a Prominent Technology.
7. Are there any restraints impacting market growth?
4.; Safety Concerns Related To Lithium-Ion Battery.
8. Can you provide examples of recent developments in the market?
As of July 2022, the construction of Delhi's fourth waste-to-energy plant in Tehkhand, southeast Delhi, was nearing completion. According to a senior Municipal Corporation of Delhi (MCD) official, the plant will generate 25 megawatts (MW) of power by utilizing 2,000 ton of municipal solid waste (MSW) discharged at the Okhla landfill site daily.
9. What pricing options are available for accessing the report?
Pricing options include single-user, multi-user, and enterprise licenses priced at USD 4750, USD 5250, and USD 8750 respectively.
10. Is the market size provided in terms of value or volume?
The market size is provided in terms of value, measured in Million.
11. Are there any specific market keywords associated with the report?
Yes, the market keyword associated with the report is "Waste-to-Energy Technologies Industry," which aids in identifying and referencing the specific market segment covered.
12. How do I determine which pricing option suits my needs best?
The pricing options vary based on user requirements and access needs. Individual users may opt for single-user licenses, while businesses requiring broader access may choose multi-user or enterprise licenses for cost-effective access to the report.
13. Are there any additional resources or data provided in the Waste-to-Energy Technologies Industry report?
While the report offers comprehensive insights, it's advisable to review the specific contents or supplementary materials provided to ascertain if additional resources or data are available.
14. How can I stay updated on further developments or reports in the Waste-to-Energy Technologies Industry?
To stay informed about further developments, trends, and reports in the Waste-to-Energy Technologies Industry, consider subscribing to industry newsletters, following relevant companies and organizations, or regularly checking reputable industry news sources and publications.
Methodology
Step 1 - Identification of Relevant Samples Size from Population Database


Step 2 - Approaches for Defining Global Market Size (Value, Volume* & Price*)

Note*: In applicable scenarios
Step 3 - Data Sources
Primary Research
- Web Analytics
- Survey Reports
- Research Institute
- Latest Research Reports
- Opinion Leaders
Secondary Research
- Annual Reports
- White Paper
- Latest Press Release
- Industry Association
- Paid Database
- Investor Presentations

Step 4 - Data Triangulation
Involves using different sources of information in order to increase the validity of a study
These sources are likely to be stakeholders in a program - participants, other researchers, program staff, other community members, and so on.
Then we put all data in single framework & apply various statistical tools to find out the dynamic on the market.
During the analysis stage, feedback from the stakeholder groups would be compared to determine areas of agreement as well as areas of divergence
