


Key Insights
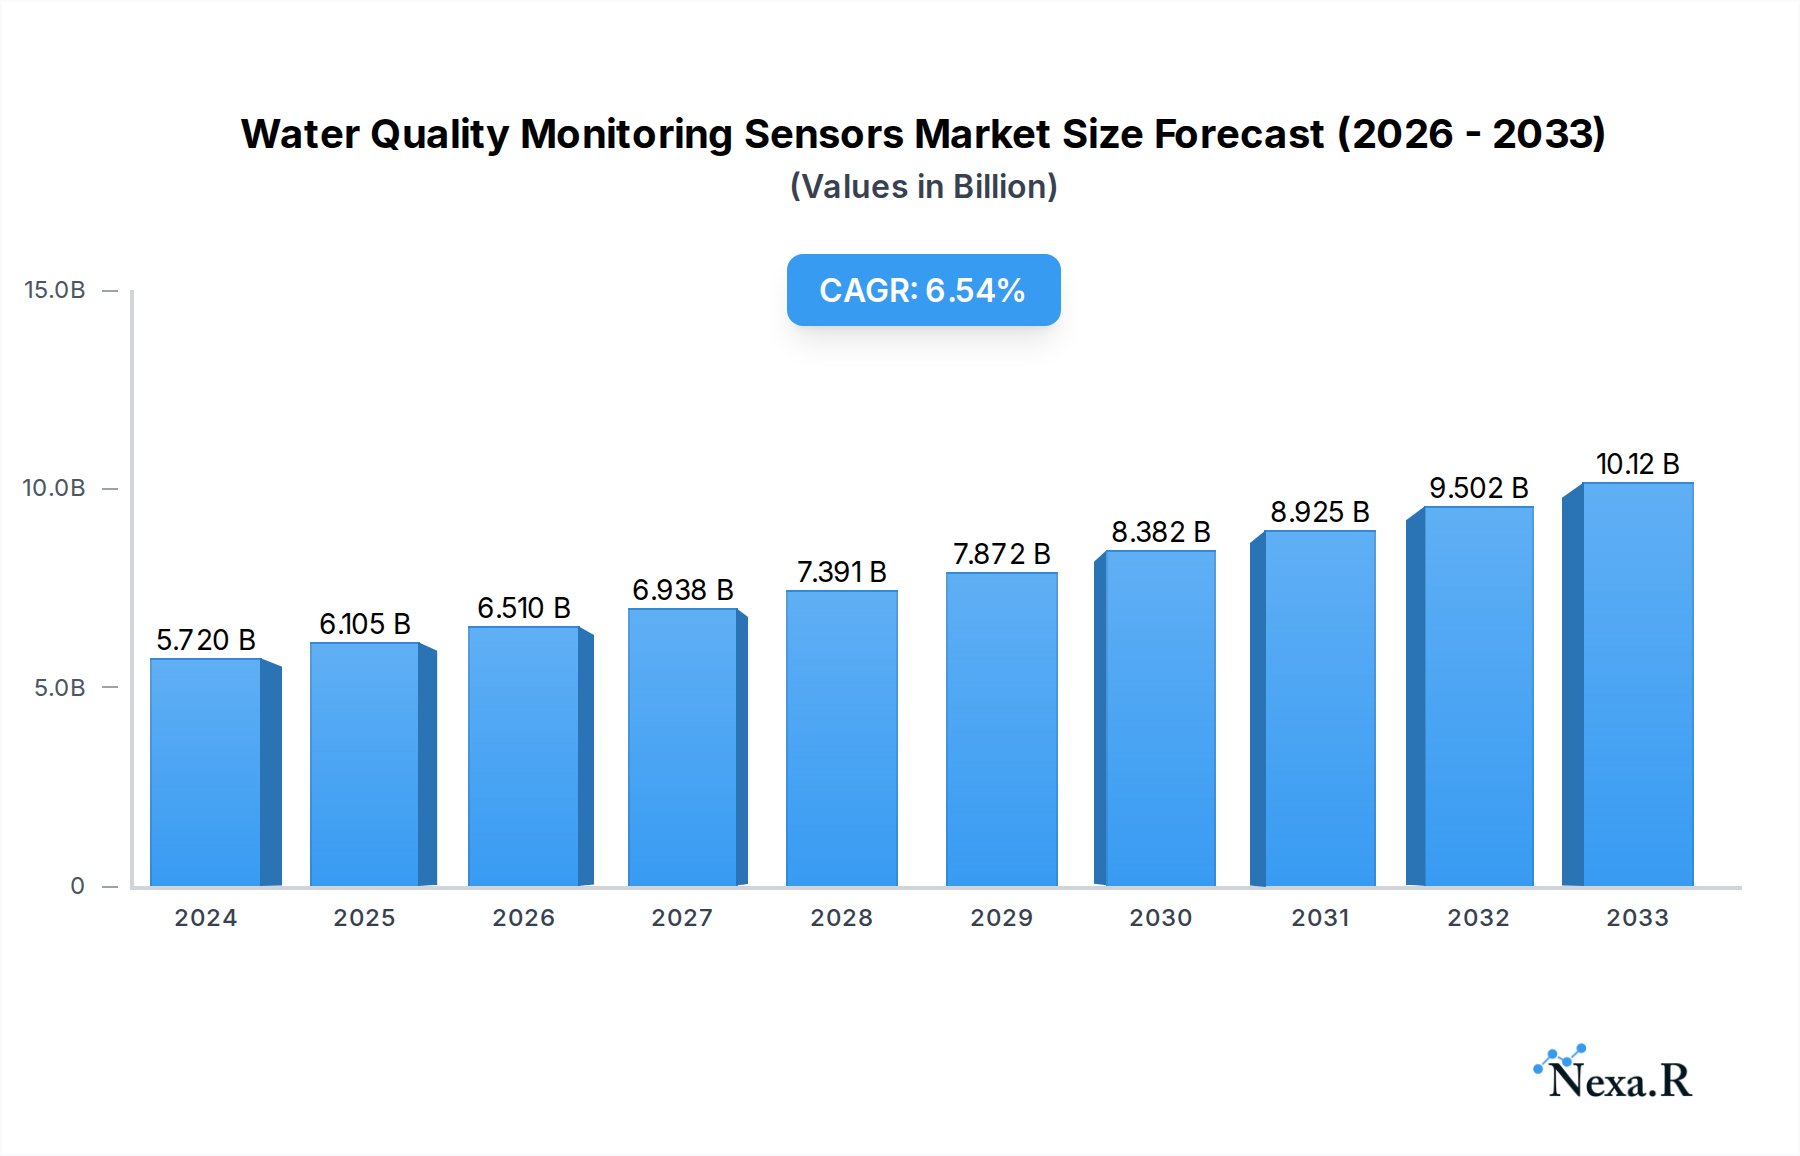
The global Water Quality Monitoring Sensors market is poised for significant expansion, reaching an estimated $5.72 billion in 2024. This robust growth trajectory is underpinned by a compound annual growth rate (CAGR) of 6.51%, indicating sustained demand and innovation within the sector. The increasing global awareness and stringent regulations surrounding water purity, coupled with a growing need for efficient and accurate real-time data, are primary catalysts driving this market forward. Key applications span across essential sectors such as ensuring the safety of drinking water, managing wastewater treatment processes, safeguarding aquaculture environments, and monitoring ground and surface water bodies for environmental health. The market is further segmented by sensor types, including portable and stationary solutions, catering to diverse operational needs and deployment scenarios. The integration of advanced technologies like IoT and AI is revolutionizing the capabilities of these sensors, enabling predictive maintenance and more sophisticated analytical insights.
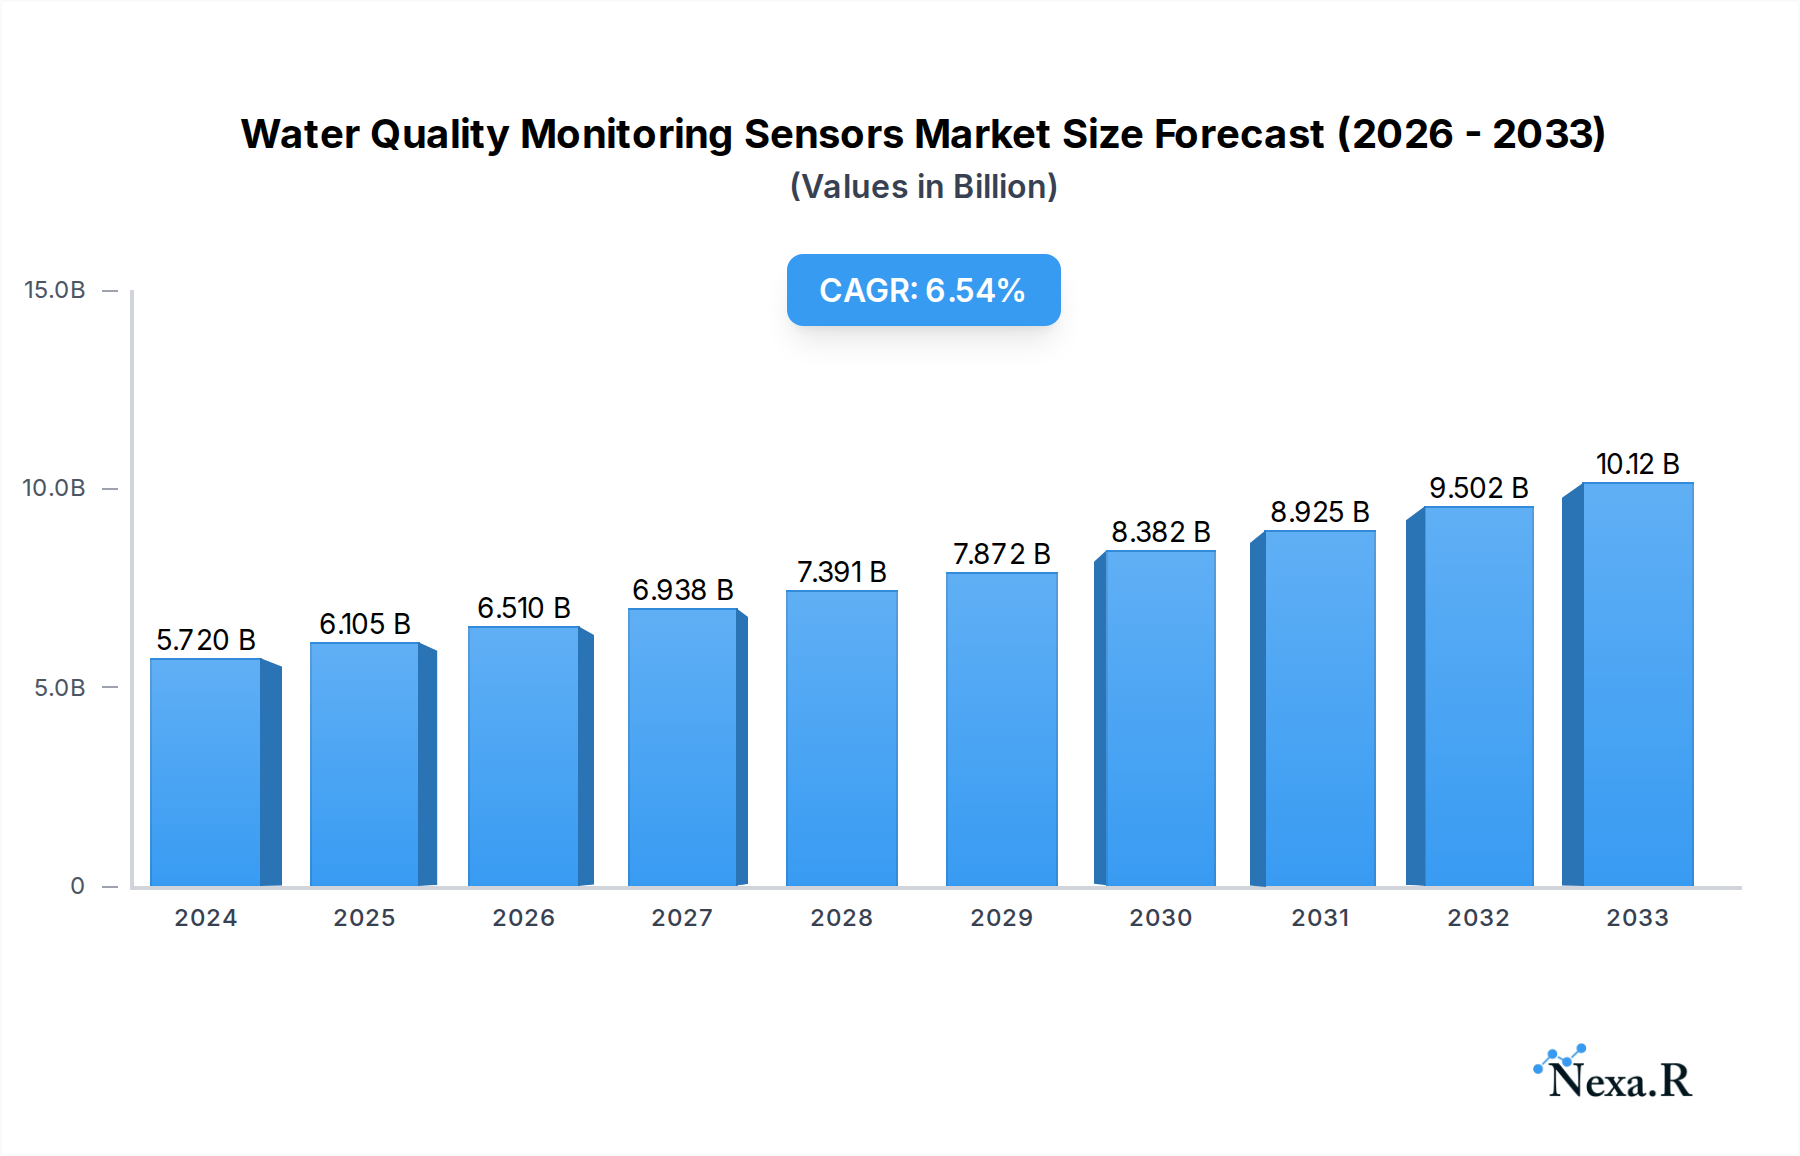
Water Quality Monitoring Sensors Market Size (In Billion)

Several critical drivers are fueling this market's ascent. The escalating concerns over water scarcity and pollution, particularly in rapidly industrializing and densely populated regions, necessitate continuous and reliable water quality assessment. Government initiatives and environmental protection agencies worldwide are enforcing stricter discharge limits and water quality standards, compelling industries and municipalities to invest in advanced monitoring systems. Furthermore, the burgeoning smart city initiatives and the rise of the Internet of Things (IoT) are creating a fertile ground for connected water quality sensors, facilitating remote monitoring and data aggregation. While the market exhibits strong growth, potential restraints include the high initial cost of sophisticated sensor technologies and the need for skilled personnel for installation and maintenance. However, ongoing technological advancements are expected to drive down costs and improve user-friendliness, mitigating these concerns and paving the way for broader adoption.
Water Quality Monitoring Sensors Company Market Share
Water Quality Monitoring Sensors Market Report: Comprehensive Analysis and Future Outlook (2019-2033)
This comprehensive report delves into the dynamic water quality monitoring sensors market, analyzing its intricate structure, growth trajectory, regional dominance, product innovation, and future outlook. With a focus on high-traffic keywords and an in-depth exploration of parent and child markets, this report is an essential resource for industry professionals seeking to understand and capitalize on market opportunities. The study period spans from 2019 to 2033, with a base year of 2025.
Water Quality Monitoring Sensors Market Dynamics & Structure
The global water quality monitoring sensors market is characterized by a moderate to high level of concentration, with key players like Honeywell, Thermo Fisher Scientific, Horiba, Ltd, Siemens AG, and Emerson holding significant market shares. Technological innovation serves as a primary driver, fueled by the increasing demand for real-time, accurate, and cost-effective water quality data across diverse applications. Stringent regulatory frameworks, such as those imposed by the EPA and EU directives, mandate regular water quality testing, thereby bolstering market demand. Competitive product substitutes, including manual testing kits and laboratory analysis, are gradually being eclipsed by the efficiency and convenience offered by advanced sensor technologies. End-user demographics are broadening, encompassing municipal water bodies, industrial facilities, environmental agencies, agricultural enterprises, and the aquaculture sector. Mergers and acquisitions (M&A) trends are actively shaping the competitive landscape, with strategic consolidations aimed at expanding product portfolios and market reach. For instance, approximately 15-20 M&A deals were observed between 2021 and 2024, indicating a proactive approach by companies to gain a competitive edge. Barriers to innovation primarily revolve around the high cost of R&D for novel sensor technologies and the need for extensive validation and calibration procedures.
Water Quality Monitoring Sensors Growth Trends & Insights
The water quality monitoring sensors market is poised for substantial growth, projected to reach an estimated $12.5 billion by 2033, with a Compound Annual Growth Rate (CAGR) of approximately 7.8% during the forecast period (2025–2033). This robust expansion is driven by a confluence of factors, including a growing global population, increasing industrialization, and a heightened awareness of the critical importance of clean water for public health and environmental sustainability. Adoption rates for advanced water quality monitoring solutions are accelerating across both developed and developing economies, as governments and industries recognize the long-term economic and social benefits of proactive water management. Technological disruptions, such as the integration of IoT, AI, and cloud computing with sensor networks, are revolutionizing data analysis, predictive maintenance, and remote monitoring capabilities. This technological evolution is leading to more sophisticated and user-friendly sensor systems. Consumer behavior shifts are also playing a significant role; individuals and communities are demanding greater transparency and accountability regarding water quality, pushing for more rigorous and continuous monitoring. The market penetration of smart water quality sensors is expected to surge, moving beyond traditional applications to encompass a wider array of niche sectors and domestic use. The base year market size in 2025 is estimated at $7.1 billion.
Dominant Regions, Countries, or Segments in Water Quality Monitoring Sensors
The Ground and Surface Water application segment is a dominant force within the water quality monitoring sensors market, driven by its critical role in environmental protection, public health, and resource management. This segment is expected to account for an estimated 35% of the total market value by 2033. Key drivers for its dominance include extensive government regulations for monitoring rivers, lakes, and groundwater reserves, coupled with increasing concerns about pollution and the impact of climate change on water bodies.
- North America currently leads in market share due to stringent environmental regulations, advanced technological infrastructure, and significant investment in water resource management. The United States, in particular, exhibits high adoption rates for sophisticated monitoring systems in both urban and rural areas.
- Europe closely follows, with countries like Germany, the UK, and France investing heavily in smart water initiatives and adhering to comprehensive EU water directives, further propelling the demand for advanced sensors.
- The Asia-Pacific region is emerging as a high-growth market, fueled by rapid industrialization, increasing urbanization, and a growing awareness of water scarcity and pollution issues in countries like China and India. Government initiatives to improve water infrastructure and sanitation are significant growth accelerators.
Within the Types segment, Stationary Type sensors are projected to hold the larger market share, estimated at around 60% by 2033. This dominance is attributed to their suitability for continuous, long-term monitoring of fixed locations, such as treatment plants, industrial discharge points, and major water sources, providing consistent and reliable data streams essential for regulatory compliance and operational efficiency. The increasing deployment of smart water grids and automated monitoring systems further bolsters the demand for stationary solutions.
Water Quality Monitoring Sensors Product Landscape
The product landscape of water quality monitoring sensors is marked by continuous innovation focused on enhanced accuracy, miniaturization, and multi-parameter sensing capabilities. Manufacturers are developing sophisticated sensors that can simultaneously measure parameters such as pH, dissolved oxygen, turbidity, conductivity, specific ions (e.g., nitrates, phosphates), and the presence of organic pollutants. Key advancements include the integration of nanomaterials for improved sensitivity and selectivity, the development of low-power sensors for extended remote deployment, and the incorporation of wireless communication modules for seamless data transmission. Applications are expanding beyond traditional environmental monitoring to include real-time process control in industrial settings and advanced diagnostics in healthcare.
Key Drivers, Barriers & Challenges in Water Quality Monitoring Sensors
Key Drivers:
- Stringent Environmental Regulations: Growing global emphasis on water purity and conservation mandates rigorous monitoring, driving demand for reliable sensor technology.
- Increasing Water Scarcity and Pollution: The rising incidence of water contamination and the scarcity of clean water necessitate continuous and accurate monitoring for effective management.
- Technological Advancements: Innovations in IoT, AI, and sensor materials enable more accurate, efficient, and cost-effective water quality analysis.
- Industrial Growth and Wastewater Management: Expanding industrial activities generate wastewater requiring strict monitoring to comply with discharge standards.
- Growing Aquaculture and Agriculture Needs: Precision farming and sustainable aquaculture practices demand precise water quality control for optimal yields.
Barriers & Challenges:
- High Initial Investment Costs: The upfront cost of advanced sensor systems and their installation can be a significant barrier for some organizations.
- Calibration and Maintenance Requirements: Ensuring the accuracy of sensors requires regular calibration and maintenance, which can be resource-intensive.
- Sensor Fouling and Drifting: Environmental factors can lead to sensor fouling and signal drift, impacting data reliability and requiring frequent cleaning or replacement.
- Data Interpretation and Integration: Effectively interpreting and integrating vast amounts of sensor data into actionable insights can be complex.
- Harsh Environmental Conditions: Sensors operating in challenging environments (e.g., highly corrosive or high-pressure water) face durability issues.
Emerging Opportunities in Water Quality Monitoring Sensors
Emerging opportunities lie in the development of ultra-low-cost, disposable sensors for widespread deployment in developing regions, addressing critical public health concerns. The integration of AI-powered predictive analytics for early detection of waterborne diseases and contamination events presents a significant growth area. Furthermore, the demand for in-situ, real-time monitoring of microplastics and emerging contaminants (e.g., pharmaceuticals, PFAS) is creating new market niches. The expansion of smart city initiatives and the Internet of Water (IoW) concepts will drive demand for interconnected sensor networks and cloud-based data management platforms.
Growth Accelerators in the Water Quality Monitoring Sensors Industry
Long-term growth in the water quality monitoring sensors industry will be significantly accelerated by breakthroughs in miniaturized, multi-functional sensor arrays, enabling comprehensive analysis from a single device. Strategic partnerships between sensor manufacturers, data analytics firms, and environmental consultancies are fostering integrated solutions. Market expansion strategies focusing on developing economies, where the need for basic water quality monitoring is acute, will also be critical. The increasing adoption of sustainable practices across industries, coupled with evolving consumer demand for transparency in water sources, will continue to fuel innovation and market penetration.
Key Players Shaping the Water Quality Monitoring Sensors Market
- Honeywell
- Thermo Fisher Scientific
- Horiba, Ltd
- Siemens AG
- Emerson
- TSI
- 3M
- Perkinelmer
- Enviro Technology
- Atlas Scientific LLC
- Oakton Instruments
- GE Power
- YSI
- Teledyne-API
- Universtar
- Skyray Instrument
Notable Milestones in Water Quality Monitoring Sensors Sector
- 2019: Introduction of advanced optical sensors with enhanced UV fluorescence for real-time organic matter detection.
- 2020: Launch of IoT-enabled, wireless multi-parameter water quality monitoring systems for remote applications.
- 2021: Significant advancements in sensor miniaturization, enabling integration into portable devices for on-the-go testing.
- 2022: Increased focus on AI integration for predictive analytics in water quality monitoring, anticipating potential contamination events.
- 2023: Development of novel sensor materials for detecting emerging contaminants like PFAS with improved sensitivity.
- 2024: Expansion of cloud-based platforms for centralized data management and analysis of large-scale sensor networks.
In-Depth Water Quality Monitoring Sensors Market Outlook
The future market outlook for water quality monitoring sensors is exceptionally promising, driven by an undeniable global imperative for clean and safe water. Growth accelerators, including rapid technological advancements in AI and IoT integration, coupled with strategic market expansion into underserved regions, will define the coming decade. The industry is on the cusp of a paradigm shift, moving towards predictive, proactive, and highly integrated water management systems. Strategic collaborations and continuous innovation in sensor technology will unlock new applications and further democratize access to reliable water quality data, solidifying the market's trajectory towards significant growth and impact.
Water Quality Monitoring Sensors Segmentation
-
1. Application
- 1.1. Ground and Surface Water
- 1.2. Drinking Water
- 1.3. Waste Water
- 1.4. Aquaculture
- 1.5. Others
-
2. Types
- 2.1. Portable Type
- 2.2. Stationary Type
Water Quality Monitoring Sensors Segmentation By Geography
-
1. North America
- 1.1. United States
- 1.2. Canada
- 1.3. Mexico
-
2. South America
- 2.1. Brazil
- 2.2. Argentina
- 2.3. Rest of South America
-
3. Europe
- 3.1. United Kingdom
- 3.2. Germany
- 3.3. France
- 3.4. Italy
- 3.5. Spain
- 3.6. Russia
- 3.7. Benelux
- 3.8. Nordics
- 3.9. Rest of Europe
-
4. Middle East & Africa
- 4.1. Turkey
- 4.2. Israel
- 4.3. GCC
- 4.4. North Africa
- 4.5. South Africa
- 4.6. Rest of Middle East & Africa
-
5. Asia Pacific
- 5.1. China
- 5.2. India
- 5.3. Japan
- 5.4. South Korea
- 5.5. ASEAN
- 5.6. Oceania
- 5.7. Rest of Asia Pacific
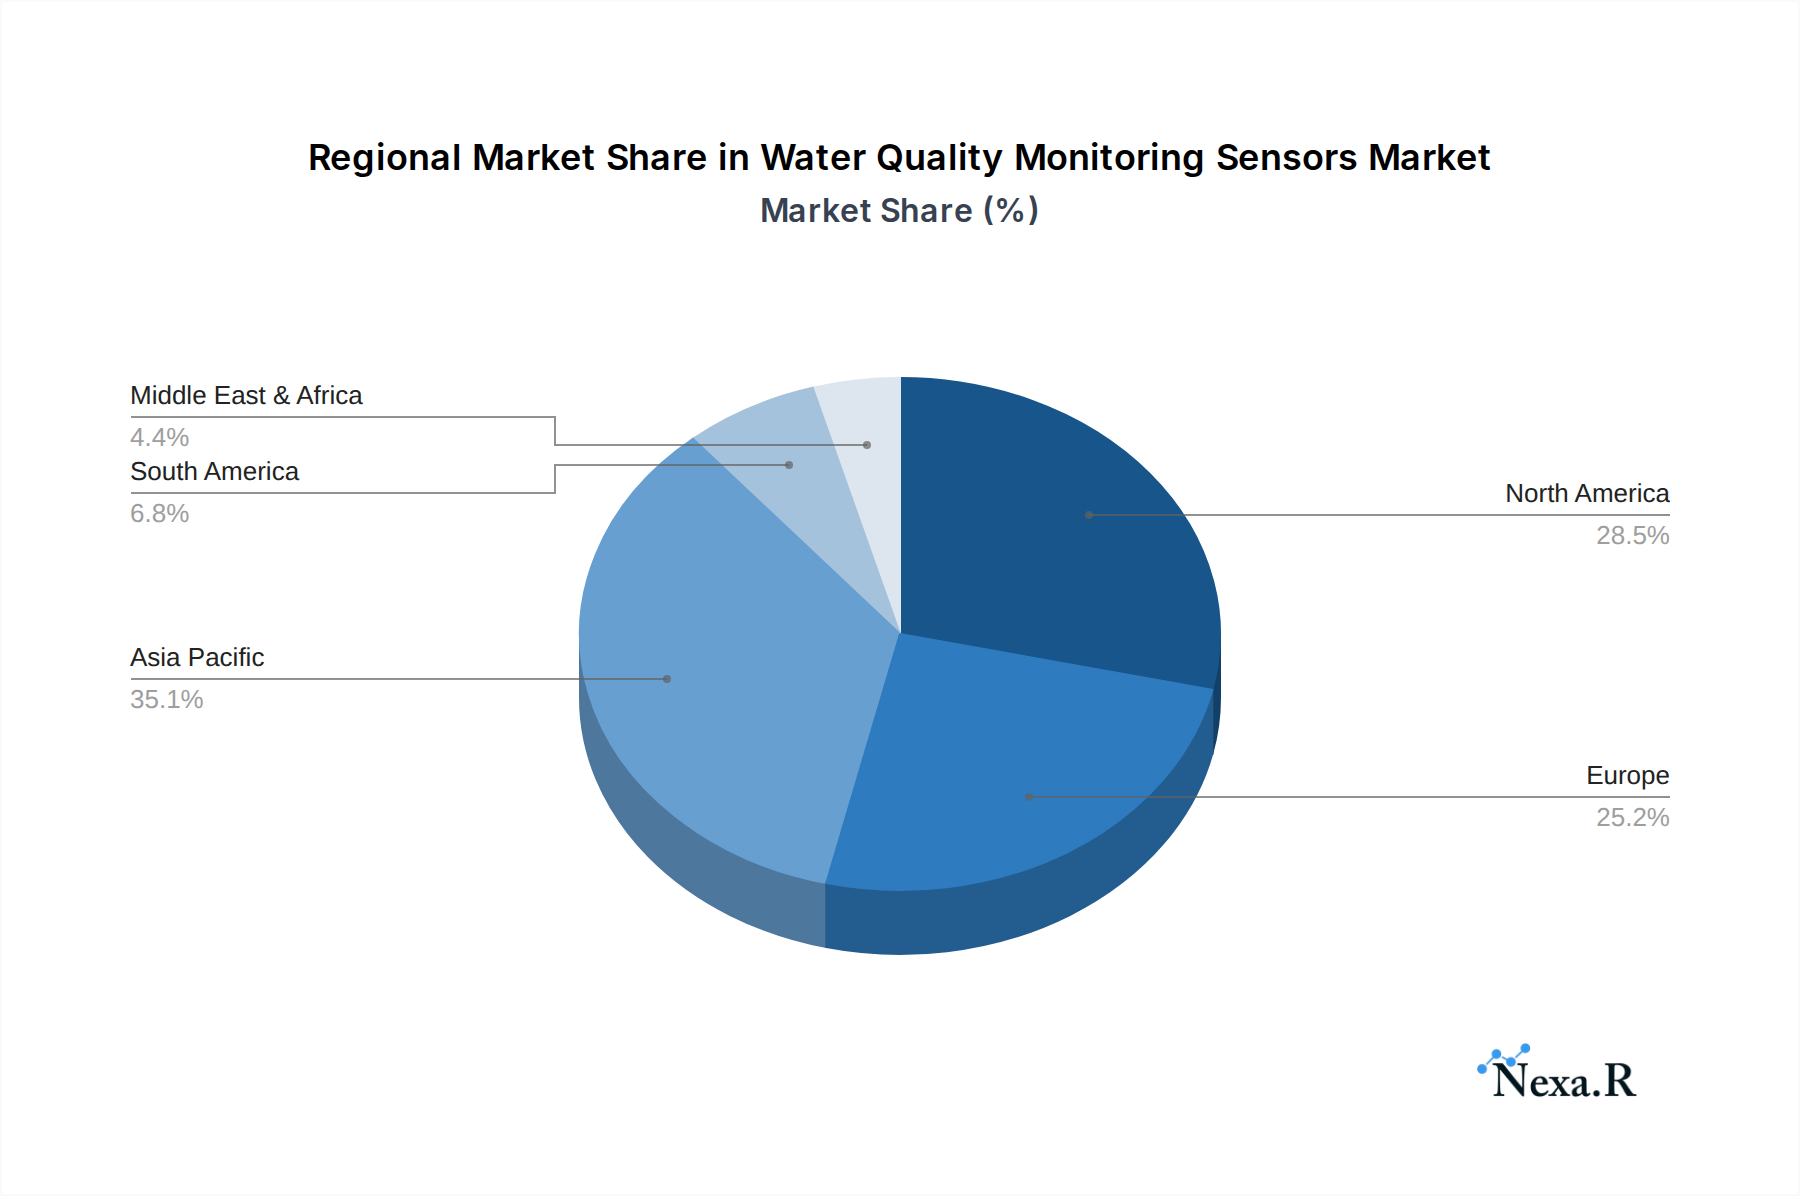
Water Quality Monitoring Sensors Regional Market Share
Geographic Coverage of Water Quality Monitoring Sensors
Water Quality Monitoring Sensors REPORT HIGHLIGHTS
| Aspects | Details |
|---|---|
| Study Period | 2020-2034 |
| Base Year | 2025 |
| Estimated Year | 2026 |
| Forecast Period | 2026-2034 |
| Historical Period | 2020-2025 |
| Growth Rate | CAGR of 6.51% from 2020-2034 |
| Segmentation |
|
Table of Contents
- 1. Introduction
- 1.1. Research Scope
- 1.2. Market Segmentation
- 1.3. Research Objective
- 1.4. Definitions and Assumptions
- 2. Executive Summary
- 2.1. Market Snapshot
- 3. Market Dynamics
- 3.1. Market Drivers
- 3.2. Market Restrains
- 3.3. Market Trends
- 3.4. Market Opportunities
- 4. Market Factor Analysis
- 4.1. Porters Five Forces
- 4.1.1. Bargaining Power of Suppliers
- 4.1.2. Bargaining Power of Buyers
- 4.1.3. Threat of New Entrants
- 4.1.4. Threat of Substitutes
- 4.1.5. Competitive Rivalry
- 4.2. PESTEL analysis
- 4.3. BCG Analysis
- 4.3.1. Stars (High Growth, High Market Share)
- 4.3.2. Cash Cows (Low Growth, High Market Share)
- 4.3.3. Question Mark (High Growth, Low Market Share)
- 4.3.4. Dogs (Low Growth, Low Market Share)
- 4.4. Ansoff Matrix Analysis
- 4.5. Supply Chain Analysis
- 4.6. Regulatory Landscape
- 4.7. Current Market Potential and Opportunity Assessment (TAM–SAM–SOM Framework)
- 4.8. NRP Analyst Note
- 4.1. Porters Five Forces
- 5. Market Analysis, Insights and Forecast 2021-2033
- 5.1. Market Analysis, Insights and Forecast - by Application
- 5.1.1. Ground and Surface Water
- 5.1.2. Drinking Water
- 5.1.3. Waste Water
- 5.1.4. Aquaculture
- 5.1.5. Others
- 5.2. Market Analysis, Insights and Forecast - by Types
- 5.2.1. Portable Type
- 5.2.2. Stationary Type
- 5.3. Market Analysis, Insights and Forecast - by Region
- 5.3.1. North America
- 5.3.2. South America
- 5.3.3. Europe
- 5.3.4. Middle East & Africa
- 5.3.5. Asia Pacific
- 5.1. Market Analysis, Insights and Forecast - by Application
- 6. Global Water Quality Monitoring Sensors Analysis, Insights and Forecast, 2021-2033
- 6.1. Market Analysis, Insights and Forecast - by Application
- 6.1.1. Ground and Surface Water
- 6.1.2. Drinking Water
- 6.1.3. Waste Water
- 6.1.4. Aquaculture
- 6.1.5. Others
- 6.2. Market Analysis, Insights and Forecast - by Types
- 6.2.1. Portable Type
- 6.2.2. Stationary Type
- 6.1. Market Analysis, Insights and Forecast - by Application
- 7. North America Water Quality Monitoring Sensors Analysis, Insights and Forecast, 2020-2032
- 7.1. Market Analysis, Insights and Forecast - by Application
- 7.1.1. Ground and Surface Water
- 7.1.2. Drinking Water
- 7.1.3. Waste Water
- 7.1.4. Aquaculture
- 7.1.5. Others
- 7.2. Market Analysis, Insights and Forecast - by Types
- 7.2.1. Portable Type
- 7.2.2. Stationary Type
- 7.1. Market Analysis, Insights and Forecast - by Application
- 8. South America Water Quality Monitoring Sensors Analysis, Insights and Forecast, 2020-2032
- 8.1. Market Analysis, Insights and Forecast - by Application
- 8.1.1. Ground and Surface Water
- 8.1.2. Drinking Water
- 8.1.3. Waste Water
- 8.1.4. Aquaculture
- 8.1.5. Others
- 8.2. Market Analysis, Insights and Forecast - by Types
- 8.2.1. Portable Type
- 8.2.2. Stationary Type
- 8.1. Market Analysis, Insights and Forecast - by Application
- 9. Europe Water Quality Monitoring Sensors Analysis, Insights and Forecast, 2020-2032
- 9.1. Market Analysis, Insights and Forecast - by Application
- 9.1.1. Ground and Surface Water
- 9.1.2. Drinking Water
- 9.1.3. Waste Water
- 9.1.4. Aquaculture
- 9.1.5. Others
- 9.2. Market Analysis, Insights and Forecast - by Types
- 9.2.1. Portable Type
- 9.2.2. Stationary Type
- 9.1. Market Analysis, Insights and Forecast - by Application
- 10. Middle East & Africa Water Quality Monitoring Sensors Analysis, Insights and Forecast, 2020-2032
- 10.1. Market Analysis, Insights and Forecast - by Application
- 10.1.1. Ground and Surface Water
- 10.1.2. Drinking Water
- 10.1.3. Waste Water
- 10.1.4. Aquaculture
- 10.1.5. Others
- 10.2. Market Analysis, Insights and Forecast - by Types
- 10.2.1. Portable Type
- 10.2.2. Stationary Type
- 10.1. Market Analysis, Insights and Forecast - by Application
- 11. Asia Pacific Water Quality Monitoring Sensors Analysis, Insights and Forecast, 2020-2032
- 11.1. Market Analysis, Insights and Forecast - by Application
- 11.1.1. Ground and Surface Water
- 11.1.2. Drinking Water
- 11.1.3. Waste Water
- 11.1.4. Aquaculture
- 11.1.5. Others
- 11.2. Market Analysis, Insights and Forecast - by Types
- 11.2.1. Portable Type
- 11.2.2. Stationary Type
- 11.1. Market Analysis, Insights and Forecast - by Application
- 12. Competitive Analysis
- 12.1. Company Profiles
- 12.1.1 Honeywell
- 12.1.1.1. Company Overview
- 12.1.1.2. Products
- 12.1.1.3. Company Financials
- 12.1.1.4. SWOT Analysis
- 12.1.2 Thermo Fisher Scientific
- 12.1.2.1. Company Overview
- 12.1.2.2. Products
- 12.1.2.3. Company Financials
- 12.1.2.4. SWOT Analysis
- 12.1.3 Horiba
- 12.1.3.1. Company Overview
- 12.1.3.2. Products
- 12.1.3.3. Company Financials
- 12.1.3.4. SWOT Analysis
- 12.1.4 Ltd
- 12.1.4.1. Company Overview
- 12.1.4.2. Products
- 12.1.4.3. Company Financials
- 12.1.4.4. SWOT Analysis
- 12.1.5 Siemens AG
- 12.1.5.1. Company Overview
- 12.1.5.2. Products
- 12.1.5.3. Company Financials
- 12.1.5.4. SWOT Analysis
- 12.1.6 Emerson
- 12.1.6.1. Company Overview
- 12.1.6.2. Products
- 12.1.6.3. Company Financials
- 12.1.6.4. SWOT Analysis
- 12.1.7 TSI
- 12.1.7.1. Company Overview
- 12.1.7.2. Products
- 12.1.7.3. Company Financials
- 12.1.7.4. SWOT Analysis
- 12.1.8 3M
- 12.1.8.1. Company Overview
- 12.1.8.2. Products
- 12.1.8.3. Company Financials
- 12.1.8.4. SWOT Analysis
- 12.1.9 Perkinelmer
- 12.1.9.1. Company Overview
- 12.1.9.2. Products
- 12.1.9.3. Company Financials
- 12.1.9.4. SWOT Analysis
- 12.1.10 Enviro Technology
- 12.1.10.1. Company Overview
- 12.1.10.2. Products
- 12.1.10.3. Company Financials
- 12.1.10.4. SWOT Analysis
- 12.1.11 Atlas Scientific LLC
- 12.1.11.1. Company Overview
- 12.1.11.2. Products
- 12.1.11.3. Company Financials
- 12.1.11.4. SWOT Analysis
- 12.1.12 Oakton Instruments
- 12.1.12.1. Company Overview
- 12.1.12.2. Products
- 12.1.12.3. Company Financials
- 12.1.12.4. SWOT Analysis
- 12.1.13 GE Power
- 12.1.13.1. Company Overview
- 12.1.13.2. Products
- 12.1.13.3. Company Financials
- 12.1.13.4. SWOT Analysis
- 12.1.14 YSI
- 12.1.14.1. Company Overview
- 12.1.14.2. Products
- 12.1.14.3. Company Financials
- 12.1.14.4. SWOT Analysis
- 12.1.15 Teledyne-API
- 12.1.15.1. Company Overview
- 12.1.15.2. Products
- 12.1.15.3. Company Financials
- 12.1.15.4. SWOT Analysis
- 12.1.16 Universtar
- 12.1.16.1. Company Overview
- 12.1.16.2. Products
- 12.1.16.3. Company Financials
- 12.1.16.4. SWOT Analysis
- 12.1.17 Skyray Instrument
- 12.1.17.1. Company Overview
- 12.1.17.2. Products
- 12.1.17.3. Company Financials
- 12.1.17.4. SWOT Analysis
- 12.1.1 Honeywell
- 12.2. Market Entropy
- 12.2.1 Company's Key Areas Served
- 12.2.2 Recent Developments
- 12.3. Company Market Share Analysis 2025
- 12.3.1 Top 5 Companies Market Share Analysis
- 12.3.2 Top 3 Companies Market Share Analysis
- 12.4. List of Potential Customers
- 13. Research Methodology
List of Figures
- Figure 1: Global Water Quality Monitoring Sensors Revenue Breakdown (billion, %) by Region 2025 & 2033
- Figure 2: North America Water Quality Monitoring Sensors Revenue (billion), by Application 2025 & 2033
- Figure 3: North America Water Quality Monitoring Sensors Revenue Share (%), by Application 2025 & 2033
- Figure 4: North America Water Quality Monitoring Sensors Revenue (billion), by Types 2025 & 2033
- Figure 5: North America Water Quality Monitoring Sensors Revenue Share (%), by Types 2025 & 2033
- Figure 6: North America Water Quality Monitoring Sensors Revenue (billion), by Country 2025 & 2033
- Figure 7: North America Water Quality Monitoring Sensors Revenue Share (%), by Country 2025 & 2033
- Figure 8: South America Water Quality Monitoring Sensors Revenue (billion), by Application 2025 & 2033
- Figure 9: South America Water Quality Monitoring Sensors Revenue Share (%), by Application 2025 & 2033
- Figure 10: South America Water Quality Monitoring Sensors Revenue (billion), by Types 2025 & 2033
- Figure 11: South America Water Quality Monitoring Sensors Revenue Share (%), by Types 2025 & 2033
- Figure 12: South America Water Quality Monitoring Sensors Revenue (billion), by Country 2025 & 2033
- Figure 13: South America Water Quality Monitoring Sensors Revenue Share (%), by Country 2025 & 2033
- Figure 14: Europe Water Quality Monitoring Sensors Revenue (billion), by Application 2025 & 2033
- Figure 15: Europe Water Quality Monitoring Sensors Revenue Share (%), by Application 2025 & 2033
- Figure 16: Europe Water Quality Monitoring Sensors Revenue (billion), by Types 2025 & 2033
- Figure 17: Europe Water Quality Monitoring Sensors Revenue Share (%), by Types 2025 & 2033
- Figure 18: Europe Water Quality Monitoring Sensors Revenue (billion), by Country 2025 & 2033
- Figure 19: Europe Water Quality Monitoring Sensors Revenue Share (%), by Country 2025 & 2033
- Figure 20: Middle East & Africa Water Quality Monitoring Sensors Revenue (billion), by Application 2025 & 2033
- Figure 21: Middle East & Africa Water Quality Monitoring Sensors Revenue Share (%), by Application 2025 & 2033
- Figure 22: Middle East & Africa Water Quality Monitoring Sensors Revenue (billion), by Types 2025 & 2033
- Figure 23: Middle East & Africa Water Quality Monitoring Sensors Revenue Share (%), by Types 2025 & 2033
- Figure 24: Middle East & Africa Water Quality Monitoring Sensors Revenue (billion), by Country 2025 & 2033
- Figure 25: Middle East & Africa Water Quality Monitoring Sensors Revenue Share (%), by Country 2025 & 2033
- Figure 26: Asia Pacific Water Quality Monitoring Sensors Revenue (billion), by Application 2025 & 2033
- Figure 27: Asia Pacific Water Quality Monitoring Sensors Revenue Share (%), by Application 2025 & 2033
- Figure 28: Asia Pacific Water Quality Monitoring Sensors Revenue (billion), by Types 2025 & 2033
- Figure 29: Asia Pacific Water Quality Monitoring Sensors Revenue Share (%), by Types 2025 & 2033
- Figure 30: Asia Pacific Water Quality Monitoring Sensors Revenue (billion), by Country 2025 & 2033
- Figure 31: Asia Pacific Water Quality Monitoring Sensors Revenue Share (%), by Country 2025 & 2033
List of Tables
- Table 1: Global Water Quality Monitoring Sensors Revenue billion Forecast, by Application 2020 & 2033
- Table 2: Global Water Quality Monitoring Sensors Revenue billion Forecast, by Types 2020 & 2033
- Table 3: Global Water Quality Monitoring Sensors Revenue billion Forecast, by Region 2020 & 2033
- Table 4: Global Water Quality Monitoring Sensors Revenue billion Forecast, by Application 2020 & 2033
- Table 5: Global Water Quality Monitoring Sensors Revenue billion Forecast, by Types 2020 & 2033
- Table 6: Global Water Quality Monitoring Sensors Revenue billion Forecast, by Country 2020 & 2033
- Table 7: United States Water Quality Monitoring Sensors Revenue (billion) Forecast, by Application 2020 & 2033
- Table 8: Canada Water Quality Monitoring Sensors Revenue (billion) Forecast, by Application 2020 & 2033
- Table 9: Mexico Water Quality Monitoring Sensors Revenue (billion) Forecast, by Application 2020 & 2033
- Table 10: Global Water Quality Monitoring Sensors Revenue billion Forecast, by Application 2020 & 2033
- Table 11: Global Water Quality Monitoring Sensors Revenue billion Forecast, by Types 2020 & 2033
- Table 12: Global Water Quality Monitoring Sensors Revenue billion Forecast, by Country 2020 & 2033
- Table 13: Brazil Water Quality Monitoring Sensors Revenue (billion) Forecast, by Application 2020 & 2033
- Table 14: Argentina Water Quality Monitoring Sensors Revenue (billion) Forecast, by Application 2020 & 2033
- Table 15: Rest of South America Water Quality Monitoring Sensors Revenue (billion) Forecast, by Application 2020 & 2033
- Table 16: Global Water Quality Monitoring Sensors Revenue billion Forecast, by Application 2020 & 2033
- Table 17: Global Water Quality Monitoring Sensors Revenue billion Forecast, by Types 2020 & 2033
- Table 18: Global Water Quality Monitoring Sensors Revenue billion Forecast, by Country 2020 & 2033
- Table 19: United Kingdom Water Quality Monitoring Sensors Revenue (billion) Forecast, by Application 2020 & 2033
- Table 20: Germany Water Quality Monitoring Sensors Revenue (billion) Forecast, by Application 2020 & 2033
- Table 21: France Water Quality Monitoring Sensors Revenue (billion) Forecast, by Application 2020 & 2033
- Table 22: Italy Water Quality Monitoring Sensors Revenue (billion) Forecast, by Application 2020 & 2033
- Table 23: Spain Water Quality Monitoring Sensors Revenue (billion) Forecast, by Application 2020 & 2033
- Table 24: Russia Water Quality Monitoring Sensors Revenue (billion) Forecast, by Application 2020 & 2033
- Table 25: Benelux Water Quality Monitoring Sensors Revenue (billion) Forecast, by Application 2020 & 2033
- Table 26: Nordics Water Quality Monitoring Sensors Revenue (billion) Forecast, by Application 2020 & 2033
- Table 27: Rest of Europe Water Quality Monitoring Sensors Revenue (billion) Forecast, by Application 2020 & 2033
- Table 28: Global Water Quality Monitoring Sensors Revenue billion Forecast, by Application 2020 & 2033
- Table 29: Global Water Quality Monitoring Sensors Revenue billion Forecast, by Types 2020 & 2033
- Table 30: Global Water Quality Monitoring Sensors Revenue billion Forecast, by Country 2020 & 2033
- Table 31: Turkey Water Quality Monitoring Sensors Revenue (billion) Forecast, by Application 2020 & 2033
- Table 32: Israel Water Quality Monitoring Sensors Revenue (billion) Forecast, by Application 2020 & 2033
- Table 33: GCC Water Quality Monitoring Sensors Revenue (billion) Forecast, by Application 2020 & 2033
- Table 34: North Africa Water Quality Monitoring Sensors Revenue (billion) Forecast, by Application 2020 & 2033
- Table 35: South Africa Water Quality Monitoring Sensors Revenue (billion) Forecast, by Application 2020 & 2033
- Table 36: Rest of Middle East & Africa Water Quality Monitoring Sensors Revenue (billion) Forecast, by Application 2020 & 2033
- Table 37: Global Water Quality Monitoring Sensors Revenue billion Forecast, by Application 2020 & 2033
- Table 38: Global Water Quality Monitoring Sensors Revenue billion Forecast, by Types 2020 & 2033
- Table 39: Global Water Quality Monitoring Sensors Revenue billion Forecast, by Country 2020 & 2033
- Table 40: China Water Quality Monitoring Sensors Revenue (billion) Forecast, by Application 2020 & 2033
- Table 41: India Water Quality Monitoring Sensors Revenue (billion) Forecast, by Application 2020 & 2033
- Table 42: Japan Water Quality Monitoring Sensors Revenue (billion) Forecast, by Application 2020 & 2033
- Table 43: South Korea Water Quality Monitoring Sensors Revenue (billion) Forecast, by Application 2020 & 2033
- Table 44: ASEAN Water Quality Monitoring Sensors Revenue (billion) Forecast, by Application 2020 & 2033
- Table 45: Oceania Water Quality Monitoring Sensors Revenue (billion) Forecast, by Application 2020 & 2033
- Table 46: Rest of Asia Pacific Water Quality Monitoring Sensors Revenue (billion) Forecast, by Application 2020 & 2033
Frequently Asked Questions
1. What is the projected Compound Annual Growth Rate (CAGR) of the Water Quality Monitoring Sensors?
The projected CAGR is approximately 6.51%.
2. Which companies are prominent players in the Water Quality Monitoring Sensors?
Key companies in the market include Honeywell, Thermo Fisher Scientific, Horiba, Ltd, Siemens AG, Emerson, TSI, 3M, Perkinelmer, Enviro Technology, Atlas Scientific LLC, Oakton Instruments, GE Power, YSI, Teledyne-API, Universtar, Skyray Instrument.
3. What are the main segments of the Water Quality Monitoring Sensors?
The market segments include Application, Types.
4. Can you provide details about the market size?
The market size is estimated to be USD 5.72 billion as of 2022.
5. What are some drivers contributing to market growth?
N/A
6. What are the notable trends driving market growth?
N/A
7. Are there any restraints impacting market growth?
N/A
8. Can you provide examples of recent developments in the market?
N/A
9. What pricing options are available for accessing the report?
Pricing options include single-user, multi-user, and enterprise licenses priced at USD 2900.00, USD 4350.00, and USD 5800.00 respectively.
10. Is the market size provided in terms of value or volume?
The market size is provided in terms of value, measured in billion.
11. Are there any specific market keywords associated with the report?
Yes, the market keyword associated with the report is "Water Quality Monitoring Sensors," which aids in identifying and referencing the specific market segment covered.
12. How do I determine which pricing option suits my needs best?
The pricing options vary based on user requirements and access needs. Individual users may opt for single-user licenses, while businesses requiring broader access may choose multi-user or enterprise licenses for cost-effective access to the report.
13. Are there any additional resources or data provided in the Water Quality Monitoring Sensors report?
While the report offers comprehensive insights, it's advisable to review the specific contents or supplementary materials provided to ascertain if additional resources or data are available.
14. How can I stay updated on further developments or reports in the Water Quality Monitoring Sensors?
To stay informed about further developments, trends, and reports in the Water Quality Monitoring Sensors, consider subscribing to industry newsletters, following relevant companies and organizations, or regularly checking reputable industry news sources and publications.
Methodology
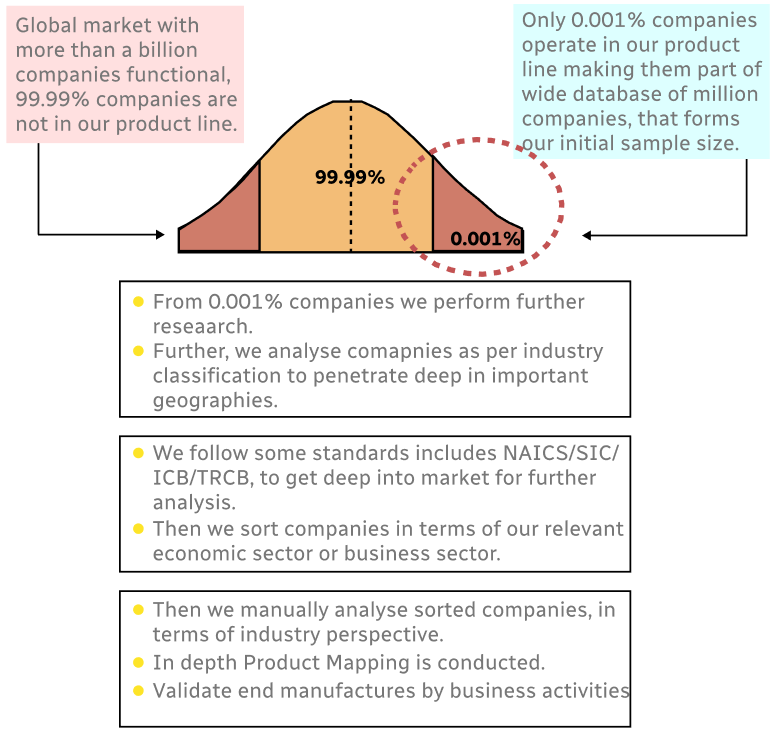
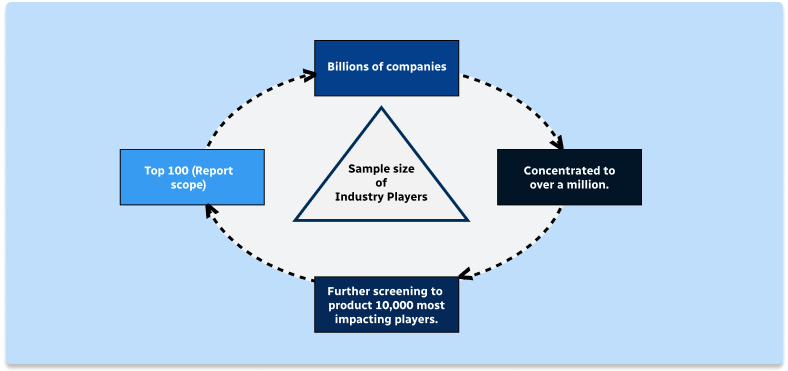
Step 1 - Identification of Relevant Samples Size from Population Database
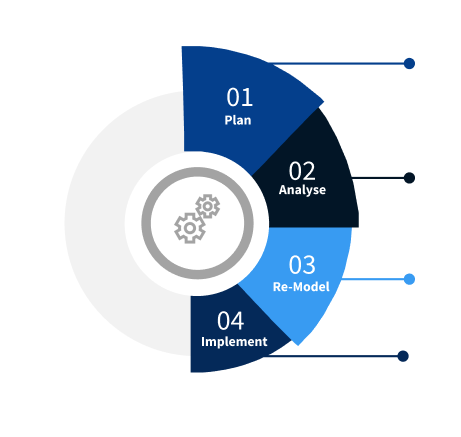
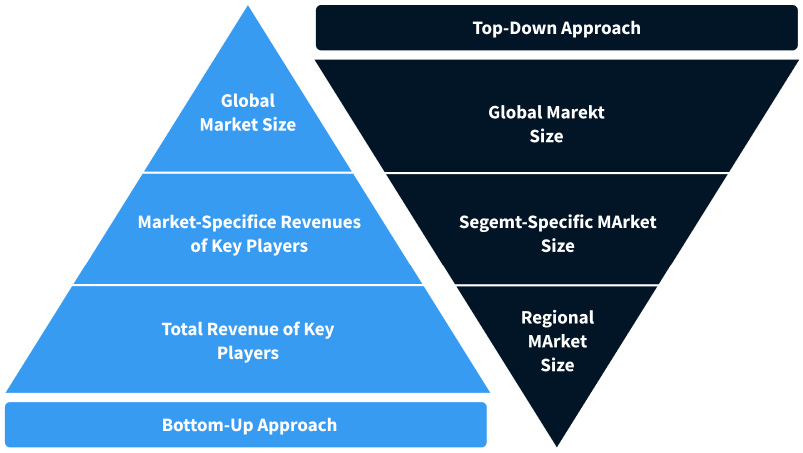
Step 2 - Approaches for Defining Global Market Size (Value, Volume* & Price*)
Note*: In applicable scenarios
Step 3 - Data Sources
Primary Research
- Web Analytics
- Survey Reports
- Research Institute
- Latest Research Reports
- Opinion Leaders
Secondary Research
- Annual Reports
- White Paper
- Latest Press Release
- Industry Association
- Paid Database
- Investor Presentations
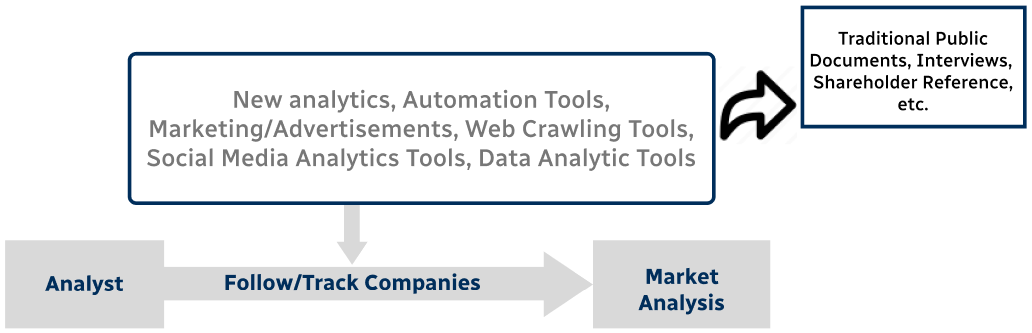
Step 4 - Data Triangulation
Involves using different sources of information in order to increase the validity of a study
These sources are likely to be stakeholders in a program - participants, other researchers, program staff, other community members, and so on.
Then we put all data in single framework & apply various statistical tools to find out the dynamic on the market.
During the analysis stage, feedback from the stakeholder groups would be compared to determine areas of agreement as well as areas of divergence