

Key Insights
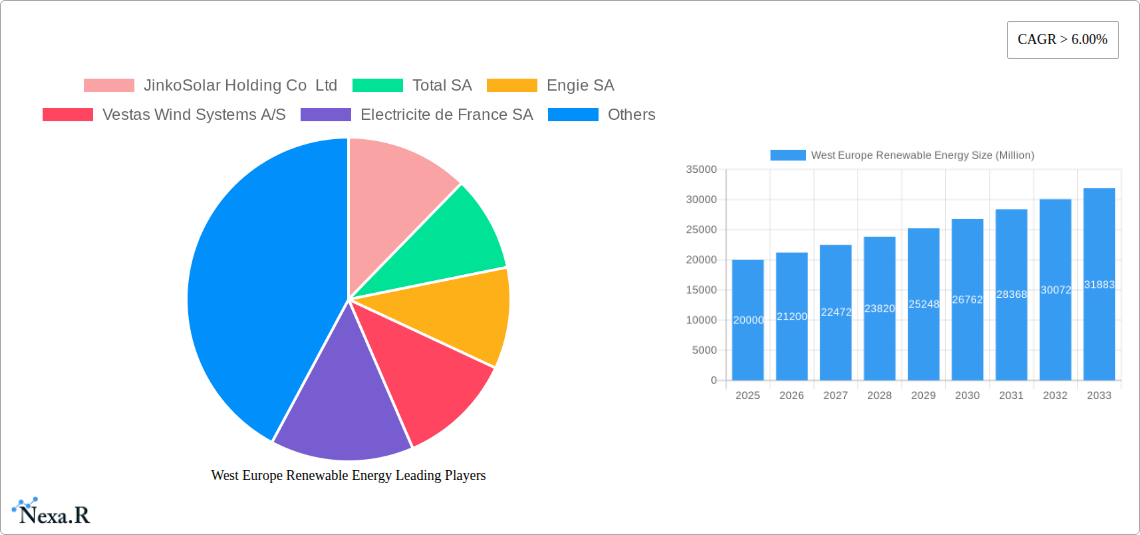
The West European renewable energy market is experiencing robust growth, driven by stringent environmental regulations, increasing energy security concerns, and supportive government policies promoting sustainable energy sources. A compound annual growth rate (CAGR) exceeding 6% from 2025 to 2033 points to a significant expansion. This growth is fueled by substantial investments in solar, wind, and bioenergy projects across the region. Germany, the UK, and France are leading the market, benefiting from established infrastructure and advanced technological capabilities. However, challenges remain, including the intermittent nature of renewable energy sources requiring robust grid infrastructure upgrades and energy storage solutions. Furthermore, land availability for large-scale projects and permitting processes can pose limitations.
Despite these constraints, the market is expected to witness sustained expansion. The diversification of renewable energy sources, including the integration of innovative technologies like offshore wind farms and advanced bioenergy solutions, will further accelerate market growth. The increasing competitiveness of renewable energy compared to fossil fuels, driven by technological advancements and falling production costs, is another key factor underpinning this positive trajectory. Specific growth within segments will vary, with offshore wind likely exhibiting particularly strong growth given the substantial investment and potential for large-scale deployment. The market's future hinges on continuous technological innovation, supportive policy frameworks, and effective grid modernization to seamlessly integrate renewable energy into the existing energy infrastructure.
West Europe Renewable Energy Market Report: 2019-2033
This comprehensive report provides an in-depth analysis of the West Europe renewable energy market, covering the period 2019-2033. It offers crucial insights into market dynamics, growth trends, key players, and future opportunities, empowering businesses to make strategic decisions in this rapidly evolving sector. The report segments the market by source (Solar, Wind, Bioenergy, Other Sources) and geography (The United Kingdom, Germany, France, Ireland, Rest of West Europe), providing granular data for informed planning. This report utilizes data up to 2024 and includes a forecast period of 2025-2033.
West Europe Renewable Energy Market Dynamics & Structure
The West European renewable energy market is characterized by increasing market concentration, driven by mergers and acquisitions (M&A) activity and the dominance of a few large players. Technological innovation, particularly in offshore wind and solar PV efficiency, is a key driver, alongside supportive regulatory frameworks promoting renewable energy integration. Competitive pressures from fossil fuels remain, but are increasingly offset by cost reductions in renewables and stringent environmental regulations.
- Market Concentration: The market is moderately concentrated, with the top 5 players holding approximately xx% of the market share in 2024 (estimated).
- M&A Activity: An estimated xx million USD worth of M&A deals were closed in the renewable energy sector in West Europe between 2019 and 2024.
- Technological Innovation: Key innovations include advancements in wind turbine technology (e.g., floating offshore wind), increased efficiency in solar PV panels, and improved energy storage solutions.
- Regulatory Framework: Government policies including feed-in tariffs, renewable portfolio standards, and carbon pricing mechanisms significantly influence market growth.
- Competitive Substitutes: Fossil fuels (coal, natural gas) remain significant competitors but face increasing pressure from declining renewable energy costs and environmental concerns.
- End-User Demographics: The primary end-users are utilities, industrial consumers, and residential households. Shifting consumer preferences towards sustainability are boosting demand for renewable energy sources.
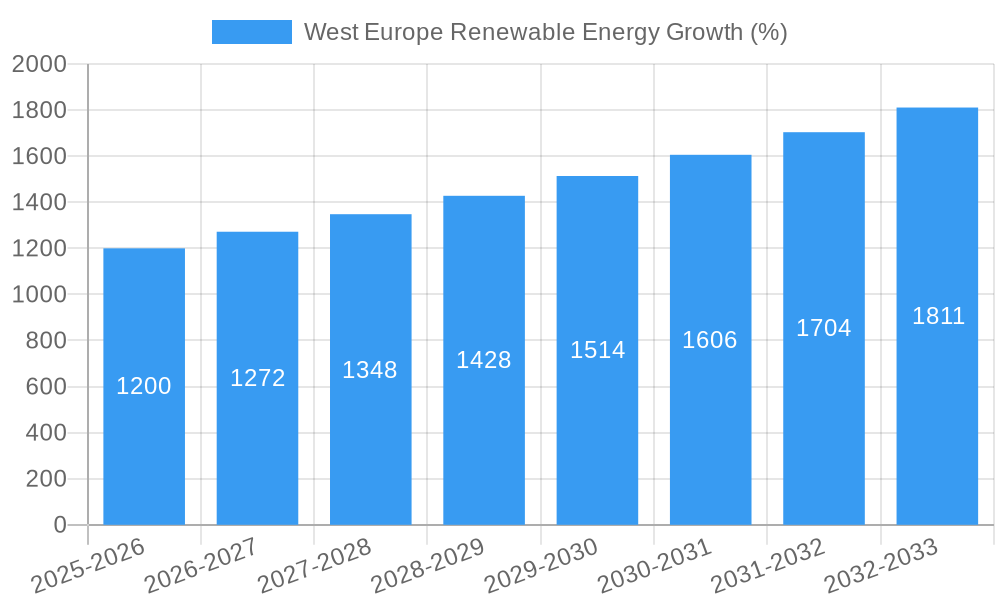
West Europe Renewable Energy Growth Trends & Insights
The West European renewable energy market exhibited robust growth during the historical period (2019-2024), with a Compound Annual Growth Rate (CAGR) of xx%. This growth is attributed to factors including supportive government policies, declining renewable energy costs, and increasing public awareness of climate change. The market is expected to maintain a significant growth trajectory during the forecast period (2025-2033), driven by continued technological advancements, supportive regulatory frameworks, and increasing energy security concerns. Market penetration increased from xx% in 2019 to xx% in 2024, and is projected to reach xx% by 2033. Technological disruptions, such as the emergence of more efficient solar panels and larger-scale wind farms, will continue to shape the market landscape, influencing adoption rates and consumer behavior.
Dominant Regions, Countries, or Segments in West Europe Renewable Energy
Germany and the UK remain the dominant markets in West Europe for renewable energy, primarily driven by strong government support, existing infrastructure, and a large consumer base. However, France is experiencing rapid growth, particularly in offshore wind. Within the source segments, wind energy currently holds the largest share, closely followed by solar.
- Germany: Strong historical investment in renewables and supportive policies continue to fuel growth. Key drivers include grid infrastructure and strong public acceptance.
- UK: Significant offshore wind capacity expansion, along with robust solar and onshore wind development.
- France: Significant investments in offshore wind and solar, particularly the recent developments outlined in the "Notable Milestones" section.
- Wind Energy: The dominant renewable energy source, benefitting from economies of scale and technological advancements.
- Solar Energy: Experiencing rapid growth, particularly in residential and commercial sectors.
- Bioenergy: Holds a smaller but consistent market share, largely driven by supportive policies and sustainability initiatives.
West Europe Renewable Energy Product Landscape
The renewable energy product landscape is characterized by continuous innovation, with advancements in solar panel efficiency, larger wind turbine designs, and improved energy storage technologies. This leads to increased output, reduced costs, and improved grid integration capabilities. Manufacturers are focusing on enhancing the efficiency, durability, and lifespan of their products while seeking to reduce manufacturing costs and environmental impact.
Key Drivers, Barriers & Challenges in West Europe Renewable Energy
Key Drivers:
- Declining costs of renewable energy technologies.
- Stringent environmental regulations and carbon reduction targets.
- Government incentives and support schemes (e.g., subsidies, tax breaks).
- Increasing energy security concerns.
Challenges:
- Intermittency of renewable energy sources requiring reliable energy storage solutions.
- Grid infrastructure limitations hindering efficient integration of renewables.
- Permitting and regulatory processes can create delays in project implementation. This includes the complexities of securing planning approvals for large-scale wind and solar farms.
- Supply chain disruptions impacting the availability and cost of crucial components.
Emerging Opportunities in West Europe Renewable Energy
- Growing demand for renewable energy in transportation and heating sectors.
- Increased adoption of hybrid energy solutions combining different renewable sources.
- Expansion into untapped markets, such as remote and rural areas.
- Development of smart grids enabling better integration and management of renewable energy sources.
Growth Accelerators in the West Europe Renewable Energy Industry
Technological advancements in energy storage, along with the development of smart grid technologies, will be key to accelerating growth. Strategic partnerships between energy companies, technology providers, and policymakers will also play a critical role in unlocking the full potential of the West European renewable energy market. Further investments in grid infrastructure are essential to facilitate the seamless integration of large-scale renewable energy projects.
Key Players Shaping the West Europe Renewable Energy Market
- JinkoSolar Holding Co Ltd
- Total SA
- Engie SA
- Vestas Wind Systems A/S
- Electricite de France SA
- Siemens Gamesa Renewable Energy SA
- Renewable Energy Systems Ltd
- Ecotricity Group Ltd
- General Electric Company
Notable Milestones in West Europe Renewable Energy Sector
- December 2022: France launched tenders for two new offshore wind farms with a total capacity of 2.5 GW.
- April 2022: Voltalia began constructing the 3.7 MW Montclar solar power plant in France.
In-Depth West Europe Renewable Energy Market Outlook
The West European renewable energy market is poised for continued strong growth over the next decade, driven by a confluence of factors including supportive government policies, technological advancements, and growing environmental concerns. Strategic partnerships, investments in infrastructure, and the development of innovative solutions will be crucial in shaping the market's future and unlocking its full potential. The focus will increasingly be on integrating renewables seamlessly into the energy mix, ensuring grid stability and maximizing efficiency.
West Europe Renewable Energy Segmentation
-
1. Source
- 1.1. Solar
- 1.2. Wind
- 1.3. Bioenergy
- 1.4. Other Sources
-
2. Geogrpahy
- 2.1. The United Kingdom
- 2.2. Germany
- 2.3. France
- 2.4. Ireland
- 2.5. Rest of West Europe
West Europe Renewable Energy Segmentation By Geography
-
1. North America
- 1.1. United States
- 1.2. Canada
- 1.3. Mexico
-
2. South America
- 2.1. Brazil
- 2.2. Argentina
- 2.3. Rest of South America
-
3. Europe
- 3.1. United Kingdom
- 3.2. Germany
- 3.3. France
- 3.4. Italy
- 3.5. Spain
- 3.6. Russia
- 3.7. Benelux
- 3.8. Nordics
- 3.9. Rest of Europe
-
4. Middle East & Africa
- 4.1. Turkey
- 4.2. Israel
- 4.3. GCC
- 4.4. North Africa
- 4.5. South Africa
- 4.6. Rest of Middle East & Africa
-
5. Asia Pacific
- 5.1. China
- 5.2. India
- 5.3. Japan
- 5.4. South Korea
- 5.5. ASEAN
- 5.6. Oceania
- 5.7. Rest of Asia Pacific

West Europe Renewable Energy REPORT HIGHLIGHTS
| Aspects | Details |
|---|---|
| Study Period | 2019-2033 |
| Base Year | 2024 |
| Estimated Year | 2025 |
| Forecast Period | 2025-2033 |
| Historical Period | 2019-2024 |
| Growth Rate | CAGR of > 6.00% from 2019-2033 |
| Segmentation |
|
Table of Contents
- 1. Introduction
- 1.1. Research Scope
- 1.2. Market Segmentation
- 1.3. Research Methodology
- 1.4. Definitions and Assumptions
- 2. Executive Summary
- 2.1. Introduction
- 3. Market Dynamics
- 3.1. Introduction
- 3.2. Market Drivers
- 3.2.1. 4.; Demand for Solar Photovoltaic Installations4.; Growing Investments
- 3.3. Market Restrains
- 3.3.1. 4.; Increasing Wind Energy Installations
- 3.4. Market Trends
- 3.4.1. Wind Energy to Witness Significant Growth
- 4. Market Factor Analysis
- 4.1. Porters Five Forces
- 4.2. Supply/Value Chain
- 4.3. PESTEL analysis
- 4.4. Market Entropy
- 4.5. Patent/Trademark Analysis
- 5. Global West Europe Renewable Energy Analysis, Insights and Forecast, 2019-2031
- 5.1. Market Analysis, Insights and Forecast - by Source
- 5.1.1. Solar
- 5.1.2. Wind
- 5.1.3. Bioenergy
- 5.1.4. Other Sources
- 5.2. Market Analysis, Insights and Forecast - by Geogrpahy
- 5.2.1. The United Kingdom
- 5.2.2. Germany
- 5.2.3. France
- 5.2.4. Ireland
- 5.2.5. Rest of West Europe
- 5.3. Market Analysis, Insights and Forecast - by Region
- 5.3.1. North America
- 5.3.2. South America
- 5.3.3. Europe
- 5.3.4. Middle East & Africa
- 5.3.5. Asia Pacific
- 5.1. Market Analysis, Insights and Forecast - by Source
- 6. North America West Europe Renewable Energy Analysis, Insights and Forecast, 2019-2031
- 6.1. Market Analysis, Insights and Forecast - by Source
- 6.1.1. Solar
- 6.1.2. Wind
- 6.1.3. Bioenergy
- 6.1.4. Other Sources
- 6.2. Market Analysis, Insights and Forecast - by Geogrpahy
- 6.2.1. The United Kingdom
- 6.2.2. Germany
- 6.2.3. France
- 6.2.4. Ireland
- 6.2.5. Rest of West Europe
- 6.1. Market Analysis, Insights and Forecast - by Source
- 7. South America West Europe Renewable Energy Analysis, Insights and Forecast, 2019-2031
- 7.1. Market Analysis, Insights and Forecast - by Source
- 7.1.1. Solar
- 7.1.2. Wind
- 7.1.3. Bioenergy
- 7.1.4. Other Sources
- 7.2. Market Analysis, Insights and Forecast - by Geogrpahy
- 7.2.1. The United Kingdom
- 7.2.2. Germany
- 7.2.3. France
- 7.2.4. Ireland
- 7.2.5. Rest of West Europe
- 7.1. Market Analysis, Insights and Forecast - by Source
- 8. Europe West Europe Renewable Energy Analysis, Insights and Forecast, 2019-2031
- 8.1. Market Analysis, Insights and Forecast - by Source
- 8.1.1. Solar
- 8.1.2. Wind
- 8.1.3. Bioenergy
- 8.1.4. Other Sources
- 8.2. Market Analysis, Insights and Forecast - by Geogrpahy
- 8.2.1. The United Kingdom
- 8.2.2. Germany
- 8.2.3. France
- 8.2.4. Ireland
- 8.2.5. Rest of West Europe
- 8.1. Market Analysis, Insights and Forecast - by Source
- 9. Middle East & Africa West Europe Renewable Energy Analysis, Insights and Forecast, 2019-2031
- 9.1. Market Analysis, Insights and Forecast - by Source
- 9.1.1. Solar
- 9.1.2. Wind
- 9.1.3. Bioenergy
- 9.1.4. Other Sources
- 9.2. Market Analysis, Insights and Forecast - by Geogrpahy
- 9.2.1. The United Kingdom
- 9.2.2. Germany
- 9.2.3. France
- 9.2.4. Ireland
- 9.2.5. Rest of West Europe
- 9.1. Market Analysis, Insights and Forecast - by Source
- 10. Asia Pacific West Europe Renewable Energy Analysis, Insights and Forecast, 2019-2031
- 10.1. Market Analysis, Insights and Forecast - by Source
- 10.1.1. Solar
- 10.1.2. Wind
- 10.1.3. Bioenergy
- 10.1.4. Other Sources
- 10.2. Market Analysis, Insights and Forecast - by Geogrpahy
- 10.2.1. The United Kingdom
- 10.2.2. Germany
- 10.2.3. France
- 10.2.4. Ireland
- 10.2.5. Rest of West Europe
- 10.1. Market Analysis, Insights and Forecast - by Source
- 11. Germany West Europe Renewable Energy Analysis, Insights and Forecast, 2019-2031
- 12. France West Europe Renewable Energy Analysis, Insights and Forecast, 2019-2031
- 13. Italy West Europe Renewable Energy Analysis, Insights and Forecast, 2019-2031
- 14. United Kingdom West Europe Renewable Energy Analysis, Insights and Forecast, 2019-2031
- 15. Netherlands West Europe Renewable Energy Analysis, Insights and Forecast, 2019-2031
- 16. Sweden West Europe Renewable Energy Analysis, Insights and Forecast, 2019-2031
- 17. Rest of Europe West Europe Renewable Energy Analysis, Insights and Forecast, 2019-2031
- 18. Competitive Analysis
- 18.1. Global Market Share Analysis 2024
- 18.2. Company Profiles
- 18.2.1 JinkoSolar Holding Co Ltd
- 18.2.1.1. Overview
- 18.2.1.2. Products
- 18.2.1.3. SWOT Analysis
- 18.2.1.4. Recent Developments
- 18.2.1.5. Financials (Based on Availability)
- 18.2.2 Total SA
- 18.2.2.1. Overview
- 18.2.2.2. Products
- 18.2.2.3. SWOT Analysis
- 18.2.2.4. Recent Developments
- 18.2.2.5. Financials (Based on Availability)
- 18.2.3 Engie SA
- 18.2.3.1. Overview
- 18.2.3.2. Products
- 18.2.3.3. SWOT Analysis
- 18.2.3.4. Recent Developments
- 18.2.3.5. Financials (Based on Availability)
- 18.2.4 Vestas Wind Systems A/S
- 18.2.4.1. Overview
- 18.2.4.2. Products
- 18.2.4.3. SWOT Analysis
- 18.2.4.4. Recent Developments
- 18.2.4.5. Financials (Based on Availability)
- 18.2.5 Electricite de France SA
- 18.2.5.1. Overview
- 18.2.5.2. Products
- 18.2.5.3. SWOT Analysis
- 18.2.5.4. Recent Developments
- 18.2.5.5. Financials (Based on Availability)
- 18.2.6 Siemens Gamesa Renewable Energy SA
- 18.2.6.1. Overview
- 18.2.6.2. Products
- 18.2.6.3. SWOT Analysis
- 18.2.6.4. Recent Developments
- 18.2.6.5. Financials (Based on Availability)
- 18.2.7 Renewable Energy Systems Ltd
- 18.2.7.1. Overview
- 18.2.7.2. Products
- 18.2.7.3. SWOT Analysis
- 18.2.7.4. Recent Developments
- 18.2.7.5. Financials (Based on Availability)
- 18.2.8 Ecotricity Group Ltd
- 18.2.8.1. Overview
- 18.2.8.2. Products
- 18.2.8.3. SWOT Analysis
- 18.2.8.4. Recent Developments
- 18.2.8.5. Financials (Based on Availability)
- 18.2.9 General Electric Company
- 18.2.9.1. Overview
- 18.2.9.2. Products
- 18.2.9.3. SWOT Analysis
- 18.2.9.4. Recent Developments
- 18.2.9.5. Financials (Based on Availability)
- 18.2.1 JinkoSolar Holding Co Ltd
List of Figures
- Figure 1: Global West Europe Renewable Energy Revenue Breakdown (Million, %) by Region 2024 & 2032
- Figure 2: Global West Europe Renewable Energy Volume Breakdown (Gigawatte, %) by Region 2024 & 2032
- Figure 3: Europe West Europe Renewable Energy Revenue (Million), by Country 2024 & 2032
- Figure 4: Europe West Europe Renewable Energy Volume (Gigawatte), by Country 2024 & 2032
- Figure 5: Europe West Europe Renewable Energy Revenue Share (%), by Country 2024 & 2032
- Figure 6: Europe West Europe Renewable Energy Volume Share (%), by Country 2024 & 2032
- Figure 7: North America West Europe Renewable Energy Revenue (Million), by Source 2024 & 2032
- Figure 8: North America West Europe Renewable Energy Volume (Gigawatte), by Source 2024 & 2032
- Figure 9: North America West Europe Renewable Energy Revenue Share (%), by Source 2024 & 2032
- Figure 10: North America West Europe Renewable Energy Volume Share (%), by Source 2024 & 2032
- Figure 11: North America West Europe Renewable Energy Revenue (Million), by Geogrpahy 2024 & 2032
- Figure 12: North America West Europe Renewable Energy Volume (Gigawatte), by Geogrpahy 2024 & 2032
- Figure 13: North America West Europe Renewable Energy Revenue Share (%), by Geogrpahy 2024 & 2032
- Figure 14: North America West Europe Renewable Energy Volume Share (%), by Geogrpahy 2024 & 2032
- Figure 15: North America West Europe Renewable Energy Revenue (Million), by Country 2024 & 2032
- Figure 16: North America West Europe Renewable Energy Volume (Gigawatte), by Country 2024 & 2032
- Figure 17: North America West Europe Renewable Energy Revenue Share (%), by Country 2024 & 2032
- Figure 18: North America West Europe Renewable Energy Volume Share (%), by Country 2024 & 2032
- Figure 19: South America West Europe Renewable Energy Revenue (Million), by Source 2024 & 2032
- Figure 20: South America West Europe Renewable Energy Volume (Gigawatte), by Source 2024 & 2032
- Figure 21: South America West Europe Renewable Energy Revenue Share (%), by Source 2024 & 2032
- Figure 22: South America West Europe Renewable Energy Volume Share (%), by Source 2024 & 2032
- Figure 23: South America West Europe Renewable Energy Revenue (Million), by Geogrpahy 2024 & 2032
- Figure 24: South America West Europe Renewable Energy Volume (Gigawatte), by Geogrpahy 2024 & 2032
- Figure 25: South America West Europe Renewable Energy Revenue Share (%), by Geogrpahy 2024 & 2032
- Figure 26: South America West Europe Renewable Energy Volume Share (%), by Geogrpahy 2024 & 2032
- Figure 27: South America West Europe Renewable Energy Revenue (Million), by Country 2024 & 2032
- Figure 28: South America West Europe Renewable Energy Volume (Gigawatte), by Country 2024 & 2032
- Figure 29: South America West Europe Renewable Energy Revenue Share (%), by Country 2024 & 2032
- Figure 30: South America West Europe Renewable Energy Volume Share (%), by Country 2024 & 2032
- Figure 31: Europe West Europe Renewable Energy Revenue (Million), by Source 2024 & 2032
- Figure 32: Europe West Europe Renewable Energy Volume (Gigawatte), by Source 2024 & 2032
- Figure 33: Europe West Europe Renewable Energy Revenue Share (%), by Source 2024 & 2032
- Figure 34: Europe West Europe Renewable Energy Volume Share (%), by Source 2024 & 2032
- Figure 35: Europe West Europe Renewable Energy Revenue (Million), by Geogrpahy 2024 & 2032
- Figure 36: Europe West Europe Renewable Energy Volume (Gigawatte), by Geogrpahy 2024 & 2032
- Figure 37: Europe West Europe Renewable Energy Revenue Share (%), by Geogrpahy 2024 & 2032
- Figure 38: Europe West Europe Renewable Energy Volume Share (%), by Geogrpahy 2024 & 2032
- Figure 39: Europe West Europe Renewable Energy Revenue (Million), by Country 2024 & 2032
- Figure 40: Europe West Europe Renewable Energy Volume (Gigawatte), by Country 2024 & 2032
- Figure 41: Europe West Europe Renewable Energy Revenue Share (%), by Country 2024 & 2032
- Figure 42: Europe West Europe Renewable Energy Volume Share (%), by Country 2024 & 2032
- Figure 43: Middle East & Africa West Europe Renewable Energy Revenue (Million), by Source 2024 & 2032
- Figure 44: Middle East & Africa West Europe Renewable Energy Volume (Gigawatte), by Source 2024 & 2032
- Figure 45: Middle East & Africa West Europe Renewable Energy Revenue Share (%), by Source 2024 & 2032
- Figure 46: Middle East & Africa West Europe Renewable Energy Volume Share (%), by Source 2024 & 2032
- Figure 47: Middle East & Africa West Europe Renewable Energy Revenue (Million), by Geogrpahy 2024 & 2032
- Figure 48: Middle East & Africa West Europe Renewable Energy Volume (Gigawatte), by Geogrpahy 2024 & 2032
- Figure 49: Middle East & Africa West Europe Renewable Energy Revenue Share (%), by Geogrpahy 2024 & 2032
- Figure 50: Middle East & Africa West Europe Renewable Energy Volume Share (%), by Geogrpahy 2024 & 2032
- Figure 51: Middle East & Africa West Europe Renewable Energy Revenue (Million), by Country 2024 & 2032
- Figure 52: Middle East & Africa West Europe Renewable Energy Volume (Gigawatte), by Country 2024 & 2032
- Figure 53: Middle East & Africa West Europe Renewable Energy Revenue Share (%), by Country 2024 & 2032
- Figure 54: Middle East & Africa West Europe Renewable Energy Volume Share (%), by Country 2024 & 2032
- Figure 55: Asia Pacific West Europe Renewable Energy Revenue (Million), by Source 2024 & 2032
- Figure 56: Asia Pacific West Europe Renewable Energy Volume (Gigawatte), by Source 2024 & 2032
- Figure 57: Asia Pacific West Europe Renewable Energy Revenue Share (%), by Source 2024 & 2032
- Figure 58: Asia Pacific West Europe Renewable Energy Volume Share (%), by Source 2024 & 2032
- Figure 59: Asia Pacific West Europe Renewable Energy Revenue (Million), by Geogrpahy 2024 & 2032
- Figure 60: Asia Pacific West Europe Renewable Energy Volume (Gigawatte), by Geogrpahy 2024 & 2032
- Figure 61: Asia Pacific West Europe Renewable Energy Revenue Share (%), by Geogrpahy 2024 & 2032
- Figure 62: Asia Pacific West Europe Renewable Energy Volume Share (%), by Geogrpahy 2024 & 2032
- Figure 63: Asia Pacific West Europe Renewable Energy Revenue (Million), by Country 2024 & 2032
- Figure 64: Asia Pacific West Europe Renewable Energy Volume (Gigawatte), by Country 2024 & 2032
- Figure 65: Asia Pacific West Europe Renewable Energy Revenue Share (%), by Country 2024 & 2032
- Figure 66: Asia Pacific West Europe Renewable Energy Volume Share (%), by Country 2024 & 2032
List of Tables
- Table 1: Global West Europe Renewable Energy Revenue Million Forecast, by Region 2019 & 2032
- Table 2: Global West Europe Renewable Energy Volume Gigawatte Forecast, by Region 2019 & 2032
- Table 3: Global West Europe Renewable Energy Revenue Million Forecast, by Source 2019 & 2032
- Table 4: Global West Europe Renewable Energy Volume Gigawatte Forecast, by Source 2019 & 2032
- Table 5: Global West Europe Renewable Energy Revenue Million Forecast, by Geogrpahy 2019 & 2032
- Table 6: Global West Europe Renewable Energy Volume Gigawatte Forecast, by Geogrpahy 2019 & 2032
- Table 7: Global West Europe Renewable Energy Revenue Million Forecast, by Region 2019 & 2032
- Table 8: Global West Europe Renewable Energy Volume Gigawatte Forecast, by Region 2019 & 2032
- Table 9: Global West Europe Renewable Energy Revenue Million Forecast, by Country 2019 & 2032
- Table 10: Global West Europe Renewable Energy Volume Gigawatte Forecast, by Country 2019 & 2032
- Table 11: Germany West Europe Renewable Energy Revenue (Million) Forecast, by Application 2019 & 2032
- Table 12: Germany West Europe Renewable Energy Volume (Gigawatte) Forecast, by Application 2019 & 2032
- Table 13: France West Europe Renewable Energy Revenue (Million) Forecast, by Application 2019 & 2032
- Table 14: France West Europe Renewable Energy Volume (Gigawatte) Forecast, by Application 2019 & 2032
- Table 15: Italy West Europe Renewable Energy Revenue (Million) Forecast, by Application 2019 & 2032
- Table 16: Italy West Europe Renewable Energy Volume (Gigawatte) Forecast, by Application 2019 & 2032
- Table 17: United Kingdom West Europe Renewable Energy Revenue (Million) Forecast, by Application 2019 & 2032
- Table 18: United Kingdom West Europe Renewable Energy Volume (Gigawatte) Forecast, by Application 2019 & 2032
- Table 19: Netherlands West Europe Renewable Energy Revenue (Million) Forecast, by Application 2019 & 2032
- Table 20: Netherlands West Europe Renewable Energy Volume (Gigawatte) Forecast, by Application 2019 & 2032
- Table 21: Sweden West Europe Renewable Energy Revenue (Million) Forecast, by Application 2019 & 2032
- Table 22: Sweden West Europe Renewable Energy Volume (Gigawatte) Forecast, by Application 2019 & 2032
- Table 23: Rest of Europe West Europe Renewable Energy Revenue (Million) Forecast, by Application 2019 & 2032
- Table 24: Rest of Europe West Europe Renewable Energy Volume (Gigawatte) Forecast, by Application 2019 & 2032
- Table 25: Global West Europe Renewable Energy Revenue Million Forecast, by Source 2019 & 2032
- Table 26: Global West Europe Renewable Energy Volume Gigawatte Forecast, by Source 2019 & 2032
- Table 27: Global West Europe Renewable Energy Revenue Million Forecast, by Geogrpahy 2019 & 2032
- Table 28: Global West Europe Renewable Energy Volume Gigawatte Forecast, by Geogrpahy 2019 & 2032
- Table 29: Global West Europe Renewable Energy Revenue Million Forecast, by Country 2019 & 2032
- Table 30: Global West Europe Renewable Energy Volume Gigawatte Forecast, by Country 2019 & 2032
- Table 31: United States West Europe Renewable Energy Revenue (Million) Forecast, by Application 2019 & 2032
- Table 32: United States West Europe Renewable Energy Volume (Gigawatte) Forecast, by Application 2019 & 2032
- Table 33: Canada West Europe Renewable Energy Revenue (Million) Forecast, by Application 2019 & 2032
- Table 34: Canada West Europe Renewable Energy Volume (Gigawatte) Forecast, by Application 2019 & 2032
- Table 35: Mexico West Europe Renewable Energy Revenue (Million) Forecast, by Application 2019 & 2032
- Table 36: Mexico West Europe Renewable Energy Volume (Gigawatte) Forecast, by Application 2019 & 2032
- Table 37: Global West Europe Renewable Energy Revenue Million Forecast, by Source 2019 & 2032
- Table 38: Global West Europe Renewable Energy Volume Gigawatte Forecast, by Source 2019 & 2032
- Table 39: Global West Europe Renewable Energy Revenue Million Forecast, by Geogrpahy 2019 & 2032
- Table 40: Global West Europe Renewable Energy Volume Gigawatte Forecast, by Geogrpahy 2019 & 2032
- Table 41: Global West Europe Renewable Energy Revenue Million Forecast, by Country 2019 & 2032
- Table 42: Global West Europe Renewable Energy Volume Gigawatte Forecast, by Country 2019 & 2032
- Table 43: Brazil West Europe Renewable Energy Revenue (Million) Forecast, by Application 2019 & 2032
- Table 44: Brazil West Europe Renewable Energy Volume (Gigawatte) Forecast, by Application 2019 & 2032
- Table 45: Argentina West Europe Renewable Energy Revenue (Million) Forecast, by Application 2019 & 2032
- Table 46: Argentina West Europe Renewable Energy Volume (Gigawatte) Forecast, by Application 2019 & 2032
- Table 47: Rest of South America West Europe Renewable Energy Revenue (Million) Forecast, by Application 2019 & 2032
- Table 48: Rest of South America West Europe Renewable Energy Volume (Gigawatte) Forecast, by Application 2019 & 2032
- Table 49: Global West Europe Renewable Energy Revenue Million Forecast, by Source 2019 & 2032
- Table 50: Global West Europe Renewable Energy Volume Gigawatte Forecast, by Source 2019 & 2032
- Table 51: Global West Europe Renewable Energy Revenue Million Forecast, by Geogrpahy 2019 & 2032
- Table 52: Global West Europe Renewable Energy Volume Gigawatte Forecast, by Geogrpahy 2019 & 2032
- Table 53: Global West Europe Renewable Energy Revenue Million Forecast, by Country 2019 & 2032
- Table 54: Global West Europe Renewable Energy Volume Gigawatte Forecast, by Country 2019 & 2032
- Table 55: United Kingdom West Europe Renewable Energy Revenue (Million) Forecast, by Application 2019 & 2032
- Table 56: United Kingdom West Europe Renewable Energy Volume (Gigawatte) Forecast, by Application 2019 & 2032
- Table 57: Germany West Europe Renewable Energy Revenue (Million) Forecast, by Application 2019 & 2032
- Table 58: Germany West Europe Renewable Energy Volume (Gigawatte) Forecast, by Application 2019 & 2032
- Table 59: France West Europe Renewable Energy Revenue (Million) Forecast, by Application 2019 & 2032
- Table 60: France West Europe Renewable Energy Volume (Gigawatte) Forecast, by Application 2019 & 2032
- Table 61: Italy West Europe Renewable Energy Revenue (Million) Forecast, by Application 2019 & 2032
- Table 62: Italy West Europe Renewable Energy Volume (Gigawatte) Forecast, by Application 2019 & 2032
- Table 63: Spain West Europe Renewable Energy Revenue (Million) Forecast, by Application 2019 & 2032
- Table 64: Spain West Europe Renewable Energy Volume (Gigawatte) Forecast, by Application 2019 & 2032
- Table 65: Russia West Europe Renewable Energy Revenue (Million) Forecast, by Application 2019 & 2032
- Table 66: Russia West Europe Renewable Energy Volume (Gigawatte) Forecast, by Application 2019 & 2032
- Table 67: Benelux West Europe Renewable Energy Revenue (Million) Forecast, by Application 2019 & 2032
- Table 68: Benelux West Europe Renewable Energy Volume (Gigawatte) Forecast, by Application 2019 & 2032
- Table 69: Nordics West Europe Renewable Energy Revenue (Million) Forecast, by Application 2019 & 2032
- Table 70: Nordics West Europe Renewable Energy Volume (Gigawatte) Forecast, by Application 2019 & 2032
- Table 71: Rest of Europe West Europe Renewable Energy Revenue (Million) Forecast, by Application 2019 & 2032
- Table 72: Rest of Europe West Europe Renewable Energy Volume (Gigawatte) Forecast, by Application 2019 & 2032
- Table 73: Global West Europe Renewable Energy Revenue Million Forecast, by Source 2019 & 2032
- Table 74: Global West Europe Renewable Energy Volume Gigawatte Forecast, by Source 2019 & 2032
- Table 75: Global West Europe Renewable Energy Revenue Million Forecast, by Geogrpahy 2019 & 2032
- Table 76: Global West Europe Renewable Energy Volume Gigawatte Forecast, by Geogrpahy 2019 & 2032
- Table 77: Global West Europe Renewable Energy Revenue Million Forecast, by Country 2019 & 2032
- Table 78: Global West Europe Renewable Energy Volume Gigawatte Forecast, by Country 2019 & 2032
- Table 79: Turkey West Europe Renewable Energy Revenue (Million) Forecast, by Application 2019 & 2032
- Table 80: Turkey West Europe Renewable Energy Volume (Gigawatte) Forecast, by Application 2019 & 2032
- Table 81: Israel West Europe Renewable Energy Revenue (Million) Forecast, by Application 2019 & 2032
- Table 82: Israel West Europe Renewable Energy Volume (Gigawatte) Forecast, by Application 2019 & 2032
- Table 83: GCC West Europe Renewable Energy Revenue (Million) Forecast, by Application 2019 & 2032
- Table 84: GCC West Europe Renewable Energy Volume (Gigawatte) Forecast, by Application 2019 & 2032
- Table 85: North Africa West Europe Renewable Energy Revenue (Million) Forecast, by Application 2019 & 2032
- Table 86: North Africa West Europe Renewable Energy Volume (Gigawatte) Forecast, by Application 2019 & 2032
- Table 87: South Africa West Europe Renewable Energy Revenue (Million) Forecast, by Application 2019 & 2032
- Table 88: South Africa West Europe Renewable Energy Volume (Gigawatte) Forecast, by Application 2019 & 2032
- Table 89: Rest of Middle East & Africa West Europe Renewable Energy Revenue (Million) Forecast, by Application 2019 & 2032
- Table 90: Rest of Middle East & Africa West Europe Renewable Energy Volume (Gigawatte) Forecast, by Application 2019 & 2032
- Table 91: Global West Europe Renewable Energy Revenue Million Forecast, by Source 2019 & 2032
- Table 92: Global West Europe Renewable Energy Volume Gigawatte Forecast, by Source 2019 & 2032
- Table 93: Global West Europe Renewable Energy Revenue Million Forecast, by Geogrpahy 2019 & 2032
- Table 94: Global West Europe Renewable Energy Volume Gigawatte Forecast, by Geogrpahy 2019 & 2032
- Table 95: Global West Europe Renewable Energy Revenue Million Forecast, by Country 2019 & 2032
- Table 96: Global West Europe Renewable Energy Volume Gigawatte Forecast, by Country 2019 & 2032
- Table 97: China West Europe Renewable Energy Revenue (Million) Forecast, by Application 2019 & 2032
- Table 98: China West Europe Renewable Energy Volume (Gigawatte) Forecast, by Application 2019 & 2032
- Table 99: India West Europe Renewable Energy Revenue (Million) Forecast, by Application 2019 & 2032
- Table 100: India West Europe Renewable Energy Volume (Gigawatte) Forecast, by Application 2019 & 2032
- Table 101: Japan West Europe Renewable Energy Revenue (Million) Forecast, by Application 2019 & 2032
- Table 102: Japan West Europe Renewable Energy Volume (Gigawatte) Forecast, by Application 2019 & 2032
- Table 103: South Korea West Europe Renewable Energy Revenue (Million) Forecast, by Application 2019 & 2032
- Table 104: South Korea West Europe Renewable Energy Volume (Gigawatte) Forecast, by Application 2019 & 2032
- Table 105: ASEAN West Europe Renewable Energy Revenue (Million) Forecast, by Application 2019 & 2032
- Table 106: ASEAN West Europe Renewable Energy Volume (Gigawatte) Forecast, by Application 2019 & 2032
- Table 107: Oceania West Europe Renewable Energy Revenue (Million) Forecast, by Application 2019 & 2032
- Table 108: Oceania West Europe Renewable Energy Volume (Gigawatte) Forecast, by Application 2019 & 2032
- Table 109: Rest of Asia Pacific West Europe Renewable Energy Revenue (Million) Forecast, by Application 2019 & 2032
- Table 110: Rest of Asia Pacific West Europe Renewable Energy Volume (Gigawatte) Forecast, by Application 2019 & 2032
Frequently Asked Questions
1. What is the projected Compound Annual Growth Rate (CAGR) of the West Europe Renewable Energy?
The projected CAGR is approximately > 6.00%.
2. Which companies are prominent players in the West Europe Renewable Energy?
Key companies in the market include JinkoSolar Holding Co Ltd, Total SA, Engie SA, Vestas Wind Systems A/S, Electricite de France SA, Siemens Gamesa Renewable Energy SA, Renewable Energy Systems Ltd, Ecotricity Group Ltd, General Electric Company.
3. What are the main segments of the West Europe Renewable Energy?
The market segments include Source, Geogrpahy.
4. Can you provide details about the market size?
The market size is estimated to be USD XX Million as of 2022.
5. What are some drivers contributing to market growth?
4.; Demand for Solar Photovoltaic Installations4.; Growing Investments.
6. What are the notable trends driving market growth?
Wind Energy to Witness Significant Growth.
7. Are there any restraints impacting market growth?
4.; Increasing Wind Energy Installations.
8. Can you provide examples of recent developments in the market?
December 2022: France launched tenders for two new offshore wind farms, which are bottom-fixed and were expected to have a total capacity of 2.5 GW. The first wind farm was expected to be 35 km off Oléron Island in the Atlantic (Nouvelle-Aquitaine) with a capacity of about 1 GW. The second wind farm was expected to be 38 km off the coast of Normandy, with a capacity of approximately 1.5 GW. The projects were to be awarded at the end of 2023 or early 2024.
9. What pricing options are available for accessing the report?
Pricing options include single-user, multi-user, and enterprise licenses priced at USD 4750, USD 5250, and USD 8750 respectively.
10. Is the market size provided in terms of value or volume?
The market size is provided in terms of value, measured in Million and volume, measured in Gigawatte.
11. Are there any specific market keywords associated with the report?
Yes, the market keyword associated with the report is "West Europe Renewable Energy," which aids in identifying and referencing the specific market segment covered.
12. How do I determine which pricing option suits my needs best?
The pricing options vary based on user requirements and access needs. Individual users may opt for single-user licenses, while businesses requiring broader access may choose multi-user or enterprise licenses for cost-effective access to the report.
13. Are there any additional resources or data provided in the West Europe Renewable Energy report?
While the report offers comprehensive insights, it's advisable to review the specific contents or supplementary materials provided to ascertain if additional resources or data are available.
14. How can I stay updated on further developments or reports in the West Europe Renewable Energy?
To stay informed about further developments, trends, and reports in the West Europe Renewable Energy, consider subscribing to industry newsletters, following relevant companies and organizations, or regularly checking reputable industry news sources and publications.
Methodology
Step 1 - Identification of Relevant Samples Size from Population Database


Step 2 - Approaches for Defining Global Market Size (Value, Volume* & Price*)

Note*: In applicable scenarios
Step 3 - Data Sources
Primary Research
- Web Analytics
- Survey Reports
- Research Institute
- Latest Research Reports
- Opinion Leaders
Secondary Research
- Annual Reports
- White Paper
- Latest Press Release
- Industry Association
- Paid Database
- Investor Presentations

Step 4 - Data Triangulation
Involves using different sources of information in order to increase the validity of a study
These sources are likely to be stakeholders in a program - participants, other researchers, program staff, other community members, and so on.
Then we put all data in single framework & apply various statistical tools to find out the dynamic on the market.
During the analysis stage, feedback from the stakeholder groups would be compared to determine areas of agreement as well as areas of divergence
