

Key Insights
The global Industrial Radiography Equipment market is poised for substantial expansion, projected to reach an estimated $1.35 billion by 2025. This growth is fueled by a robust Compound Annual Growth Rate (CAGR) of 8.6%, indicating a dynamic and expanding sector. The primary drivers for this upward trajectory include the increasing demand for stringent quality control and non-destructive testing (NDT) across a multitude of industries. Sectors such as aerospace, automotive and manufacturing, oil and gas, and energy and power are particularly reliant on advanced radiography techniques to ensure the integrity and safety of critical components. Advancements in radiography technology, including the development of more sophisticated digital radiography systems, computed tomography, and improved film processing, are also key contributors to market growth. These technological leaps offer enhanced image resolution, faster inspection times, and more comprehensive data analysis, thereby increasing adoption rates.
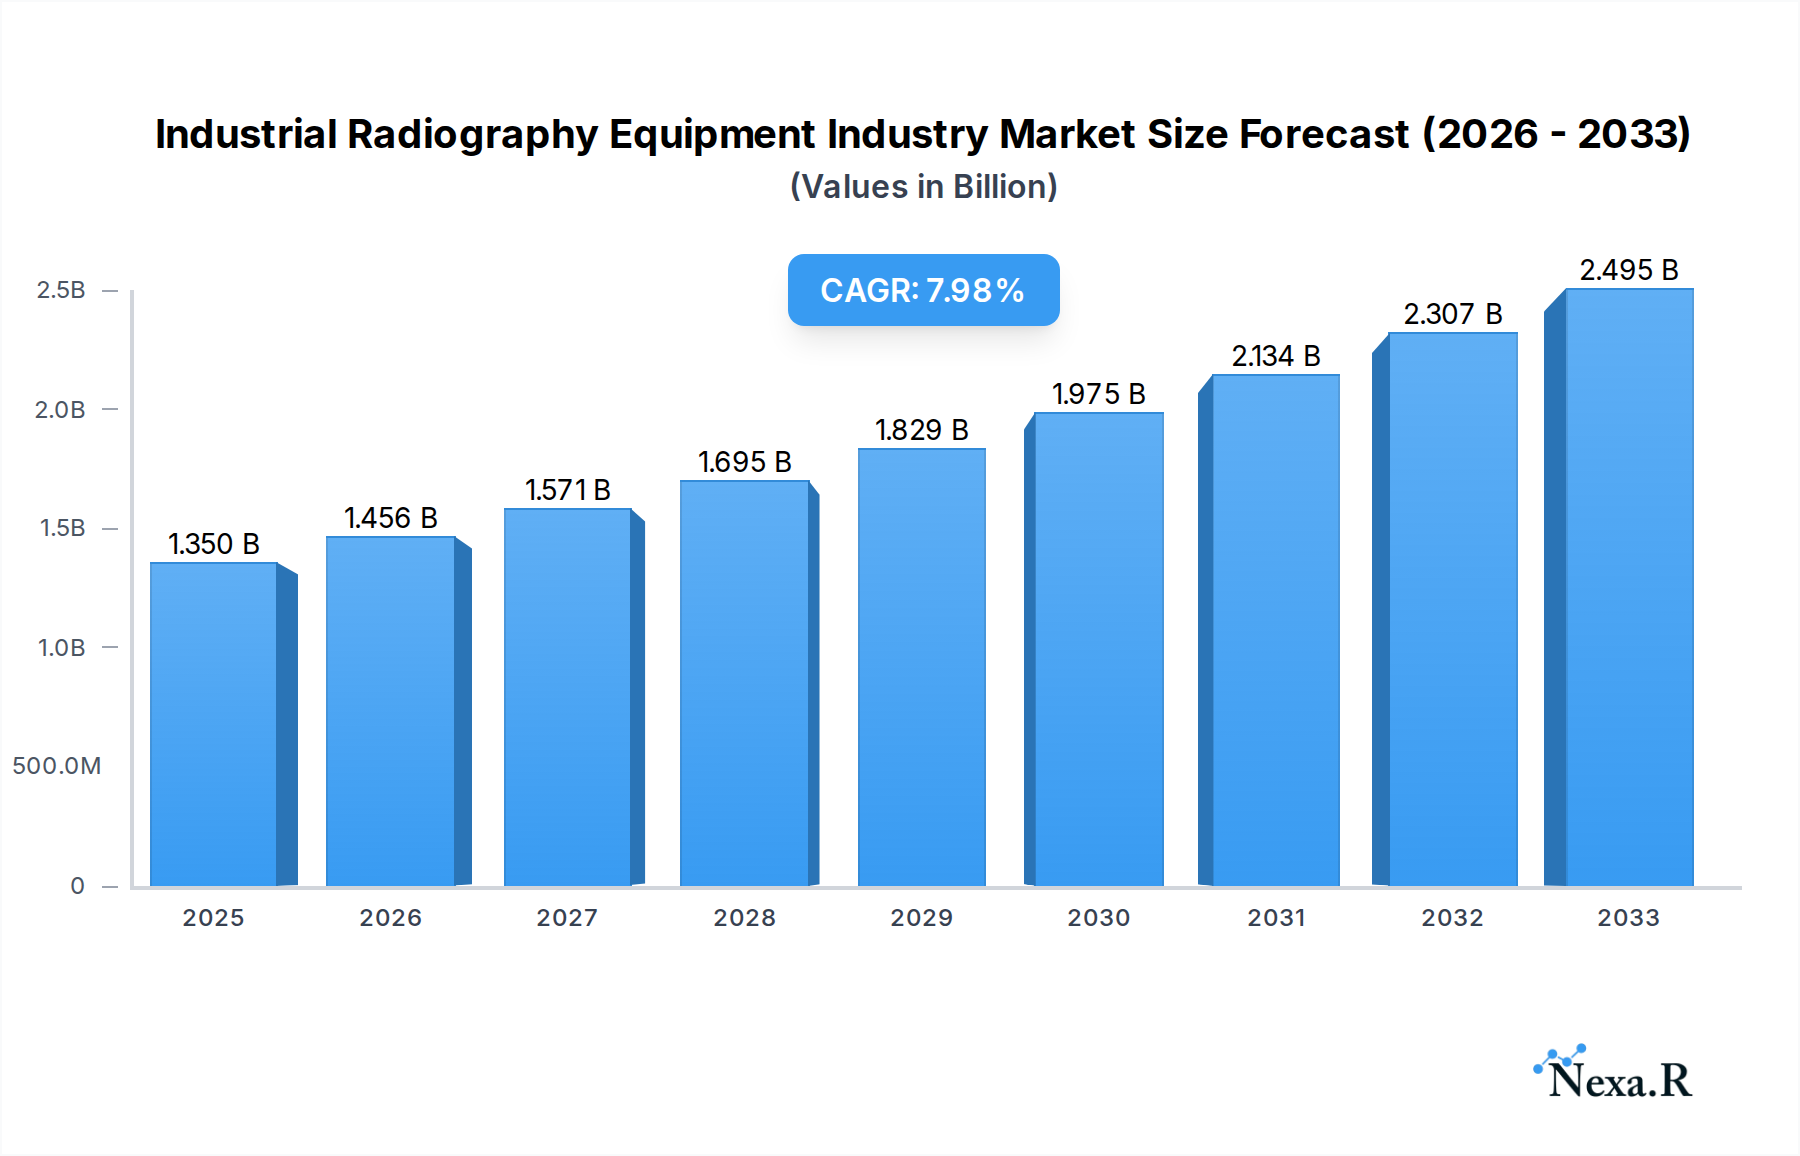
Industrial Radiography Equipment Industry Market Size (In Billion)
The market's expansion is further supported by evolving industry standards and regulations that mandate rigorous testing protocols, especially in high-risk sectors. Emerging trends, such as the integration of artificial intelligence (AI) and machine learning (ML) for automated defect detection and analysis, are set to revolutionize industrial radiography, making inspections more efficient and accurate. While the market benefits from these drivers and trends, certain restraints, such as the high initial investment cost of advanced radiography equipment and the need for specialized training for operators, could temper rapid adoption in some segments. However, the overarching demand for safety, reliability, and compliance, coupled with ongoing technological innovation, is expected to propel the Industrial Radiography Equipment market to new heights throughout the forecast period, with continued strong performance anticipated from 2025 to 2033.

Industrial Radiography Equipment Industry Company Market Share
Industrial Radiography Equipment Industry Market Dynamics & Structure
The global industrial radiography equipment market exhibits a moderately concentrated structure, characterized by the presence of both established multinational corporations and specialized regional players. Key players like General Electric Company, Hitachi Ltd, and Nikon Corporation hold significant market shares, driven by extensive product portfolios and strong R&D capabilities. Technological innovation remains a paramount driver, with advancements in digital radiography (DR) and computed tomography (CT) systems continuously enhancing imaging resolution, speed, and data analysis. Regulatory frameworks, particularly those concerning safety and quality control in critical industries such as Aerospace and Oil and Gas, also play a crucial role in shaping market demands and product specifications.
- Market Concentration: Dominant by a few large players, with a growing number of niche providers.
- Technological Innovation Drivers: Miniaturization of equipment, AI-powered image analysis, and development of portable CT scanners.
- Regulatory Frameworks: Stringent safety standards and increasing adoption of non-destructive testing (NDT) regulations in sectors like nuclear and defense.
- Competitive Product Substitutes: Advancements in ultrasonic testing and eddy current testing offer alternative NDT solutions, posing a challenge to radiography's market dominance in certain applications.
- End-User Demographics: Increasing demand from emerging economies, driven by infrastructure development and industrial growth.
- M&A Trends: Strategic acquisitions aimed at expanding product offerings, gaining access to new technologies, and consolidating market presence. Several small and medium-sized enterprises are being acquired by larger entities to accelerate growth and market reach.
Industrial Radiography Equipment Industry Growth Trends & Insights
The Industrial Radiography Equipment Industry is poised for robust growth, projected to reach a market size of USD 6.5 billion by 2033, expanding at a Compound Annual Growth Rate (CAGR) of 7.2% from 2025 to 2033. This expansion is propelled by an escalating need for advanced non-destructive testing (NDT) solutions across a diverse range of end-user industries. The adoption of digital radiography (DR) and computed radiography (CR) technologies, offering superior image quality, faster inspection times, and reduced environmental impact compared to traditional film radiography, is a significant growth catalyst. Furthermore, the increasing complexity of manufactured components in sectors like Aerospace and Automotive necessitates highly precise and detailed inspection methods, further fueling demand for sophisticated radiography equipment.
Computed Tomography (CT) is emerging as a transformative technology within the industry, enabling volumetric imaging and detailed internal defect detection. Its application is rapidly expanding beyond traditional quality control to areas such as reverse engineering and metrology. The growing emphasis on stringent quality assurance and safety regulations globally, particularly in critical infrastructure and high-risk industries like Oil and Gas and Energy and Power, directly translates into higher demand for reliable and accurate radiography inspection systems.
Consumer behavior is shifting towards automated and data-driven inspection processes. The integration of Artificial Intelligence (AI) and Machine Learning (ML) with radiography equipment is enabling more efficient data analysis, anomaly detection, and predictive maintenance insights. This technological convergence is not only enhancing the efficiency of existing applications but also opening up new avenues for industrial radiography in emerging sectors like additive manufacturing and advanced materials. The parent market, encompassing all NDT methods, is a significant driver, with radiography holding a substantial share due to its established reliability and versatility. Within this parent market, the child market of digital radiography and computed tomography is experiencing particularly rapid growth, indicating a clear trend towards more advanced solutions. The increasing penetration of these digital technologies is a key indicator of future market trajectory, as industries seek to optimize their inspection workflows and enhance overall product integrity. The forecast period is expected to witness a significant surge in market penetration for advanced digital solutions, driven by both technological advancements and evolving industry demands for higher precision and efficiency in inspection processes.
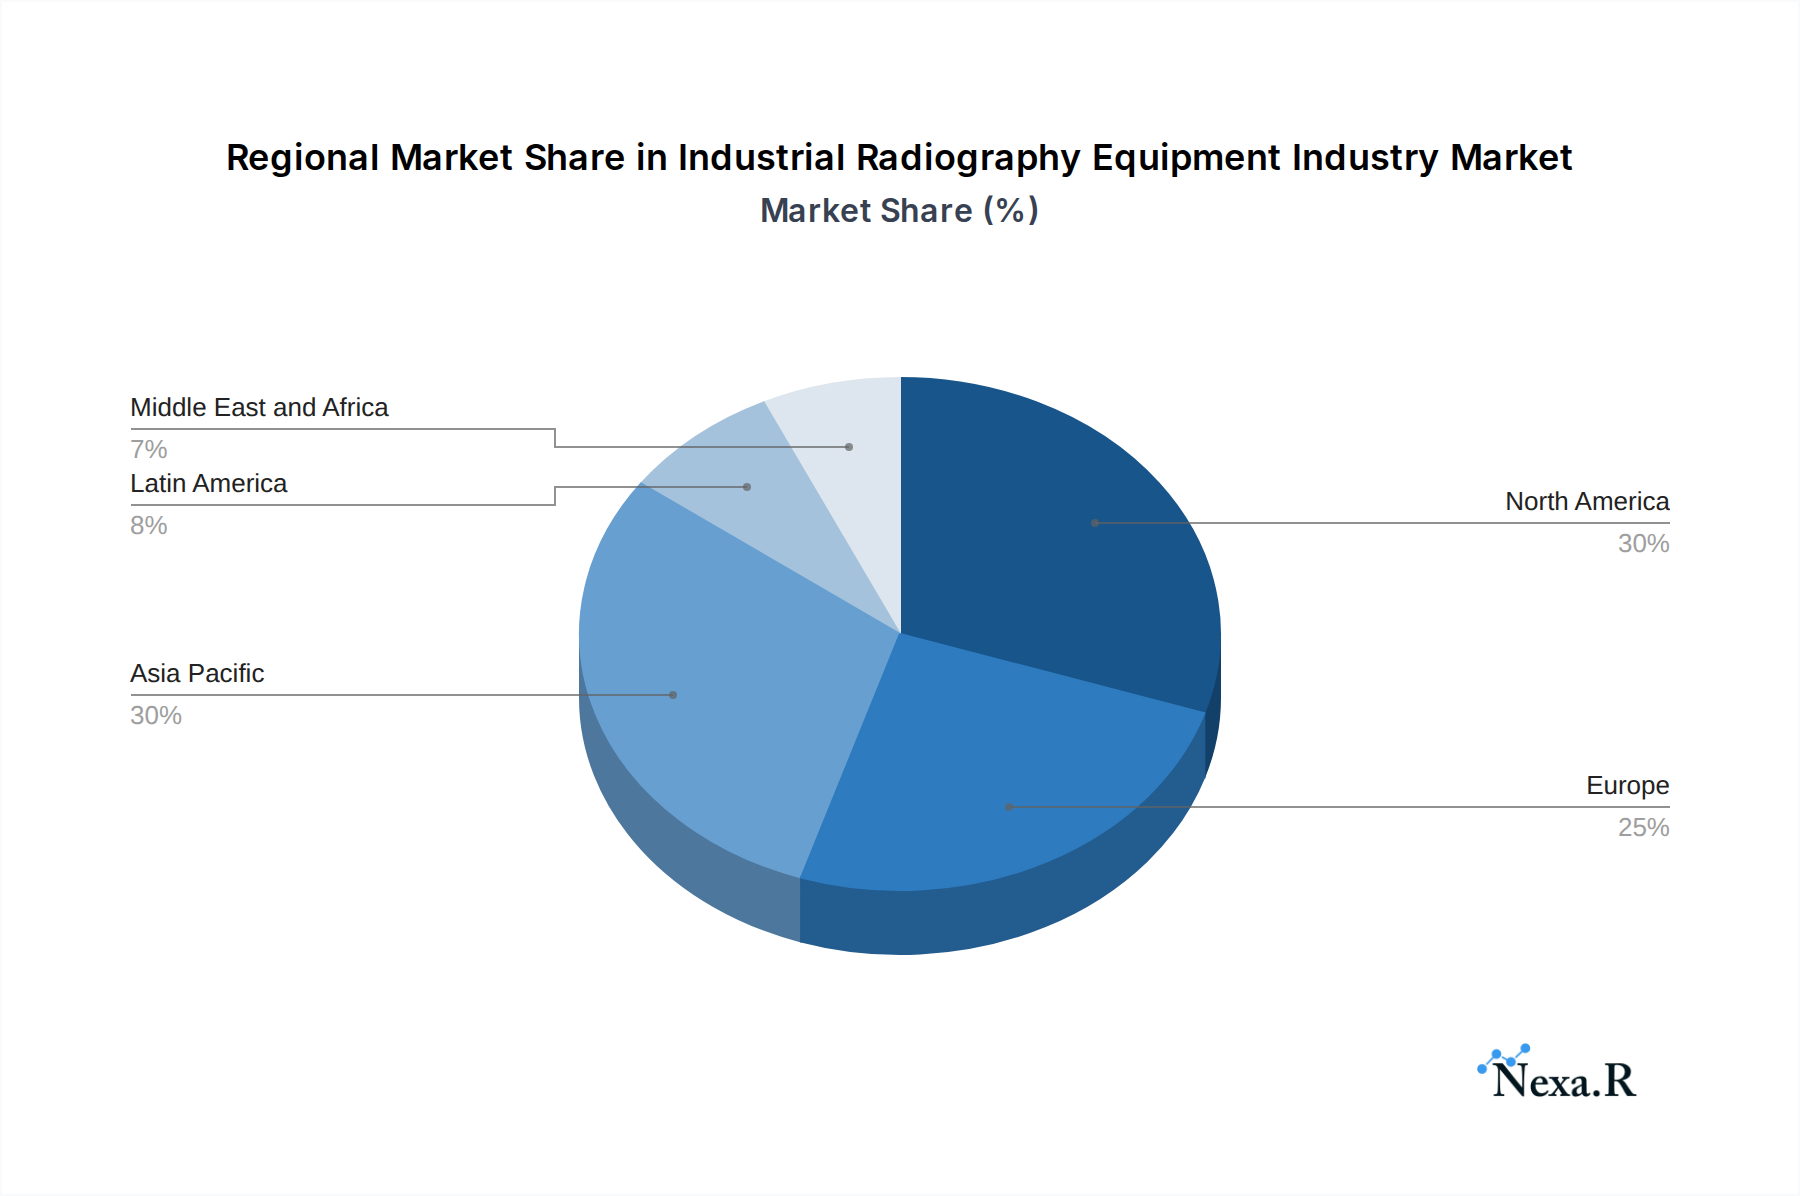
Dominant Regions, Countries, or Segments in Industrial Radiography Equipment Industry
North America currently holds a dominant position in the global Industrial Radiography Equipment Industry, driven by its advanced manufacturing sector, robust aerospace industry, and significant investments in oil and gas exploration and production. The region’s commitment to stringent quality control and safety standards, coupled with a strong regulatory framework, necessitates the widespread adoption of advanced NDT solutions. The United States is a primary contributor to this dominance, with a mature market for industrial radiography equipment and a high concentration of key end-user industries, including Aerospace, Automotive and Manufacturing, and Energy and Power. The presence of leading companies and research institutions fosters continuous innovation and rapid adoption of new technologies.
The Offering: Equipment segment is the largest and most significant driver of market growth within this region, reflecting the fundamental need for physical radiography devices. However, the Offering: Software segment is experiencing substantial growth, driven by the increasing integration of digital radiography systems and the demand for advanced image processing and analysis capabilities. Geographically, within North America, states with high concentrations of manufacturing, aerospace, and energy companies, such as Texas, California, and Washington, represent key consumption hubs.
Technologically, Computed Radiography (CR) and Direct Radiography (DR) are the dominant technologies, gradually replacing traditional film radiography due to their efficiency, cost-effectiveness, and environmental benefits. The increasing adoption of Computed Tomography (CT) for its detailed volumetric imaging capabilities is also a significant growth factor, particularly in the aerospace and automotive sectors for complex part inspection. The End-user Industry: Aerospace segment in North America is a particularly strong market, demanding high-resolution imaging for critical component inspection.
- Dominant Region: North America, led by the United States.
- Key Drivers in North America:
- Advanced manufacturing and automotive industries.
- Significant oil and gas exploration and production activities.
- Stringent safety and quality regulations across critical sectors.
- High adoption rate of digital radiography (DR) and computed radiography (CR).
- Strong presence of key industry players and research institutions.
- Dominant Offering Segment: Equipment, with a strong and rapidly growing Software segment.
- Dominant Technology: Computed Radiography (CR) and Direct Radiography (DR), with increasing adoption of Computed Tomography (CT).
- Dominant End-User Industry: Aerospace, followed closely by Automotive and Manufacturing, and Oil and Gas.
- Market Share & Growth Potential: North America accounts for an estimated 38% of the global market share, with projected growth rates aligning with the industry average, driven by continuous technological advancements and evolving industry needs. The child market of digital radiography and computed tomography within North America is experiencing growth exceeding the overall market average.
Industrial Radiography Equipment Industry Product Landscape
The industrial radiography equipment market is witnessing continuous product innovation focused on enhancing imaging resolution, reducing inspection times, and improving portability. Advanced digital radiography (DR) systems now offer real-time imaging capabilities, allowing for immediate defect detection and faster workflow. Computed radiography (CR) systems are increasingly being integrated with portable readers for on-site inspection. Computed tomography (CT) scanners are becoming more compact and powerful, enabling detailed three-dimensional volumetric analysis of complex parts. Emerging technologies include portable X-ray generators and the integration of AI for automated image analysis and defect classification, significantly improving inspection efficiency and accuracy across various end-user industries.
Key Drivers, Barriers & Challenges in Industrial Radiography Equipment Industry
Key Drivers: The primary drivers propelling the Industrial Radiography Equipment Industry include the increasing demand for quality assurance and safety compliance in critical sectors like Aerospace, Oil and Gas, and Energy. Technological advancements in digital radiography (DR), computed radiography (CR), and computed tomography (CT) offer enhanced inspection capabilities, leading to wider adoption. Growing infrastructure development in emerging economies and the rise of additive manufacturing further fuel market expansion.
Barriers & Challenges: High initial investment costs for advanced radiography systems can be a significant barrier for small and medium-sized enterprises. The stringent regulatory landscape, while a driver for adoption, also presents challenges in terms of compliance and standardization. The availability of alternative NDT methods, such as ultrasonic testing, poses competitive pressure. Additionally, a shortage of skilled technicians for operating and maintaining sophisticated radiography equipment can hinder market growth. Supply chain disruptions and evolving geopolitical factors can also impact the availability and cost of essential components.
Emerging Opportunities in Industrial Radiography Equipment Industry
Emerging opportunities in the industrial radiography equipment industry lie in the expanding application of computed tomography (CT) for detailed internal inspection of complex 3D printed components and advanced composite materials. The development of portable and wireless radiography systems is creating new possibilities for on-site inspection in remote locations and challenging environments, particularly within the oil and gas and construction sectors. Furthermore, the integration of artificial intelligence (AI) and machine learning (ML) for automated image analysis and defect identification presents a significant opportunity to enhance efficiency and accuracy, catering to the growing demand for data-driven inspection solutions. Untapped markets in developing economies, driven by rapid industrialization, also offer substantial growth potential.
Growth Accelerators in the Industrial Radiography Equipment Industry Industry
Catalysts driving long-term growth in the Industrial Radiography Equipment Industry include breakthroughs in digital detector technology, leading to higher resolution and faster imaging speeds. Strategic partnerships between equipment manufacturers and software developers are accelerating the integration of AI-powered analytics, enhancing the intelligence of inspection systems. Market expansion strategies focused on emerging economies, coupled with investments in research and development to create more cost-effective and user-friendly digital radiography solutions, are also critical growth accelerators. The increasing adoption of these advanced NDT solutions across a wider range of industries beyond traditional sectors is also a significant accelerator.
Key Players Shaping the Industrial Radiography Equipment Industry Market
- Bosello High Technology SRL
- Canon Inc
- Nikon Corporation
- L3Harris Security & Detection Systems
- Vidisco Ltd
- Dürr NDT Gmbh & Co KG
- Teledyne Dalsa Inc
- North Star Imaging Inc
- YXLON International
- Hamamatsu Photonics K K
- Carestream Health Inc
- Hitachi Ltd
- General Electric Company
- Olympus Corporation
- Rigaku Corporation
Notable Milestones in Industrial Radiography Equipment Industry Sector
- 2019: Launch of portable digital radiography (DR) systems with enhanced image quality and real-time imaging capabilities by multiple manufacturers.
- 2020: Significant advancements in computed tomography (CT) technology, offering higher resolution and faster scanning times for complex industrial parts.
- 2021: Increased integration of Artificial Intelligence (AI) in radiography software for automated defect detection and image analysis, leading to improved inspection efficiency.
- 2022: Growing adoption of portable X-ray generators and wireless data transmission for on-site inspections in challenging environments.
- 2023: Development of advanced detectors for CR and DR, enabling lower dose inspections with improved image fidelity.
- 2024: Increased focus on the application of industrial radiography in additive manufacturing for quality control of 3D printed components.
In-Depth Industrial Radiography Equipment Industry Market Outlook
The Industrial Radiography Equipment Industry is set for sustained growth, driven by the continuous evolution of digital imaging technologies and the escalating demand for reliable non-destructive testing (NDT) solutions. The increasing adoption of computed tomography (CT) for its detailed volumetric inspection capabilities, particularly in advanced manufacturing sectors, will be a significant growth accelerator. Strategic collaborations and mergers are expected to further consolidate the market and drive innovation. The industry's future potential is deeply intertwined with its ability to cater to the evolving needs of industries seeking enhanced efficiency, accuracy, and safety in their quality control processes. The growing emphasis on Industry 4.0 principles will also fuel the demand for smart, connected radiography systems offering real-time data analytics and seamless integration into automated workflows.
Industrial Radiography Equipment Industry Segmentation
-
1. Offering
- 1.1. Equipment
- 1.2. Software
-
2. Technology
- 2.1. Film Radiography
- 2.2. Computed Radiography
- 2.3. Direct Radiography
- 2.4. Computed Tomography
-
3. End-user Industry
- 3.1. Aerospace
- 3.2. Food Industry
- 3.3. Construction
- 3.4. Oil and Gas
- 3.5. Automotive and Manufacturing
- 3.6. Energy and Power
- 3.7. Semiconductor and Electronics
- 3.8. Other End-user Industries
Industrial Radiography Equipment Industry Segmentation By Geography
- 1. North America
- 2. Europe
- 3. Asia Pacific
- 4. Latin America
- 5. Middle East and Africa
Industrial Radiography Equipment Industry Regional Market Share
Geographic Coverage of Industrial Radiography Equipment Industry
Industrial Radiography Equipment Industry REPORT HIGHLIGHTS
| Aspects | Details |
|---|---|
| Study Period | 2020-2034 |
| Base Year | 2025 |
| Estimated Year | 2026 |
| Forecast Period | 2026-2034 |
| Historical Period | 2020-2025 |
| Growth Rate | CAGR of 8.6% from 2020-2034 |
| Segmentation |
|
Table of Contents
- 1. Introduction
- 1.1. Research Scope
- 1.2. Market Segmentation
- 1.3. Research Objective
- 1.4. Definitions and Assumptions
- 2. Executive Summary
- 2.1. Market Snapshot
- 3. Market Dynamics
- 3.1. Market Drivers
- 3.2. Market Restrains
- 3.3. Market Trends
- 3.4. Market Opportunities
- 4. Market Factor Analysis
- 4.1. Porters Five Forces
- 4.1.1. Bargaining Power of Suppliers
- 4.1.2. Bargaining Power of Buyers
- 4.1.3. Threat of New Entrants
- 4.1.4. Threat of Substitutes
- 4.1.5. Competitive Rivalry
- 4.2. PESTEL analysis
- 4.3. BCG Analysis
- 4.3.1. Stars (High Growth, High Market Share)
- 4.3.2. Cash Cows (Low Growth, High Market Share)
- 4.3.3. Question Mark (High Growth, Low Market Share)
- 4.3.4. Dogs (Low Growth, Low Market Share)
- 4.4. Ansoff Matrix Analysis
- 4.5. Supply Chain Analysis
- 4.6. Regulatory Landscape
- 4.7. Current Market Potential and Opportunity Assessment (TAM–SAM–SOM Framework)
- 4.8. NRP Analyst Note
- 4.1. Porters Five Forces
- 5. Market Analysis, Insights and Forecast 2021-2033
- 5.1. Market Analysis, Insights and Forecast - by Offering
- 5.1.1. Equipment
- 5.1.2. Software
- 5.2. Market Analysis, Insights and Forecast - by Technology
- 5.2.1. Film Radiography
- 5.2.2. Computed Radiography
- 5.2.3. Direct Radiography
- 5.2.4. Computed Tomography
- 5.3. Market Analysis, Insights and Forecast - by End-user Industry
- 5.3.1. Aerospace
- 5.3.2. Food Industry
- 5.3.3. Construction
- 5.3.4. Oil and Gas
- 5.3.5. Automotive and Manufacturing
- 5.3.6. Energy and Power
- 5.3.7. Semiconductor and Electronics
- 5.3.8. Other End-user Industries
- 5.4. Market Analysis, Insights and Forecast - by Region
- 5.4.1. North America
- 5.4.2. Europe
- 5.4.3. Asia Pacific
- 5.4.4. Latin America
- 5.4.5. Middle East and Africa
- 5.1. Market Analysis, Insights and Forecast - by Offering
- 6. Global Industrial Radiography Equipment Industry Analysis, Insights and Forecast, 2021-2033
- 6.1. Market Analysis, Insights and Forecast - by Offering
- 6.1.1. Equipment
- 6.1.2. Software
- 6.2. Market Analysis, Insights and Forecast - by Technology
- 6.2.1. Film Radiography
- 6.2.2. Computed Radiography
- 6.2.3. Direct Radiography
- 6.2.4. Computed Tomography
- 6.3. Market Analysis, Insights and Forecast - by End-user Industry
- 6.3.1. Aerospace
- 6.3.2. Food Industry
- 6.3.3. Construction
- 6.3.4. Oil and Gas
- 6.3.5. Automotive and Manufacturing
- 6.3.6. Energy and Power
- 6.3.7. Semiconductor and Electronics
- 6.3.8. Other End-user Industries
- 6.1. Market Analysis, Insights and Forecast - by Offering
- 7. North America Industrial Radiography Equipment Industry Analysis, Insights and Forecast, 2020-2032
- 7.1. Market Analysis, Insights and Forecast - by Offering
- 7.1.1. Equipment
- 7.1.2. Software
- 7.2. Market Analysis, Insights and Forecast - by Technology
- 7.2.1. Film Radiography
- 7.2.2. Computed Radiography
- 7.2.3. Direct Radiography
- 7.2.4. Computed Tomography
- 7.3. Market Analysis, Insights and Forecast - by End-user Industry
- 7.3.1. Aerospace
- 7.3.2. Food Industry
- 7.3.3. Construction
- 7.3.4. Oil and Gas
- 7.3.5. Automotive and Manufacturing
- 7.3.6. Energy and Power
- 7.3.7. Semiconductor and Electronics
- 7.3.8. Other End-user Industries
- 7.1. Market Analysis, Insights and Forecast - by Offering
- 8. Europe Industrial Radiography Equipment Industry Analysis, Insights and Forecast, 2020-2032
- 8.1. Market Analysis, Insights and Forecast - by Offering
- 8.1.1. Equipment
- 8.1.2. Software
- 8.2. Market Analysis, Insights and Forecast - by Technology
- 8.2.1. Film Radiography
- 8.2.2. Computed Radiography
- 8.2.3. Direct Radiography
- 8.2.4. Computed Tomography
- 8.3. Market Analysis, Insights and Forecast - by End-user Industry
- 8.3.1. Aerospace
- 8.3.2. Food Industry
- 8.3.3. Construction
- 8.3.4. Oil and Gas
- 8.3.5. Automotive and Manufacturing
- 8.3.6. Energy and Power
- 8.3.7. Semiconductor and Electronics
- 8.3.8. Other End-user Industries
- 8.1. Market Analysis, Insights and Forecast - by Offering
- 9. Asia Pacific Industrial Radiography Equipment Industry Analysis, Insights and Forecast, 2020-2032
- 9.1. Market Analysis, Insights and Forecast - by Offering
- 9.1.1. Equipment
- 9.1.2. Software
- 9.2. Market Analysis, Insights and Forecast - by Technology
- 9.2.1. Film Radiography
- 9.2.2. Computed Radiography
- 9.2.3. Direct Radiography
- 9.2.4. Computed Tomography
- 9.3. Market Analysis, Insights and Forecast - by End-user Industry
- 9.3.1. Aerospace
- 9.3.2. Food Industry
- 9.3.3. Construction
- 9.3.4. Oil and Gas
- 9.3.5. Automotive and Manufacturing
- 9.3.6. Energy and Power
- 9.3.7. Semiconductor and Electronics
- 9.3.8. Other End-user Industries
- 9.1. Market Analysis, Insights and Forecast - by Offering
- 10. Latin America Industrial Radiography Equipment Industry Analysis, Insights and Forecast, 2020-2032
- 10.1. Market Analysis, Insights and Forecast - by Offering
- 10.1.1. Equipment
- 10.1.2. Software
- 10.2. Market Analysis, Insights and Forecast - by Technology
- 10.2.1. Film Radiography
- 10.2.2. Computed Radiography
- 10.2.3. Direct Radiography
- 10.2.4. Computed Tomography
- 10.3. Market Analysis, Insights and Forecast - by End-user Industry
- 10.3.1. Aerospace
- 10.3.2. Food Industry
- 10.3.3. Construction
- 10.3.4. Oil and Gas
- 10.3.5. Automotive and Manufacturing
- 10.3.6. Energy and Power
- 10.3.7. Semiconductor and Electronics
- 10.3.8. Other End-user Industries
- 10.1. Market Analysis, Insights and Forecast - by Offering
- 11. Middle East and Africa Industrial Radiography Equipment Industry Analysis, Insights and Forecast, 2020-2032
- 11.1. Market Analysis, Insights and Forecast - by Offering
- 11.1.1. Equipment
- 11.1.2. Software
- 11.2. Market Analysis, Insights and Forecast - by Technology
- 11.2.1. Film Radiography
- 11.2.2. Computed Radiography
- 11.2.3. Direct Radiography
- 11.2.4. Computed Tomography
- 11.3. Market Analysis, Insights and Forecast - by End-user Industry
- 11.3.1. Aerospace
- 11.3.2. Food Industry
- 11.3.3. Construction
- 11.3.4. Oil and Gas
- 11.3.5. Automotive and Manufacturing
- 11.3.6. Energy and Power
- 11.3.7. Semiconductor and Electronics
- 11.3.8. Other End-user Industries
- 11.1. Market Analysis, Insights and Forecast - by Offering
- 12. Competitive Analysis
- 12.1. Company Profiles
- 12.1.1 Bosello High Technology SRL
- 12.1.1.1. Company Overview
- 12.1.1.2. Products
- 12.1.1.3. Company Financials
- 12.1.1.4. SWOT Analysis
- 12.1.2 Canon Inc
- 12.1.2.1. Company Overview
- 12.1.2.2. Products
- 12.1.2.3. Company Financials
- 12.1.2.4. SWOT Analysis
- 12.1.3 Nikon Corporation
- 12.1.3.1. Company Overview
- 12.1.3.2. Products
- 12.1.3.3. Company Financials
- 12.1.3.4. SWOT Analysis
- 12.1.4 L3Harris Security & Detection Systems
- 12.1.4.1. Company Overview
- 12.1.4.2. Products
- 12.1.4.3. Company Financials
- 12.1.4.4. SWOT Analysis
- 12.1.5 Vidisco Ltd
- 12.1.5.1. Company Overview
- 12.1.5.2. Products
- 12.1.5.3. Company Financials
- 12.1.5.4. SWOT Analysis
- 12.1.6 Dürr NDT Gmbh & Co KG
- 12.1.6.1. Company Overview
- 12.1.6.2. Products
- 12.1.6.3. Company Financials
- 12.1.6.4. SWOT Analysis
- 12.1.7 Teledyne Dalsa Inc
- 12.1.7.1. Company Overview
- 12.1.7.2. Products
- 12.1.7.3. Company Financials
- 12.1.7.4. SWOT Analysis
- 12.1.8 North Star Imaging Inc
- 12.1.8.1. Company Overview
- 12.1.8.2. Products
- 12.1.8.3. Company Financials
- 12.1.8.4. SWOT Analysis
- 12.1.9 YXLON International
- 12.1.9.1. Company Overview
- 12.1.9.2. Products
- 12.1.9.3. Company Financials
- 12.1.9.4. SWOT Analysis
- 12.1.10 Hamamatsu Photonics K K
- 12.1.10.1. Company Overview
- 12.1.10.2. Products
- 12.1.10.3. Company Financials
- 12.1.10.4. SWOT Analysis
- 12.1.11 Carestream Health Inc
- 12.1.11.1. Company Overview
- 12.1.11.2. Products
- 12.1.11.3. Company Financials
- 12.1.11.4. SWOT Analysis
- 12.1.12 Hitachi Ltd
- 12.1.12.1. Company Overview
- 12.1.12.2. Products
- 12.1.12.3. Company Financials
- 12.1.12.4. SWOT Analysis
- 12.1.13 General Electric Company
- 12.1.13.1. Company Overview
- 12.1.13.2. Products
- 12.1.13.3. Company Financials
- 12.1.13.4. SWOT Analysis
- 12.1.14 Olympus Corporation
- 12.1.14.1. Company Overview
- 12.1.14.2. Products
- 12.1.14.3. Company Financials
- 12.1.14.4. SWOT Analysis
- 12.1.15 Rigaku Corporation
- 12.1.15.1. Company Overview
- 12.1.15.2. Products
- 12.1.15.3. Company Financials
- 12.1.15.4. SWOT Analysis
- 12.1.1 Bosello High Technology SRL
- 12.2. Market Entropy
- 12.2.1 Company's Key Areas Served
- 12.2.2 Recent Developments
- 12.3. Company Market Share Analysis 2025
- 12.3.1 Top 5 Companies Market Share Analysis
- 12.3.2 Top 3 Companies Market Share Analysis
- 12.4. List of Potential Customers
- 13. Research Methodology
List of Figures
- Figure 1: Global Industrial Radiography Equipment Industry Revenue Breakdown (billion, %) by Region 2025 & 2033
- Figure 2: Global Industrial Radiography Equipment Industry Volume Breakdown (K Unit, %) by Region 2025 & 2033
- Figure 3: North America Industrial Radiography Equipment Industry Revenue (billion), by Offering 2025 & 2033
- Figure 4: North America Industrial Radiography Equipment Industry Volume (K Unit), by Offering 2025 & 2033
- Figure 5: North America Industrial Radiography Equipment Industry Revenue Share (%), by Offering 2025 & 2033
- Figure 6: North America Industrial Radiography Equipment Industry Volume Share (%), by Offering 2025 & 2033
- Figure 7: North America Industrial Radiography Equipment Industry Revenue (billion), by Technology 2025 & 2033
- Figure 8: North America Industrial Radiography Equipment Industry Volume (K Unit), by Technology 2025 & 2033
- Figure 9: North America Industrial Radiography Equipment Industry Revenue Share (%), by Technology 2025 & 2033
- Figure 10: North America Industrial Radiography Equipment Industry Volume Share (%), by Technology 2025 & 2033
- Figure 11: North America Industrial Radiography Equipment Industry Revenue (billion), by End-user Industry 2025 & 2033
- Figure 12: North America Industrial Radiography Equipment Industry Volume (K Unit), by End-user Industry 2025 & 2033
- Figure 13: North America Industrial Radiography Equipment Industry Revenue Share (%), by End-user Industry 2025 & 2033
- Figure 14: North America Industrial Radiography Equipment Industry Volume Share (%), by End-user Industry 2025 & 2033
- Figure 15: North America Industrial Radiography Equipment Industry Revenue (billion), by Country 2025 & 2033
- Figure 16: North America Industrial Radiography Equipment Industry Volume (K Unit), by Country 2025 & 2033
- Figure 17: North America Industrial Radiography Equipment Industry Revenue Share (%), by Country 2025 & 2033
- Figure 18: North America Industrial Radiography Equipment Industry Volume Share (%), by Country 2025 & 2033
- Figure 19: Europe Industrial Radiography Equipment Industry Revenue (billion), by Offering 2025 & 2033
- Figure 20: Europe Industrial Radiography Equipment Industry Volume (K Unit), by Offering 2025 & 2033
- Figure 21: Europe Industrial Radiography Equipment Industry Revenue Share (%), by Offering 2025 & 2033
- Figure 22: Europe Industrial Radiography Equipment Industry Volume Share (%), by Offering 2025 & 2033
- Figure 23: Europe Industrial Radiography Equipment Industry Revenue (billion), by Technology 2025 & 2033
- Figure 24: Europe Industrial Radiography Equipment Industry Volume (K Unit), by Technology 2025 & 2033
- Figure 25: Europe Industrial Radiography Equipment Industry Revenue Share (%), by Technology 2025 & 2033
- Figure 26: Europe Industrial Radiography Equipment Industry Volume Share (%), by Technology 2025 & 2033
- Figure 27: Europe Industrial Radiography Equipment Industry Revenue (billion), by End-user Industry 2025 & 2033
- Figure 28: Europe Industrial Radiography Equipment Industry Volume (K Unit), by End-user Industry 2025 & 2033
- Figure 29: Europe Industrial Radiography Equipment Industry Revenue Share (%), by End-user Industry 2025 & 2033
- Figure 30: Europe Industrial Radiography Equipment Industry Volume Share (%), by End-user Industry 2025 & 2033
- Figure 31: Europe Industrial Radiography Equipment Industry Revenue (billion), by Country 2025 & 2033
- Figure 32: Europe Industrial Radiography Equipment Industry Volume (K Unit), by Country 2025 & 2033
- Figure 33: Europe Industrial Radiography Equipment Industry Revenue Share (%), by Country 2025 & 2033
- Figure 34: Europe Industrial Radiography Equipment Industry Volume Share (%), by Country 2025 & 2033
- Figure 35: Asia Pacific Industrial Radiography Equipment Industry Revenue (billion), by Offering 2025 & 2033
- Figure 36: Asia Pacific Industrial Radiography Equipment Industry Volume (K Unit), by Offering 2025 & 2033
- Figure 37: Asia Pacific Industrial Radiography Equipment Industry Revenue Share (%), by Offering 2025 & 2033
- Figure 38: Asia Pacific Industrial Radiography Equipment Industry Volume Share (%), by Offering 2025 & 2033
- Figure 39: Asia Pacific Industrial Radiography Equipment Industry Revenue (billion), by Technology 2025 & 2033
- Figure 40: Asia Pacific Industrial Radiography Equipment Industry Volume (K Unit), by Technology 2025 & 2033
- Figure 41: Asia Pacific Industrial Radiography Equipment Industry Revenue Share (%), by Technology 2025 & 2033
- Figure 42: Asia Pacific Industrial Radiography Equipment Industry Volume Share (%), by Technology 2025 & 2033
- Figure 43: Asia Pacific Industrial Radiography Equipment Industry Revenue (billion), by End-user Industry 2025 & 2033
- Figure 44: Asia Pacific Industrial Radiography Equipment Industry Volume (K Unit), by End-user Industry 2025 & 2033
- Figure 45: Asia Pacific Industrial Radiography Equipment Industry Revenue Share (%), by End-user Industry 2025 & 2033
- Figure 46: Asia Pacific Industrial Radiography Equipment Industry Volume Share (%), by End-user Industry 2025 & 2033
- Figure 47: Asia Pacific Industrial Radiography Equipment Industry Revenue (billion), by Country 2025 & 2033
- Figure 48: Asia Pacific Industrial Radiography Equipment Industry Volume (K Unit), by Country 2025 & 2033
- Figure 49: Asia Pacific Industrial Radiography Equipment Industry Revenue Share (%), by Country 2025 & 2033
- Figure 50: Asia Pacific Industrial Radiography Equipment Industry Volume Share (%), by Country 2025 & 2033
- Figure 51: Latin America Industrial Radiography Equipment Industry Revenue (billion), by Offering 2025 & 2033
- Figure 52: Latin America Industrial Radiography Equipment Industry Volume (K Unit), by Offering 2025 & 2033
- Figure 53: Latin America Industrial Radiography Equipment Industry Revenue Share (%), by Offering 2025 & 2033
- Figure 54: Latin America Industrial Radiography Equipment Industry Volume Share (%), by Offering 2025 & 2033
- Figure 55: Latin America Industrial Radiography Equipment Industry Revenue (billion), by Technology 2025 & 2033
- Figure 56: Latin America Industrial Radiography Equipment Industry Volume (K Unit), by Technology 2025 & 2033
- Figure 57: Latin America Industrial Radiography Equipment Industry Revenue Share (%), by Technology 2025 & 2033
- Figure 58: Latin America Industrial Radiography Equipment Industry Volume Share (%), by Technology 2025 & 2033
- Figure 59: Latin America Industrial Radiography Equipment Industry Revenue (billion), by End-user Industry 2025 & 2033
- Figure 60: Latin America Industrial Radiography Equipment Industry Volume (K Unit), by End-user Industry 2025 & 2033
- Figure 61: Latin America Industrial Radiography Equipment Industry Revenue Share (%), by End-user Industry 2025 & 2033
- Figure 62: Latin America Industrial Radiography Equipment Industry Volume Share (%), by End-user Industry 2025 & 2033
- Figure 63: Latin America Industrial Radiography Equipment Industry Revenue (billion), by Country 2025 & 2033
- Figure 64: Latin America Industrial Radiography Equipment Industry Volume (K Unit), by Country 2025 & 2033
- Figure 65: Latin America Industrial Radiography Equipment Industry Revenue Share (%), by Country 2025 & 2033
- Figure 66: Latin America Industrial Radiography Equipment Industry Volume Share (%), by Country 2025 & 2033
- Figure 67: Middle East and Africa Industrial Radiography Equipment Industry Revenue (billion), by Offering 2025 & 2033
- Figure 68: Middle East and Africa Industrial Radiography Equipment Industry Volume (K Unit), by Offering 2025 & 2033
- Figure 69: Middle East and Africa Industrial Radiography Equipment Industry Revenue Share (%), by Offering 2025 & 2033
- Figure 70: Middle East and Africa Industrial Radiography Equipment Industry Volume Share (%), by Offering 2025 & 2033
- Figure 71: Middle East and Africa Industrial Radiography Equipment Industry Revenue (billion), by Technology 2025 & 2033
- Figure 72: Middle East and Africa Industrial Radiography Equipment Industry Volume (K Unit), by Technology 2025 & 2033
- Figure 73: Middle East and Africa Industrial Radiography Equipment Industry Revenue Share (%), by Technology 2025 & 2033
- Figure 74: Middle East and Africa Industrial Radiography Equipment Industry Volume Share (%), by Technology 2025 & 2033
- Figure 75: Middle East and Africa Industrial Radiography Equipment Industry Revenue (billion), by End-user Industry 2025 & 2033
- Figure 76: Middle East and Africa Industrial Radiography Equipment Industry Volume (K Unit), by End-user Industry 2025 & 2033
- Figure 77: Middle East and Africa Industrial Radiography Equipment Industry Revenue Share (%), by End-user Industry 2025 & 2033
- Figure 78: Middle East and Africa Industrial Radiography Equipment Industry Volume Share (%), by End-user Industry 2025 & 2033
- Figure 79: Middle East and Africa Industrial Radiography Equipment Industry Revenue (billion), by Country 2025 & 2033
- Figure 80: Middle East and Africa Industrial Radiography Equipment Industry Volume (K Unit), by Country 2025 & 2033
- Figure 81: Middle East and Africa Industrial Radiography Equipment Industry Revenue Share (%), by Country 2025 & 2033
- Figure 82: Middle East and Africa Industrial Radiography Equipment Industry Volume Share (%), by Country 2025 & 2033
List of Tables
- Table 1: Global Industrial Radiography Equipment Industry Revenue billion Forecast, by Offering 2020 & 2033
- Table 2: Global Industrial Radiography Equipment Industry Volume K Unit Forecast, by Offering 2020 & 2033
- Table 3: Global Industrial Radiography Equipment Industry Revenue billion Forecast, by Technology 2020 & 2033
- Table 4: Global Industrial Radiography Equipment Industry Volume K Unit Forecast, by Technology 2020 & 2033
- Table 5: Global Industrial Radiography Equipment Industry Revenue billion Forecast, by End-user Industry 2020 & 2033
- Table 6: Global Industrial Radiography Equipment Industry Volume K Unit Forecast, by End-user Industry 2020 & 2033
- Table 7: Global Industrial Radiography Equipment Industry Revenue billion Forecast, by Region 2020 & 2033
- Table 8: Global Industrial Radiography Equipment Industry Volume K Unit Forecast, by Region 2020 & 2033
- Table 9: Global Industrial Radiography Equipment Industry Revenue billion Forecast, by Offering 2020 & 2033
- Table 10: Global Industrial Radiography Equipment Industry Volume K Unit Forecast, by Offering 2020 & 2033
- Table 11: Global Industrial Radiography Equipment Industry Revenue billion Forecast, by Technology 2020 & 2033
- Table 12: Global Industrial Radiography Equipment Industry Volume K Unit Forecast, by Technology 2020 & 2033
- Table 13: Global Industrial Radiography Equipment Industry Revenue billion Forecast, by End-user Industry 2020 & 2033
- Table 14: Global Industrial Radiography Equipment Industry Volume K Unit Forecast, by End-user Industry 2020 & 2033
- Table 15: Global Industrial Radiography Equipment Industry Revenue billion Forecast, by Country 2020 & 2033
- Table 16: Global Industrial Radiography Equipment Industry Volume K Unit Forecast, by Country 2020 & 2033
- Table 17: Global Industrial Radiography Equipment Industry Revenue billion Forecast, by Offering 2020 & 2033
- Table 18: Global Industrial Radiography Equipment Industry Volume K Unit Forecast, by Offering 2020 & 2033
- Table 19: Global Industrial Radiography Equipment Industry Revenue billion Forecast, by Technology 2020 & 2033
- Table 20: Global Industrial Radiography Equipment Industry Volume K Unit Forecast, by Technology 2020 & 2033
- Table 21: Global Industrial Radiography Equipment Industry Revenue billion Forecast, by End-user Industry 2020 & 2033
- Table 22: Global Industrial Radiography Equipment Industry Volume K Unit Forecast, by End-user Industry 2020 & 2033
- Table 23: Global Industrial Radiography Equipment Industry Revenue billion Forecast, by Country 2020 & 2033
- Table 24: Global Industrial Radiography Equipment Industry Volume K Unit Forecast, by Country 2020 & 2033
- Table 25: Global Industrial Radiography Equipment Industry Revenue billion Forecast, by Offering 2020 & 2033
- Table 26: Global Industrial Radiography Equipment Industry Volume K Unit Forecast, by Offering 2020 & 2033
- Table 27: Global Industrial Radiography Equipment Industry Revenue billion Forecast, by Technology 2020 & 2033
- Table 28: Global Industrial Radiography Equipment Industry Volume K Unit Forecast, by Technology 2020 & 2033
- Table 29: Global Industrial Radiography Equipment Industry Revenue billion Forecast, by End-user Industry 2020 & 2033
- Table 30: Global Industrial Radiography Equipment Industry Volume K Unit Forecast, by End-user Industry 2020 & 2033
- Table 31: Global Industrial Radiography Equipment Industry Revenue billion Forecast, by Country 2020 & 2033
- Table 32: Global Industrial Radiography Equipment Industry Volume K Unit Forecast, by Country 2020 & 2033
- Table 33: Global Industrial Radiography Equipment Industry Revenue billion Forecast, by Offering 2020 & 2033
- Table 34: Global Industrial Radiography Equipment Industry Volume K Unit Forecast, by Offering 2020 & 2033
- Table 35: Global Industrial Radiography Equipment Industry Revenue billion Forecast, by Technology 2020 & 2033
- Table 36: Global Industrial Radiography Equipment Industry Volume K Unit Forecast, by Technology 2020 & 2033
- Table 37: Global Industrial Radiography Equipment Industry Revenue billion Forecast, by End-user Industry 2020 & 2033
- Table 38: Global Industrial Radiography Equipment Industry Volume K Unit Forecast, by End-user Industry 2020 & 2033
- Table 39: Global Industrial Radiography Equipment Industry Revenue billion Forecast, by Country 2020 & 2033
- Table 40: Global Industrial Radiography Equipment Industry Volume K Unit Forecast, by Country 2020 & 2033
- Table 41: Global Industrial Radiography Equipment Industry Revenue billion Forecast, by Offering 2020 & 2033
- Table 42: Global Industrial Radiography Equipment Industry Volume K Unit Forecast, by Offering 2020 & 2033
- Table 43: Global Industrial Radiography Equipment Industry Revenue billion Forecast, by Technology 2020 & 2033
- Table 44: Global Industrial Radiography Equipment Industry Volume K Unit Forecast, by Technology 2020 & 2033
- Table 45: Global Industrial Radiography Equipment Industry Revenue billion Forecast, by End-user Industry 2020 & 2033
- Table 46: Global Industrial Radiography Equipment Industry Volume K Unit Forecast, by End-user Industry 2020 & 2033
- Table 47: Global Industrial Radiography Equipment Industry Revenue billion Forecast, by Country 2020 & 2033
- Table 48: Global Industrial Radiography Equipment Industry Volume K Unit Forecast, by Country 2020 & 2033
Frequently Asked Questions
1. What is the projected Compound Annual Growth Rate (CAGR) of the Industrial Radiography Equipment Industry?
The projected CAGR is approximately 8.6%.
2. Which companies are prominent players in the Industrial Radiography Equipment Industry?
Key companies in the market include Bosello High Technology SRL, Canon Inc, Nikon Corporation, L3Harris Security & Detection Systems, Vidisco Ltd, Dürr NDT Gmbh & Co KG, Teledyne Dalsa Inc, North Star Imaging Inc, YXLON International, Hamamatsu Photonics K K, Carestream Health Inc, Hitachi Ltd, General Electric Company, Olympus Corporation, Rigaku Corporation.
3. What are the main segments of the Industrial Radiography Equipment Industry?
The market segments include Offering, Technology, End-user Industry.
4. Can you provide details about the market size?
The market size is estimated to be USD 1.35 billion as of 2022.
5. What are some drivers contributing to market growth?
; Growing Demand for Portable and Miniaturized Equipment; Recovering Demand from the Oil and Gas Industry.
6. What are the notable trends driving market growth?
Recovering Demand from Oil and Gas Industry will Drive the Market.
7. Are there any restraints impacting market growth?
Lack in Awareness.
8. Can you provide examples of recent developments in the market?
N/A
9. What pricing options are available for accessing the report?
Pricing options include single-user, multi-user, and enterprise licenses priced at USD 4750, USD 5250, and USD 8750 respectively.
10. Is the market size provided in terms of value or volume?
The market size is provided in terms of value, measured in billion and volume, measured in K Unit.
11. Are there any specific market keywords associated with the report?
Yes, the market keyword associated with the report is "Industrial Radiography Equipment Industry," which aids in identifying and referencing the specific market segment covered.
12. How do I determine which pricing option suits my needs best?
The pricing options vary based on user requirements and access needs. Individual users may opt for single-user licenses, while businesses requiring broader access may choose multi-user or enterprise licenses for cost-effective access to the report.
13. Are there any additional resources or data provided in the Industrial Radiography Equipment Industry report?
While the report offers comprehensive insights, it's advisable to review the specific contents or supplementary materials provided to ascertain if additional resources or data are available.
14. How can I stay updated on further developments or reports in the Industrial Radiography Equipment Industry?
To stay informed about further developments, trends, and reports in the Industrial Radiography Equipment Industry, consider subscribing to industry newsletters, following relevant companies and organizations, or regularly checking reputable industry news sources and publications.
Methodology
Step 1 - Identification of Relevant Samples Size from Population Database


Step 2 - Approaches for Defining Global Market Size (Value, Volume* & Price*)

Note*: In applicable scenarios
Step 3 - Data Sources
Primary Research
- Web Analytics
- Survey Reports
- Research Institute
- Latest Research Reports
- Opinion Leaders
Secondary Research
- Annual Reports
- White Paper
- Latest Press Release
- Industry Association
- Paid Database
- Investor Presentations

Step 4 - Data Triangulation
Involves using different sources of information in order to increase the validity of a study
These sources are likely to be stakeholders in a program - participants, other researchers, program staff, other community members, and so on.
Then we put all data in single framework & apply various statistical tools to find out the dynamic on the market.
During the analysis stage, feedback from the stakeholder groups would be compared to determine areas of agreement as well as areas of divergence