

Key Insights
The global Engineering Services Market is projected for robust growth, reaching an estimated $1.67 billion by 2025, with a projected Compound Annual Growth Rate (CAGR) of 4.20% through 2033. This expansion is fueled by several critical drivers. The increasing complexity and scale of infrastructure projects worldwide, coupled with the growing demand for specialized engineering expertise across diverse sectors, are primary catalysts. Furthermore, the ongoing digital transformation and the adoption of advanced technologies like AI, IoT, and big data analytics in engineering processes are creating new avenues for growth. Industries such as Aerospace and Defense, Automotive, and Electric Power Generation are significantly investing in R&D and innovative engineering solutions, contributing to market expansion. The rise of smart cities and sustainable development initiatives also necessitates advanced engineering services for planning, design, and execution. The market is further propelled by the need for enhanced operational efficiency, cost optimization, and compliance with stringent regulatory standards in various industrial applications.
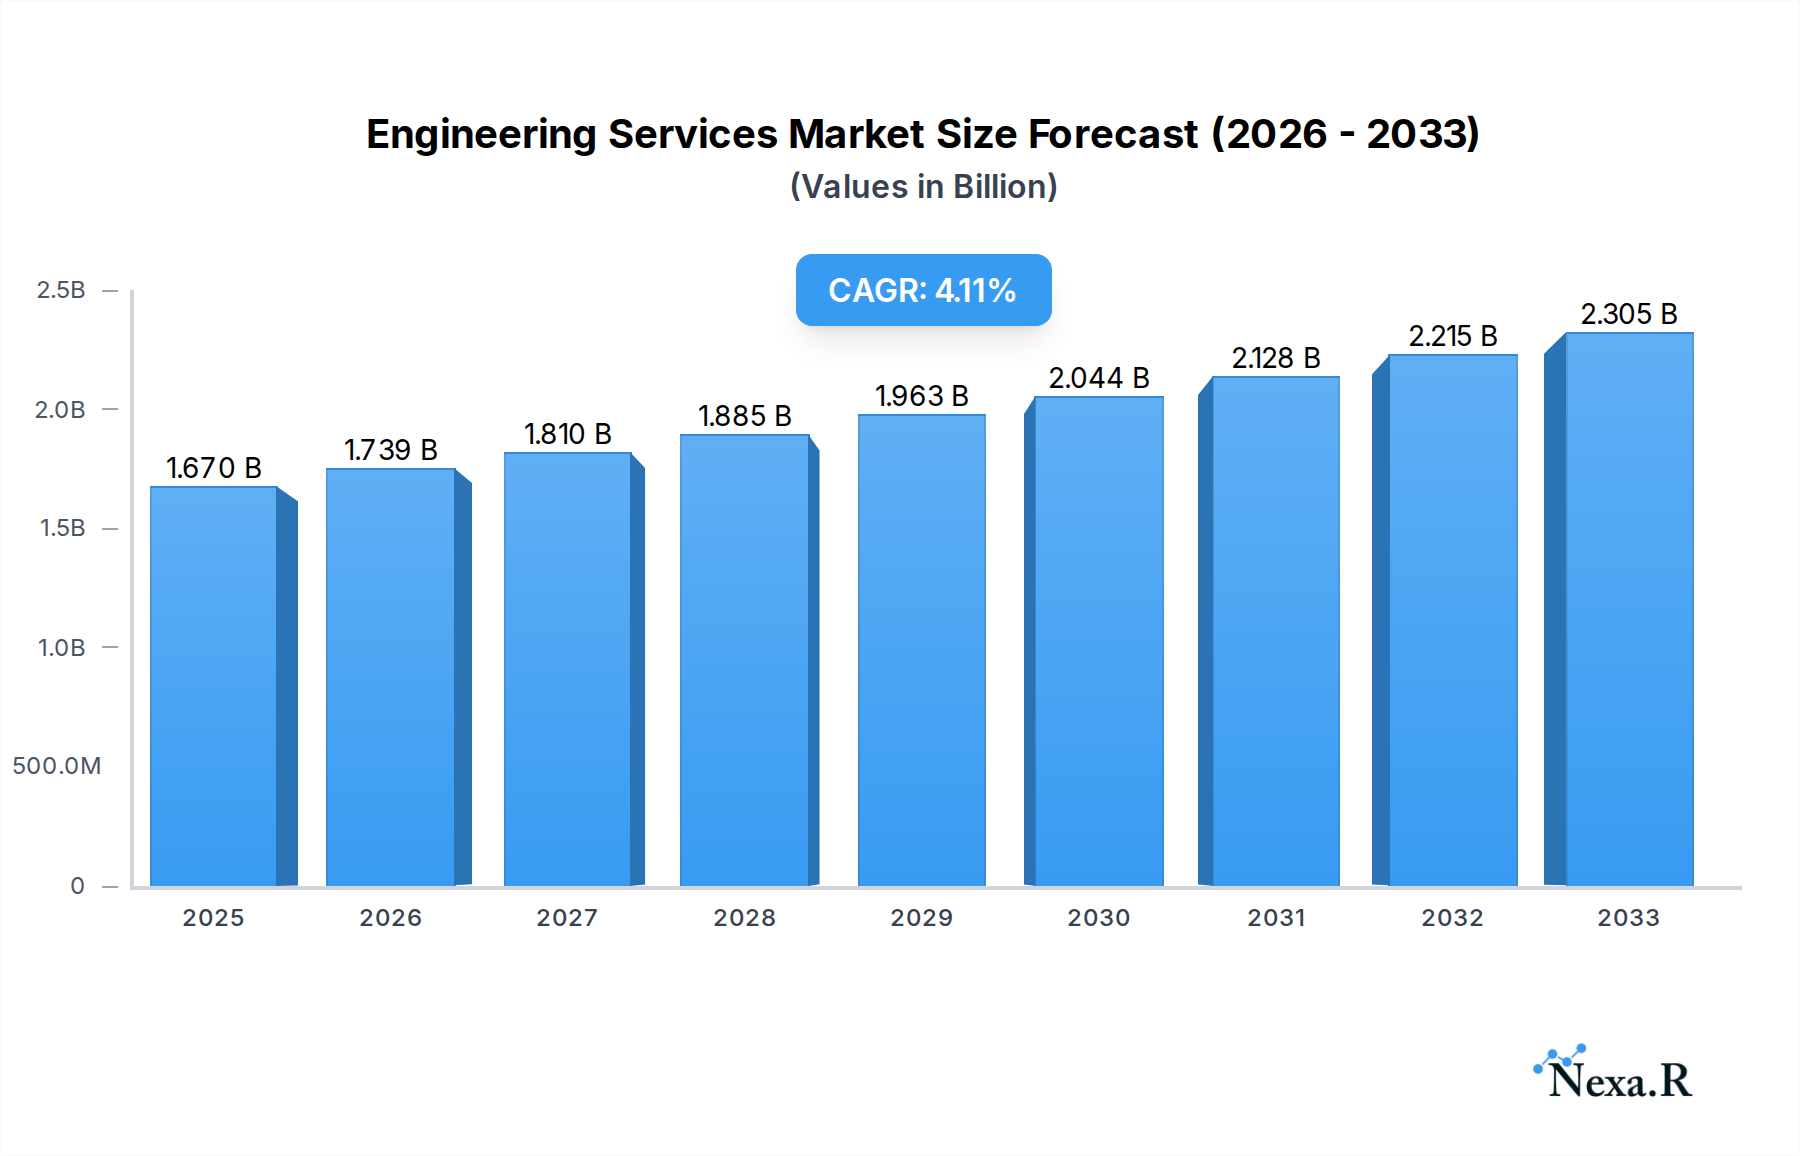
Engineering Services Market Market Size (In Billion)
Key trends shaping the Engineering Services Market include the increasing preference for offshore and onsite delivery models, offering flexibility and cost-effectiveness to clients. The growing emphasis on product engineering and process optimization across industries underscores the demand for specialized services. Automation-related services are gaining significant traction as businesses aim to streamline operations and improve productivity. Asset management services are also becoming crucial for maintaining and optimizing the lifecycle of industrial assets, particularly in sectors like Oil and Gas and Electric Power Generation. Geographically, North America and Europe are leading markets, driven by substantial investments in infrastructure and technological advancements. The Asia Pacific region is expected to witness the fastest growth due to rapid industrialization and increasing foreign direct investment. While opportunities are abundant, certain restraints such as the shortage of skilled engineering talent and the high cost of advanced technology adoption could pose challenges.

Engineering Services Market Company Market Share
Unlock critical insights into the dynamic global engineering services market. This comprehensive report delves into market segmentation, growth drivers, regional dominance, and future trends, providing an indispensable resource for stakeholders seeking to navigate and capitalize on this rapidly evolving industry. Explore parent and child market dynamics with in-depth analysis and quantitative data.
Engineering Services Market Market Dynamics & Structure
The engineering services market is characterized by a moderately concentrated landscape, with a blend of large multinational corporations and specialized niche players. Technological innovation is a primary driver, fueled by advancements in AI, IoT, and digital twins, which are transforming how engineering solutions are developed and delivered. Regulatory frameworks, particularly those related to safety, environmental compliance, and data privacy, significantly influence market entry and operational strategies. Competitive product substitutes, such as in-house engineering departments or readily available off-the-shelf software, present a continuous challenge, requiring service providers to emphasize value-added expertise and bespoke solutions. End-user demographics are increasingly sophisticated, demanding faster turnaround times, greater cost-efficiency, and sustainable engineering practices. Mergers and acquisitions (M&A) are prevalent, driven by the pursuit of market expansion, technological acquisition, and synergistic integration. The estimated total market size in 2025 is valued at $380,500 Million.
- Market Concentration: Dominated by a few key players, but with significant room for specialized service providers.
- Technological Innovation: Driven by digital transformation, automation, and advanced simulation tools.
- Regulatory Impact: Stringent standards in aerospace, nuclear, and chemical industries shape service offerings.
- Competitive Landscape: Intense competition from established firms and emerging technology startups.
- M&A Activity: Strategic acquisitions to gain market share, talent, and technological capabilities.
Engineering Services Market Growth Trends & Insights
The engineering services market is poised for robust expansion, projected to grow at a Compound Annual Growth Rate (CAGR) of 7.2% from 2025 to 2033, reaching an estimated market size of $650,000 Million by the end of the forecast period. This growth is underpinned by increasing global infrastructure development, the imperative for digital transformation across industries, and the growing demand for specialized engineering expertise. Adoption rates for advanced engineering software, including AI-powered design tools and cloud-based collaboration platforms, are accelerating, leading to enhanced efficiency and reduced project timelines. Technological disruptions, such as the rise of generative design and the increasing application of the Industrial Internet of Things (IIoT) in process optimization, are reshaping service offerings. Consumer behavior shifts are evident, with clients prioritizing sustainability, resilience, and data-driven decision-making in their engineering project requirements. The market penetration of specialized engineering services, particularly in areas like renewable energy and smart city development, is expected to surge.
- Market Size Evolution: Significant growth driven by global infrastructure spending and technological adoption.
- Adoption Rates: Rapid uptake of digital engineering tools and cloud-based collaboration platforms.
- Technological Disruptions: Impact of AI, IIoT, and digital twins on service delivery and innovation.
- Consumer Behavior Shifts: Increased demand for sustainable, resilient, and data-informed engineering solutions.
- Market Penetration: Growing adoption of specialized services in emerging sectors like renewable energy.
Dominant Regions, Countries, or Segments in Engineering Services Market
North America, specifically the United States engineering services market, currently holds the dominant position in the global engineering services market. This leadership is attributed to a mature industrial base, substantial government investment in infrastructure projects, and a strong emphasis on technological innovation across key industries like Aerospace and Defense, Automotive, and Electric Power Generation. The Civil engineering discipline is a significant contributor to this dominance, driven by ongoing transportation upgrades, urban development, and the need for resilient infrastructure against climate change. Furthermore, the robust presence of major players like Bechtel Corporation, AECOM Engineering Company, and Kiewit Corporation reinforces North America's market leadership. The Onsite delivery model remains prevalent due to the hands-on nature of many large-scale projects and client preferences for direct oversight.
- Dominant Region: North America, with the USA leading due to infrastructure investment and technological advancements.
- Key Engineering Discipline: Civil engineering is a primary growth driver, fueled by infrastructure modernization and climate adaptation projects.
- Leading Industries: Aerospace and Defense, Automotive, and Electric Power Generation are significant markets in the region.
- Delivery Model Preference: Onsite delivery model is favored for its direct oversight and project specificity.
- Market Share Potential: Continued growth is anticipated due to ongoing public and private sector investments.
The Automotive industry is a critical segment, experiencing substantial growth driven by the transition to electric vehicles (EVs) and autonomous driving technologies, demanding advanced Product Engineering and Automation Related Services. The Aerospace and Defense sector also remains a powerhouse, requiring intricate Process Engineering and specialized expertise.
- Automotive Sector Growth: Driven by EV transition and autonomous technology development, boosting demand for product and automation services.
- Aerospace & Defense Demand: Continued need for complex process engineering and specialized design solutions.
- Electric Power Generation: Expansion of renewable energy sources fuels demand for grid modernization and infrastructure engineering.
- Oil and Gas Sector Dynamics: Investment in efficiency and decarbonization creates opportunities for specialized engineering services.
- Pharmaceuticals Industry: Growing focus on drug development and manufacturing automation requires advanced engineering solutions.
Engineering Services Market Product Landscape
The engineering services market is witnessing a surge in innovative solutions, with a focus on digital integration and sustainability. Companies are offering advanced Product Engineering services that leverage AI-driven design optimization and simulation, leading to lighter, more efficient, and cost-effective products across industries like Automotive and Aerospace. Process Engineering innovations are centered around enhancing operational efficiency, reducing waste, and improving safety through sophisticated modeling and digital twin technology. Automation Related Services are becoming indispensable, with the deployment of robotics and smart manufacturing systems transforming production lines. Asset Management Related Services are evolving to incorporate predictive maintenance powered by IoT data, significantly extending the lifespan and performance of critical infrastructure. These advancements translate into tangible benefits such as reduced lead times, enhanced product performance, and optimized operational costs.
Key Drivers, Barriers & Challenges in Engineering Services Market
The engineering services market is propelled by several key drivers. The increasing global demand for infrastructure development, especially in emerging economies, coupled with the necessity for digital transformation across all industries, significantly boosts the need for specialized engineering expertise. Technological advancements, including AI, IoT, and advanced simulation software, enable more efficient and innovative service delivery. Government initiatives supporting sustainable development and clean energy further accelerate market growth.
However, the market faces significant barriers and challenges. A persistent shortage of skilled engineering talent poses a major constraint. Intense competition and price pressures can impact profitability. Stringent and evolving regulatory environments in certain sectors can increase compliance costs and complexity. Furthermore, supply chain disruptions, as witnessed in recent years, can delay project timelines and increase material costs, impacting project feasibility.
Emerging Opportunities in Engineering Services Market
Emerging opportunities in the engineering services market are abundant, particularly within the rapidly expanding renewable energy sector, including solar, wind, and battery storage solutions. The growing adoption of smart city technologies and the development of sustainable urban infrastructure present a vast untapped market. Furthermore, the increasing focus on decarbonization and circular economy principles across industries is creating demand for specialized environmental engineering services and green manufacturing solutions. The integration of advanced analytics and AI in predictive maintenance and operational optimization for existing assets also offers significant growth potential.
Growth Accelerators in the Engineering Services Market Industry
Catalysts driving long-term growth in the engineering services market industry include significant investments in digital transformation initiatives by businesses worldwide. Strategic partnerships between engineering firms and technology providers are accelerating the development and adoption of cutting-edge solutions. Market expansion strategies, particularly into emerging economies with burgeoning infrastructure needs, are also crucial growth accelerators. The increasing focus on sustainability and the global push towards net-zero emissions are creating a sustained demand for green engineering solutions and expertise.
Key Players Shaping the Engineering Services Market Market
- Barton Malow
- Bechtel Corporation
- Gilbane Building Company
- Brasfield & Gorrie LLC
- Jones Lang LaSalle Incorporated
- Kiewit Corporation
- STRABAG SE
- Balfour Beatty Inc
- Nearby Engineers
- NV5 Global Inc
- WSP Global Inc
- AECOM Engineering company
- RMF Engineering Inc
Notable Milestones in Engineering Services Market Sector
- February 2023: SCF Partners announced its investment in Global E&C, a differentiated engineering, maintenance, modification, and commissioning business mainly focused on servicing the offshore energy sector. The investment is expected to significantly bolster GEC's ability to assist the evolving energy markets and enhance the growth of its digital and decarbonization offerings.
- January 2023: L&T Technology Services Limited announced its selection as a strategic engineering partner to Airbus for providing advanced engineering capabilities and digital manufacturing services under a multi-year contract.
- January 2023: WSP Global announced the acquisition of Enstruct, a 75-employee structural engineering company renowned for designing and providing quality building projects across Australia.
In-Depth Engineering Services Market Market Outlook
The future outlook for the engineering services market is exceptionally promising, driven by sustained global demand for infrastructure modernization, the relentless pursuit of digital transformation, and the urgent need for sustainable solutions. Growth accelerators such as technological breakthroughs in AI and automation, coupled with strategic partnerships that foster innovation, will continue to shape the market. Key opportunities lie in emerging sectors like renewable energy, smart cities, and advanced manufacturing. Companies that can adeptly navigate evolving regulatory landscapes and address the talent gap will be well-positioned for significant growth and market leadership in the coming years.
Engineering Services Market Segmentation
-
1. Engineering Disciplines
- 1.1. Civil
- 1.2. Mechanical
- 1.3. Electrical
- 1.4. Piping and Structural
-
2. Delivery Model
- 2.1. Offshore
- 2.2. Onsite
-
3. Services
- 3.1. Product Engineering
- 3.2. Process Engineering
- 3.3. Automation Related Services
- 3.4. Asset Management Related Services
-
4. Industries
- 4.1. Aerospace and Defense
- 4.2. Automotive
- 4.3. Chemical and Petrochemical
- 4.4. Electric Power Generation
- 4.5. Municipal Utility Projects
- 4.6. Mining
- 4.7. Oil and Gas
- 4.8. Pharmaceuticals
- 4.9. Transportation
- 4.10. Telecommunications
- 4.11. Nuclear Projects
- 4.12. Other Industries
Engineering Services Market Segmentation By Geography
-
1. North America
- 1.1. United States
- 1.2. Canada
-
2. Europe
- 2.1. Germany
- 2.2. United Kingdom
- 2.3. France
- 2.4. Spain
- 2.5. Rest of Europe
-
3. Asia Pacific
- 3.1. China
- 3.2. Japan
- 3.3. India
- 3.4. Rest of Asia Pacific
-
4. Latin America
- 4.1. Brazil
- 4.2. Argentina
- 4.3. Rest of Latin America
-
5. Middle East and Africa
- 5.1. United Arab Emirates
- 5.2. Saudi Arabia
- 5.3. South Africa
- 5.4. Rest of Middle East and Africa
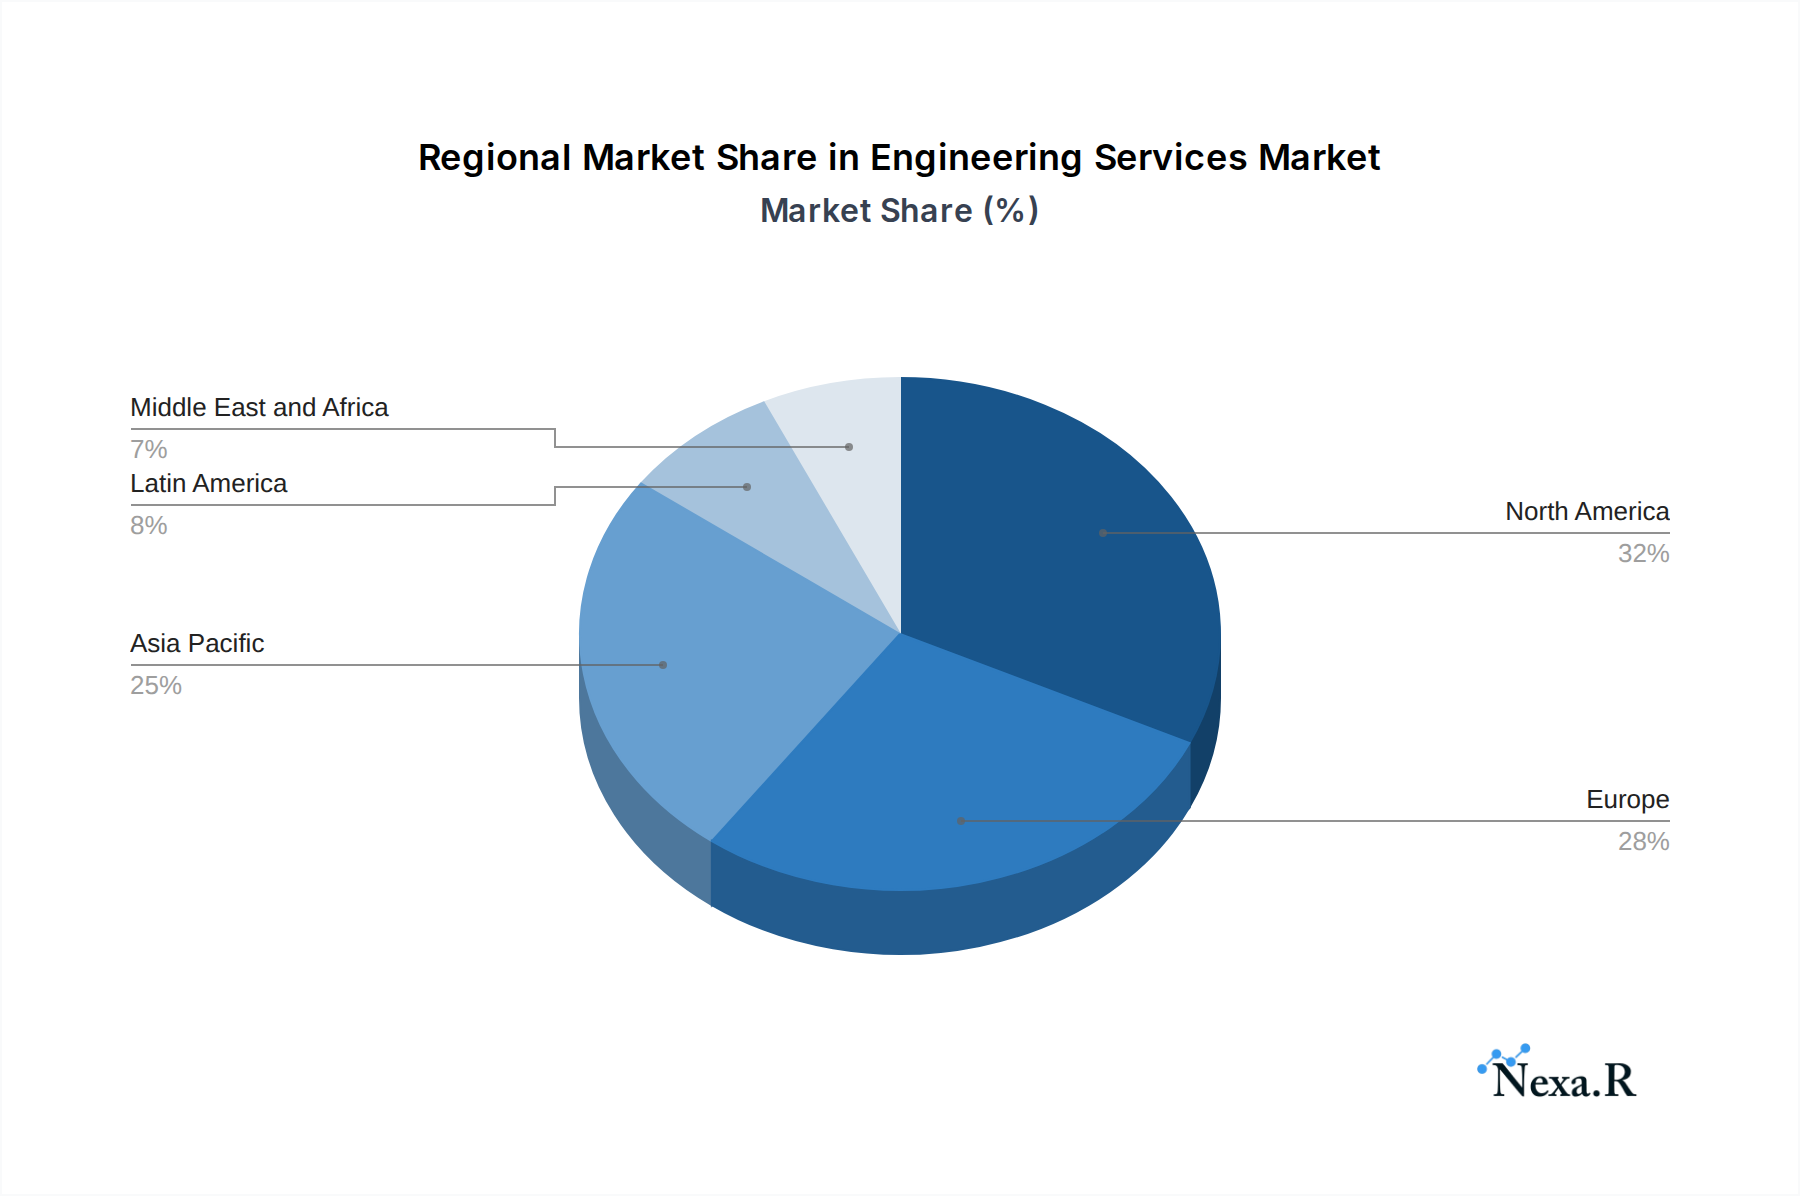
Engineering Services Market Regional Market Share
Geographic Coverage of Engineering Services Market
Engineering Services Market REPORT HIGHLIGHTS
| Aspects | Details |
|---|---|
| Study Period | 2020-2034 |
| Base Year | 2025 |
| Estimated Year | 2026 |
| Forecast Period | 2026-2034 |
| Historical Period | 2020-2025 |
| Growth Rate | CAGR of 4.20% from 2020-2034 |
| Segmentation |
|
Table of Contents
- 1. Introduction
- 1.1. Research Scope
- 1.2. Market Segmentation
- 1.3. Research Objective
- 1.4. Definitions and Assumptions
- 2. Executive Summary
- 2.1. Market Snapshot
- 3. Market Dynamics
- 3.1. Market Drivers
- 3.2. Market Restrains
- 3.3. Market Trends
- 3.4. Market Opportunities
- 4. Market Factor Analysis
- 4.1. Porters Five Forces
- 4.1.1. Bargaining Power of Suppliers
- 4.1.2. Bargaining Power of Buyers
- 4.1.3. Threat of New Entrants
- 4.1.4. Threat of Substitutes
- 4.1.5. Competitive Rivalry
- 4.2. PESTEL analysis
- 4.3. BCG Analysis
- 4.3.1. Stars (High Growth, High Market Share)
- 4.3.2. Cash Cows (Low Growth, High Market Share)
- 4.3.3. Question Mark (High Growth, Low Market Share)
- 4.3.4. Dogs (Low Growth, Low Market Share)
- 4.4. Ansoff Matrix Analysis
- 4.5. Supply Chain Analysis
- 4.6. Regulatory Landscape
- 4.7. Current Market Potential and Opportunity Assessment (TAM–SAM–SOM Framework)
- 4.8. NRP Analyst Note
- 4.1. Porters Five Forces
- 5. Market Analysis, Insights and Forecast 2021-2033
- 5.1. Market Analysis, Insights and Forecast - by Engineering Disciplines
- 5.1.1. Civil
- 5.1.2. Mechanical
- 5.1.3. Electrical
- 5.1.4. Piping and Structural
- 5.2. Market Analysis, Insights and Forecast - by Delivery Model
- 5.2.1. Offshore
- 5.2.2. Onsite
- 5.3. Market Analysis, Insights and Forecast - by Services
- 5.3.1. Product Engineering
- 5.3.2. Process Engineering
- 5.3.3. Automation Related Services
- 5.3.4. Asset Management Related Services
- 5.4. Market Analysis, Insights and Forecast - by Industries
- 5.4.1. Aerospace and Defense
- 5.4.2. Automotive
- 5.4.3. Chemical and Petrochemical
- 5.4.4. Electric Power Generation
- 5.4.5. Municipal Utility Projects
- 5.4.6. Mining
- 5.4.7. Oil and Gas
- 5.4.8. Pharmaceuticals
- 5.4.9. Transportation
- 5.4.10. Telecommunications
- 5.4.11. Nuclear Projects
- 5.4.12. Other Industries
- 5.5. Market Analysis, Insights and Forecast - by Region
- 5.5.1. North America
- 5.5.2. Europe
- 5.5.3. Asia Pacific
- 5.5.4. Latin America
- 5.5.5. Middle East and Africa
- 5.1. Market Analysis, Insights and Forecast - by Engineering Disciplines
- 6. Global Engineering Services Market Analysis, Insights and Forecast, 2021-2033
- 6.1. Market Analysis, Insights and Forecast - by Engineering Disciplines
- 6.1.1. Civil
- 6.1.2. Mechanical
- 6.1.3. Electrical
- 6.1.4. Piping and Structural
- 6.2. Market Analysis, Insights and Forecast - by Delivery Model
- 6.2.1. Offshore
- 6.2.2. Onsite
- 6.3. Market Analysis, Insights and Forecast - by Services
- 6.3.1. Product Engineering
- 6.3.2. Process Engineering
- 6.3.3. Automation Related Services
- 6.3.4. Asset Management Related Services
- 6.4. Market Analysis, Insights and Forecast - by Industries
- 6.4.1. Aerospace and Defense
- 6.4.2. Automotive
- 6.4.3. Chemical and Petrochemical
- 6.4.4. Electric Power Generation
- 6.4.5. Municipal Utility Projects
- 6.4.6. Mining
- 6.4.7. Oil and Gas
- 6.4.8. Pharmaceuticals
- 6.4.9. Transportation
- 6.4.10. Telecommunications
- 6.4.11. Nuclear Projects
- 6.4.12. Other Industries
- 6.1. Market Analysis, Insights and Forecast - by Engineering Disciplines
- 7. North America Engineering Services Market Analysis, Insights and Forecast, 2020-2032
- 7.1. Market Analysis, Insights and Forecast - by Engineering Disciplines
- 7.1.1. Civil
- 7.1.2. Mechanical
- 7.1.3. Electrical
- 7.1.4. Piping and Structural
- 7.2. Market Analysis, Insights and Forecast - by Delivery Model
- 7.2.1. Offshore
- 7.2.2. Onsite
- 7.3. Market Analysis, Insights and Forecast - by Services
- 7.3.1. Product Engineering
- 7.3.2. Process Engineering
- 7.3.3. Automation Related Services
- 7.3.4. Asset Management Related Services
- 7.4. Market Analysis, Insights and Forecast - by Industries
- 7.4.1. Aerospace and Defense
- 7.4.2. Automotive
- 7.4.3. Chemical and Petrochemical
- 7.4.4. Electric Power Generation
- 7.4.5. Municipal Utility Projects
- 7.4.6. Mining
- 7.4.7. Oil and Gas
- 7.4.8. Pharmaceuticals
- 7.4.9. Transportation
- 7.4.10. Telecommunications
- 7.4.11. Nuclear Projects
- 7.4.12. Other Industries
- 7.1. Market Analysis, Insights and Forecast - by Engineering Disciplines
- 8. Europe Engineering Services Market Analysis, Insights and Forecast, 2020-2032
- 8.1. Market Analysis, Insights and Forecast - by Engineering Disciplines
- 8.1.1. Civil
- 8.1.2. Mechanical
- 8.1.3. Electrical
- 8.1.4. Piping and Structural
- 8.2. Market Analysis, Insights and Forecast - by Delivery Model
- 8.2.1. Offshore
- 8.2.2. Onsite
- 8.3. Market Analysis, Insights and Forecast - by Services
- 8.3.1. Product Engineering
- 8.3.2. Process Engineering
- 8.3.3. Automation Related Services
- 8.3.4. Asset Management Related Services
- 8.4. Market Analysis, Insights and Forecast - by Industries
- 8.4.1. Aerospace and Defense
- 8.4.2. Automotive
- 8.4.3. Chemical and Petrochemical
- 8.4.4. Electric Power Generation
- 8.4.5. Municipal Utility Projects
- 8.4.6. Mining
- 8.4.7. Oil and Gas
- 8.4.8. Pharmaceuticals
- 8.4.9. Transportation
- 8.4.10. Telecommunications
- 8.4.11. Nuclear Projects
- 8.4.12. Other Industries
- 8.1. Market Analysis, Insights and Forecast - by Engineering Disciplines
- 9. Asia Pacific Engineering Services Market Analysis, Insights and Forecast, 2020-2032
- 9.1. Market Analysis, Insights and Forecast - by Engineering Disciplines
- 9.1.1. Civil
- 9.1.2. Mechanical
- 9.1.3. Electrical
- 9.1.4. Piping and Structural
- 9.2. Market Analysis, Insights and Forecast - by Delivery Model
- 9.2.1. Offshore
- 9.2.2. Onsite
- 9.3. Market Analysis, Insights and Forecast - by Services
- 9.3.1. Product Engineering
- 9.3.2. Process Engineering
- 9.3.3. Automation Related Services
- 9.3.4. Asset Management Related Services
- 9.4. Market Analysis, Insights and Forecast - by Industries
- 9.4.1. Aerospace and Defense
- 9.4.2. Automotive
- 9.4.3. Chemical and Petrochemical
- 9.4.4. Electric Power Generation
- 9.4.5. Municipal Utility Projects
- 9.4.6. Mining
- 9.4.7. Oil and Gas
- 9.4.8. Pharmaceuticals
- 9.4.9. Transportation
- 9.4.10. Telecommunications
- 9.4.11. Nuclear Projects
- 9.4.12. Other Industries
- 9.1. Market Analysis, Insights and Forecast - by Engineering Disciplines
- 10. Latin America Engineering Services Market Analysis, Insights and Forecast, 2020-2032
- 10.1. Market Analysis, Insights and Forecast - by Engineering Disciplines
- 10.1.1. Civil
- 10.1.2. Mechanical
- 10.1.3. Electrical
- 10.1.4. Piping and Structural
- 10.2. Market Analysis, Insights and Forecast - by Delivery Model
- 10.2.1. Offshore
- 10.2.2. Onsite
- 10.3. Market Analysis, Insights and Forecast - by Services
- 10.3.1. Product Engineering
- 10.3.2. Process Engineering
- 10.3.3. Automation Related Services
- 10.3.4. Asset Management Related Services
- 10.4. Market Analysis, Insights and Forecast - by Industries
- 10.4.1. Aerospace and Defense
- 10.4.2. Automotive
- 10.4.3. Chemical and Petrochemical
- 10.4.4. Electric Power Generation
- 10.4.5. Municipal Utility Projects
- 10.4.6. Mining
- 10.4.7. Oil and Gas
- 10.4.8. Pharmaceuticals
- 10.4.9. Transportation
- 10.4.10. Telecommunications
- 10.4.11. Nuclear Projects
- 10.4.12. Other Industries
- 10.1. Market Analysis, Insights and Forecast - by Engineering Disciplines
- 11. Middle East and Africa Engineering Services Market Analysis, Insights and Forecast, 2020-2032
- 11.1. Market Analysis, Insights and Forecast - by Engineering Disciplines
- 11.1.1. Civil
- 11.1.2. Mechanical
- 11.1.3. Electrical
- 11.1.4. Piping and Structural
- 11.2. Market Analysis, Insights and Forecast - by Delivery Model
- 11.2.1. Offshore
- 11.2.2. Onsite
- 11.3. Market Analysis, Insights and Forecast - by Services
- 11.3.1. Product Engineering
- 11.3.2. Process Engineering
- 11.3.3. Automation Related Services
- 11.3.4. Asset Management Related Services
- 11.4. Market Analysis, Insights and Forecast - by Industries
- 11.4.1. Aerospace and Defense
- 11.4.2. Automotive
- 11.4.3. Chemical and Petrochemical
- 11.4.4. Electric Power Generation
- 11.4.5. Municipal Utility Projects
- 11.4.6. Mining
- 11.4.7. Oil and Gas
- 11.4.8. Pharmaceuticals
- 11.4.9. Transportation
- 11.4.10. Telecommunications
- 11.4.11. Nuclear Projects
- 11.4.12. Other Industries
- 11.1. Market Analysis, Insights and Forecast - by Engineering Disciplines
- 12. Competitive Analysis
- 12.1. Company Profiles
- 12.1.1 Barton Malow
- 12.1.1.1. Company Overview
- 12.1.1.2. Products
- 12.1.1.3. Company Financials
- 12.1.1.4. SWOT Analysis
- 12.1.2 Bechtel Corporation
- 12.1.2.1. Company Overview
- 12.1.2.2. Products
- 12.1.2.3. Company Financials
- 12.1.2.4. SWOT Analysis
- 12.1.3 Gilbane Building Company
- 12.1.3.1. Company Overview
- 12.1.3.2. Products
- 12.1.3.3. Company Financials
- 12.1.3.4. SWOT Analysis
- 12.1.4 Brasfield & Gorrie LLC
- 12.1.4.1. Company Overview
- 12.1.4.2. Products
- 12.1.4.3. Company Financials
- 12.1.4.4. SWOT Analysis
- 12.1.5 Jones Lang LaSalle Incorporated
- 12.1.5.1. Company Overview
- 12.1.5.2. Products
- 12.1.5.3. Company Financials
- 12.1.5.4. SWOT Analysis
- 12.1.6 Kiewit Corporation
- 12.1.6.1. Company Overview
- 12.1.6.2. Products
- 12.1.6.3. Company Financials
- 12.1.6.4. SWOT Analysis
- 12.1.7 STRABAG SE
- 12.1.7.1. Company Overview
- 12.1.7.2. Products
- 12.1.7.3. Company Financials
- 12.1.7.4. SWOT Analysis
- 12.1.8 Balfour Beatty Inc
- 12.1.8.1. Company Overview
- 12.1.8.2. Products
- 12.1.8.3. Company Financials
- 12.1.8.4. SWOT Analysis
- 12.1.9 Nearby Engineers
- 12.1.9.1. Company Overview
- 12.1.9.2. Products
- 12.1.9.3. Company Financials
- 12.1.9.4. SWOT Analysis
- 12.1.10 NV5 Global Inc
- 12.1.10.1. Company Overview
- 12.1.10.2. Products
- 12.1.10.3. Company Financials
- 12.1.10.4. SWOT Analysis
- 12.1.11 WSP Global Inc
- 12.1.11.1. Company Overview
- 12.1.11.2. Products
- 12.1.11.3. Company Financials
- 12.1.11.4. SWOT Analysis
- 12.1.12 AECOM Engineering company
- 12.1.12.1. Company Overview
- 12.1.12.2. Products
- 12.1.12.3. Company Financials
- 12.1.12.4. SWOT Analysis
- 12.1.13 RMF Engineering Inc
- 12.1.13.1. Company Overview
- 12.1.13.2. Products
- 12.1.13.3. Company Financials
- 12.1.13.4. SWOT Analysis
- 12.1.1 Barton Malow
- 12.2. Market Entropy
- 12.2.1 Company's Key Areas Served
- 12.2.2 Recent Developments
- 12.3. Company Market Share Analysis 2025
- 12.3.1 Top 5 Companies Market Share Analysis
- 12.3.2 Top 3 Companies Market Share Analysis
- 12.4. List of Potential Customers
- 13. Research Methodology
List of Figures
- Figure 1: Global Engineering Services Market Revenue Breakdown (Million, %) by Region 2025 & 2033
- Figure 2: Global Engineering Services Market Volume Breakdown (K Unit, %) by Region 2025 & 2033
- Figure 3: North America Engineering Services Market Revenue (Million), by Engineering Disciplines 2025 & 2033
- Figure 4: North America Engineering Services Market Volume (K Unit), by Engineering Disciplines 2025 & 2033
- Figure 5: North America Engineering Services Market Revenue Share (%), by Engineering Disciplines 2025 & 2033
- Figure 6: North America Engineering Services Market Volume Share (%), by Engineering Disciplines 2025 & 2033
- Figure 7: North America Engineering Services Market Revenue (Million), by Delivery Model 2025 & 2033
- Figure 8: North America Engineering Services Market Volume (K Unit), by Delivery Model 2025 & 2033
- Figure 9: North America Engineering Services Market Revenue Share (%), by Delivery Model 2025 & 2033
- Figure 10: North America Engineering Services Market Volume Share (%), by Delivery Model 2025 & 2033
- Figure 11: North America Engineering Services Market Revenue (Million), by Services 2025 & 2033
- Figure 12: North America Engineering Services Market Volume (K Unit), by Services 2025 & 2033
- Figure 13: North America Engineering Services Market Revenue Share (%), by Services 2025 & 2033
- Figure 14: North America Engineering Services Market Volume Share (%), by Services 2025 & 2033
- Figure 15: North America Engineering Services Market Revenue (Million), by Industries 2025 & 2033
- Figure 16: North America Engineering Services Market Volume (K Unit), by Industries 2025 & 2033
- Figure 17: North America Engineering Services Market Revenue Share (%), by Industries 2025 & 2033
- Figure 18: North America Engineering Services Market Volume Share (%), by Industries 2025 & 2033
- Figure 19: North America Engineering Services Market Revenue (Million), by Country 2025 & 2033
- Figure 20: North America Engineering Services Market Volume (K Unit), by Country 2025 & 2033
- Figure 21: North America Engineering Services Market Revenue Share (%), by Country 2025 & 2033
- Figure 22: North America Engineering Services Market Volume Share (%), by Country 2025 & 2033
- Figure 23: Europe Engineering Services Market Revenue (Million), by Engineering Disciplines 2025 & 2033
- Figure 24: Europe Engineering Services Market Volume (K Unit), by Engineering Disciplines 2025 & 2033
- Figure 25: Europe Engineering Services Market Revenue Share (%), by Engineering Disciplines 2025 & 2033
- Figure 26: Europe Engineering Services Market Volume Share (%), by Engineering Disciplines 2025 & 2033
- Figure 27: Europe Engineering Services Market Revenue (Million), by Delivery Model 2025 & 2033
- Figure 28: Europe Engineering Services Market Volume (K Unit), by Delivery Model 2025 & 2033
- Figure 29: Europe Engineering Services Market Revenue Share (%), by Delivery Model 2025 & 2033
- Figure 30: Europe Engineering Services Market Volume Share (%), by Delivery Model 2025 & 2033
- Figure 31: Europe Engineering Services Market Revenue (Million), by Services 2025 & 2033
- Figure 32: Europe Engineering Services Market Volume (K Unit), by Services 2025 & 2033
- Figure 33: Europe Engineering Services Market Revenue Share (%), by Services 2025 & 2033
- Figure 34: Europe Engineering Services Market Volume Share (%), by Services 2025 & 2033
- Figure 35: Europe Engineering Services Market Revenue (Million), by Industries 2025 & 2033
- Figure 36: Europe Engineering Services Market Volume (K Unit), by Industries 2025 & 2033
- Figure 37: Europe Engineering Services Market Revenue Share (%), by Industries 2025 & 2033
- Figure 38: Europe Engineering Services Market Volume Share (%), by Industries 2025 & 2033
- Figure 39: Europe Engineering Services Market Revenue (Million), by Country 2025 & 2033
- Figure 40: Europe Engineering Services Market Volume (K Unit), by Country 2025 & 2033
- Figure 41: Europe Engineering Services Market Revenue Share (%), by Country 2025 & 2033
- Figure 42: Europe Engineering Services Market Volume Share (%), by Country 2025 & 2033
- Figure 43: Asia Pacific Engineering Services Market Revenue (Million), by Engineering Disciplines 2025 & 2033
- Figure 44: Asia Pacific Engineering Services Market Volume (K Unit), by Engineering Disciplines 2025 & 2033
- Figure 45: Asia Pacific Engineering Services Market Revenue Share (%), by Engineering Disciplines 2025 & 2033
- Figure 46: Asia Pacific Engineering Services Market Volume Share (%), by Engineering Disciplines 2025 & 2033
- Figure 47: Asia Pacific Engineering Services Market Revenue (Million), by Delivery Model 2025 & 2033
- Figure 48: Asia Pacific Engineering Services Market Volume (K Unit), by Delivery Model 2025 & 2033
- Figure 49: Asia Pacific Engineering Services Market Revenue Share (%), by Delivery Model 2025 & 2033
- Figure 50: Asia Pacific Engineering Services Market Volume Share (%), by Delivery Model 2025 & 2033
- Figure 51: Asia Pacific Engineering Services Market Revenue (Million), by Services 2025 & 2033
- Figure 52: Asia Pacific Engineering Services Market Volume (K Unit), by Services 2025 & 2033
- Figure 53: Asia Pacific Engineering Services Market Revenue Share (%), by Services 2025 & 2033
- Figure 54: Asia Pacific Engineering Services Market Volume Share (%), by Services 2025 & 2033
- Figure 55: Asia Pacific Engineering Services Market Revenue (Million), by Industries 2025 & 2033
- Figure 56: Asia Pacific Engineering Services Market Volume (K Unit), by Industries 2025 & 2033
- Figure 57: Asia Pacific Engineering Services Market Revenue Share (%), by Industries 2025 & 2033
- Figure 58: Asia Pacific Engineering Services Market Volume Share (%), by Industries 2025 & 2033
- Figure 59: Asia Pacific Engineering Services Market Revenue (Million), by Country 2025 & 2033
- Figure 60: Asia Pacific Engineering Services Market Volume (K Unit), by Country 2025 & 2033
- Figure 61: Asia Pacific Engineering Services Market Revenue Share (%), by Country 2025 & 2033
- Figure 62: Asia Pacific Engineering Services Market Volume Share (%), by Country 2025 & 2033
- Figure 63: Latin America Engineering Services Market Revenue (Million), by Engineering Disciplines 2025 & 2033
- Figure 64: Latin America Engineering Services Market Volume (K Unit), by Engineering Disciplines 2025 & 2033
- Figure 65: Latin America Engineering Services Market Revenue Share (%), by Engineering Disciplines 2025 & 2033
- Figure 66: Latin America Engineering Services Market Volume Share (%), by Engineering Disciplines 2025 & 2033
- Figure 67: Latin America Engineering Services Market Revenue (Million), by Delivery Model 2025 & 2033
- Figure 68: Latin America Engineering Services Market Volume (K Unit), by Delivery Model 2025 & 2033
- Figure 69: Latin America Engineering Services Market Revenue Share (%), by Delivery Model 2025 & 2033
- Figure 70: Latin America Engineering Services Market Volume Share (%), by Delivery Model 2025 & 2033
- Figure 71: Latin America Engineering Services Market Revenue (Million), by Services 2025 & 2033
- Figure 72: Latin America Engineering Services Market Volume (K Unit), by Services 2025 & 2033
- Figure 73: Latin America Engineering Services Market Revenue Share (%), by Services 2025 & 2033
- Figure 74: Latin America Engineering Services Market Volume Share (%), by Services 2025 & 2033
- Figure 75: Latin America Engineering Services Market Revenue (Million), by Industries 2025 & 2033
- Figure 76: Latin America Engineering Services Market Volume (K Unit), by Industries 2025 & 2033
- Figure 77: Latin America Engineering Services Market Revenue Share (%), by Industries 2025 & 2033
- Figure 78: Latin America Engineering Services Market Volume Share (%), by Industries 2025 & 2033
- Figure 79: Latin America Engineering Services Market Revenue (Million), by Country 2025 & 2033
- Figure 80: Latin America Engineering Services Market Volume (K Unit), by Country 2025 & 2033
- Figure 81: Latin America Engineering Services Market Revenue Share (%), by Country 2025 & 2033
- Figure 82: Latin America Engineering Services Market Volume Share (%), by Country 2025 & 2033
- Figure 83: Middle East and Africa Engineering Services Market Revenue (Million), by Engineering Disciplines 2025 & 2033
- Figure 84: Middle East and Africa Engineering Services Market Volume (K Unit), by Engineering Disciplines 2025 & 2033
- Figure 85: Middle East and Africa Engineering Services Market Revenue Share (%), by Engineering Disciplines 2025 & 2033
- Figure 86: Middle East and Africa Engineering Services Market Volume Share (%), by Engineering Disciplines 2025 & 2033
- Figure 87: Middle East and Africa Engineering Services Market Revenue (Million), by Delivery Model 2025 & 2033
- Figure 88: Middle East and Africa Engineering Services Market Volume (K Unit), by Delivery Model 2025 & 2033
- Figure 89: Middle East and Africa Engineering Services Market Revenue Share (%), by Delivery Model 2025 & 2033
- Figure 90: Middle East and Africa Engineering Services Market Volume Share (%), by Delivery Model 2025 & 2033
- Figure 91: Middle East and Africa Engineering Services Market Revenue (Million), by Services 2025 & 2033
- Figure 92: Middle East and Africa Engineering Services Market Volume (K Unit), by Services 2025 & 2033
- Figure 93: Middle East and Africa Engineering Services Market Revenue Share (%), by Services 2025 & 2033
- Figure 94: Middle East and Africa Engineering Services Market Volume Share (%), by Services 2025 & 2033
- Figure 95: Middle East and Africa Engineering Services Market Revenue (Million), by Industries 2025 & 2033
- Figure 96: Middle East and Africa Engineering Services Market Volume (K Unit), by Industries 2025 & 2033
- Figure 97: Middle East and Africa Engineering Services Market Revenue Share (%), by Industries 2025 & 2033
- Figure 98: Middle East and Africa Engineering Services Market Volume Share (%), by Industries 2025 & 2033
- Figure 99: Middle East and Africa Engineering Services Market Revenue (Million), by Country 2025 & 2033
- Figure 100: Middle East and Africa Engineering Services Market Volume (K Unit), by Country 2025 & 2033
- Figure 101: Middle East and Africa Engineering Services Market Revenue Share (%), by Country 2025 & 2033
- Figure 102: Middle East and Africa Engineering Services Market Volume Share (%), by Country 2025 & 2033
List of Tables
- Table 1: Global Engineering Services Market Revenue Million Forecast, by Engineering Disciplines 2020 & 2033
- Table 2: Global Engineering Services Market Volume K Unit Forecast, by Engineering Disciplines 2020 & 2033
- Table 3: Global Engineering Services Market Revenue Million Forecast, by Delivery Model 2020 & 2033
- Table 4: Global Engineering Services Market Volume K Unit Forecast, by Delivery Model 2020 & 2033
- Table 5: Global Engineering Services Market Revenue Million Forecast, by Services 2020 & 2033
- Table 6: Global Engineering Services Market Volume K Unit Forecast, by Services 2020 & 2033
- Table 7: Global Engineering Services Market Revenue Million Forecast, by Industries 2020 & 2033
- Table 8: Global Engineering Services Market Volume K Unit Forecast, by Industries 2020 & 2033
- Table 9: Global Engineering Services Market Revenue Million Forecast, by Region 2020 & 2033
- Table 10: Global Engineering Services Market Volume K Unit Forecast, by Region 2020 & 2033
- Table 11: Global Engineering Services Market Revenue Million Forecast, by Engineering Disciplines 2020 & 2033
- Table 12: Global Engineering Services Market Volume K Unit Forecast, by Engineering Disciplines 2020 & 2033
- Table 13: Global Engineering Services Market Revenue Million Forecast, by Delivery Model 2020 & 2033
- Table 14: Global Engineering Services Market Volume K Unit Forecast, by Delivery Model 2020 & 2033
- Table 15: Global Engineering Services Market Revenue Million Forecast, by Services 2020 & 2033
- Table 16: Global Engineering Services Market Volume K Unit Forecast, by Services 2020 & 2033
- Table 17: Global Engineering Services Market Revenue Million Forecast, by Industries 2020 & 2033
- Table 18: Global Engineering Services Market Volume K Unit Forecast, by Industries 2020 & 2033
- Table 19: Global Engineering Services Market Revenue Million Forecast, by Country 2020 & 2033
- Table 20: Global Engineering Services Market Volume K Unit Forecast, by Country 2020 & 2033
- Table 21: United States Engineering Services Market Revenue (Million) Forecast, by Application 2020 & 2033
- Table 22: United States Engineering Services Market Volume (K Unit) Forecast, by Application 2020 & 2033
- Table 23: Canada Engineering Services Market Revenue (Million) Forecast, by Application 2020 & 2033
- Table 24: Canada Engineering Services Market Volume (K Unit) Forecast, by Application 2020 & 2033
- Table 25: Global Engineering Services Market Revenue Million Forecast, by Engineering Disciplines 2020 & 2033
- Table 26: Global Engineering Services Market Volume K Unit Forecast, by Engineering Disciplines 2020 & 2033
- Table 27: Global Engineering Services Market Revenue Million Forecast, by Delivery Model 2020 & 2033
- Table 28: Global Engineering Services Market Volume K Unit Forecast, by Delivery Model 2020 & 2033
- Table 29: Global Engineering Services Market Revenue Million Forecast, by Services 2020 & 2033
- Table 30: Global Engineering Services Market Volume K Unit Forecast, by Services 2020 & 2033
- Table 31: Global Engineering Services Market Revenue Million Forecast, by Industries 2020 & 2033
- Table 32: Global Engineering Services Market Volume K Unit Forecast, by Industries 2020 & 2033
- Table 33: Global Engineering Services Market Revenue Million Forecast, by Country 2020 & 2033
- Table 34: Global Engineering Services Market Volume K Unit Forecast, by Country 2020 & 2033
- Table 35: Germany Engineering Services Market Revenue (Million) Forecast, by Application 2020 & 2033
- Table 36: Germany Engineering Services Market Volume (K Unit) Forecast, by Application 2020 & 2033
- Table 37: United Kingdom Engineering Services Market Revenue (Million) Forecast, by Application 2020 & 2033
- Table 38: United Kingdom Engineering Services Market Volume (K Unit) Forecast, by Application 2020 & 2033
- Table 39: France Engineering Services Market Revenue (Million) Forecast, by Application 2020 & 2033
- Table 40: France Engineering Services Market Volume (K Unit) Forecast, by Application 2020 & 2033
- Table 41: Spain Engineering Services Market Revenue (Million) Forecast, by Application 2020 & 2033
- Table 42: Spain Engineering Services Market Volume (K Unit) Forecast, by Application 2020 & 2033
- Table 43: Rest of Europe Engineering Services Market Revenue (Million) Forecast, by Application 2020 & 2033
- Table 44: Rest of Europe Engineering Services Market Volume (K Unit) Forecast, by Application 2020 & 2033
- Table 45: Global Engineering Services Market Revenue Million Forecast, by Engineering Disciplines 2020 & 2033
- Table 46: Global Engineering Services Market Volume K Unit Forecast, by Engineering Disciplines 2020 & 2033
- Table 47: Global Engineering Services Market Revenue Million Forecast, by Delivery Model 2020 & 2033
- Table 48: Global Engineering Services Market Volume K Unit Forecast, by Delivery Model 2020 & 2033
- Table 49: Global Engineering Services Market Revenue Million Forecast, by Services 2020 & 2033
- Table 50: Global Engineering Services Market Volume K Unit Forecast, by Services 2020 & 2033
- Table 51: Global Engineering Services Market Revenue Million Forecast, by Industries 2020 & 2033
- Table 52: Global Engineering Services Market Volume K Unit Forecast, by Industries 2020 & 2033
- Table 53: Global Engineering Services Market Revenue Million Forecast, by Country 2020 & 2033
- Table 54: Global Engineering Services Market Volume K Unit Forecast, by Country 2020 & 2033
- Table 55: China Engineering Services Market Revenue (Million) Forecast, by Application 2020 & 2033
- Table 56: China Engineering Services Market Volume (K Unit) Forecast, by Application 2020 & 2033
- Table 57: Japan Engineering Services Market Revenue (Million) Forecast, by Application 2020 & 2033
- Table 58: Japan Engineering Services Market Volume (K Unit) Forecast, by Application 2020 & 2033
- Table 59: India Engineering Services Market Revenue (Million) Forecast, by Application 2020 & 2033
- Table 60: India Engineering Services Market Volume (K Unit) Forecast, by Application 2020 & 2033
- Table 61: Rest of Asia Pacific Engineering Services Market Revenue (Million) Forecast, by Application 2020 & 2033
- Table 62: Rest of Asia Pacific Engineering Services Market Volume (K Unit) Forecast, by Application 2020 & 2033
- Table 63: Global Engineering Services Market Revenue Million Forecast, by Engineering Disciplines 2020 & 2033
- Table 64: Global Engineering Services Market Volume K Unit Forecast, by Engineering Disciplines 2020 & 2033
- Table 65: Global Engineering Services Market Revenue Million Forecast, by Delivery Model 2020 & 2033
- Table 66: Global Engineering Services Market Volume K Unit Forecast, by Delivery Model 2020 & 2033
- Table 67: Global Engineering Services Market Revenue Million Forecast, by Services 2020 & 2033
- Table 68: Global Engineering Services Market Volume K Unit Forecast, by Services 2020 & 2033
- Table 69: Global Engineering Services Market Revenue Million Forecast, by Industries 2020 & 2033
- Table 70: Global Engineering Services Market Volume K Unit Forecast, by Industries 2020 & 2033
- Table 71: Global Engineering Services Market Revenue Million Forecast, by Country 2020 & 2033
- Table 72: Global Engineering Services Market Volume K Unit Forecast, by Country 2020 & 2033
- Table 73: Brazil Engineering Services Market Revenue (Million) Forecast, by Application 2020 & 2033
- Table 74: Brazil Engineering Services Market Volume (K Unit) Forecast, by Application 2020 & 2033
- Table 75: Argentina Engineering Services Market Revenue (Million) Forecast, by Application 2020 & 2033
- Table 76: Argentina Engineering Services Market Volume (K Unit) Forecast, by Application 2020 & 2033
- Table 77: Rest of Latin America Engineering Services Market Revenue (Million) Forecast, by Application 2020 & 2033
- Table 78: Rest of Latin America Engineering Services Market Volume (K Unit) Forecast, by Application 2020 & 2033
- Table 79: Global Engineering Services Market Revenue Million Forecast, by Engineering Disciplines 2020 & 2033
- Table 80: Global Engineering Services Market Volume K Unit Forecast, by Engineering Disciplines 2020 & 2033
- Table 81: Global Engineering Services Market Revenue Million Forecast, by Delivery Model 2020 & 2033
- Table 82: Global Engineering Services Market Volume K Unit Forecast, by Delivery Model 2020 & 2033
- Table 83: Global Engineering Services Market Revenue Million Forecast, by Services 2020 & 2033
- Table 84: Global Engineering Services Market Volume K Unit Forecast, by Services 2020 & 2033
- Table 85: Global Engineering Services Market Revenue Million Forecast, by Industries 2020 & 2033
- Table 86: Global Engineering Services Market Volume K Unit Forecast, by Industries 2020 & 2033
- Table 87: Global Engineering Services Market Revenue Million Forecast, by Country 2020 & 2033
- Table 88: Global Engineering Services Market Volume K Unit Forecast, by Country 2020 & 2033
- Table 89: United Arab Emirates Engineering Services Market Revenue (Million) Forecast, by Application 2020 & 2033
- Table 90: United Arab Emirates Engineering Services Market Volume (K Unit) Forecast, by Application 2020 & 2033
- Table 91: Saudi Arabia Engineering Services Market Revenue (Million) Forecast, by Application 2020 & 2033
- Table 92: Saudi Arabia Engineering Services Market Volume (K Unit) Forecast, by Application 2020 & 2033
- Table 93: South Africa Engineering Services Market Revenue (Million) Forecast, by Application 2020 & 2033
- Table 94: South Africa Engineering Services Market Volume (K Unit) Forecast, by Application 2020 & 2033
- Table 95: Rest of Middle East and Africa Engineering Services Market Revenue (Million) Forecast, by Application 2020 & 2033
- Table 96: Rest of Middle East and Africa Engineering Services Market Volume (K Unit) Forecast, by Application 2020 & 2033
Frequently Asked Questions
1. What is the projected Compound Annual Growth Rate (CAGR) of the Engineering Services Market?
The projected CAGR is approximately 4.20%.
2. Which companies are prominent players in the Engineering Services Market?
Key companies in the market include Barton Malow, Bechtel Corporation, Gilbane Building Company, Brasfield & Gorrie LLC, Jones Lang LaSalle Incorporated, Kiewit Corporation, STRABAG SE, Balfour Beatty Inc, Nearby Engineers, NV5 Global Inc, WSP Global Inc, AECOM Engineering company, RMF Engineering Inc.
3. What are the main segments of the Engineering Services Market?
The market segments include Engineering Disciplines, Delivery Model, Services, Industries.
4. Can you provide details about the market size?
The market size is estimated to be USD 1.67 Million as of 2022.
5. What are some drivers contributing to market growth?
Evolution of Industrial IoT; Increasing Civil Engineering Services Due to Rapid Urbanization Throughout the Region to Drive the Overall Market.
6. What are the notable trends driving market growth?
Automotive Sector Holds Major Market Share.
7. Are there any restraints impacting market growth?
Political Problems and Lack of Skilled Professionals.
8. Can you provide examples of recent developments in the market?
February 2023: SCF Partners announced its investment in Global E&C, a differentiated engineering, maintenance, modification, and commissioning business mainly focused on servicing the offshore energy sector. The investment is expected to significantly bolster GEC's ability to assist the evolving energy markets and enhance the growth of its digital and decarbonization offerings.
9. What pricing options are available for accessing the report?
Pricing options include single-user, multi-user, and enterprise licenses priced at USD 4750, USD 5250, and USD 8750 respectively.
10. Is the market size provided in terms of value or volume?
The market size is provided in terms of value, measured in Million and volume, measured in K Unit.
11. Are there any specific market keywords associated with the report?
Yes, the market keyword associated with the report is "Engineering Services Market," which aids in identifying and referencing the specific market segment covered.
12. How do I determine which pricing option suits my needs best?
The pricing options vary based on user requirements and access needs. Individual users may opt for single-user licenses, while businesses requiring broader access may choose multi-user or enterprise licenses for cost-effective access to the report.
13. Are there any additional resources or data provided in the Engineering Services Market report?
While the report offers comprehensive insights, it's advisable to review the specific contents or supplementary materials provided to ascertain if additional resources or data are available.
14. How can I stay updated on further developments or reports in the Engineering Services Market?
To stay informed about further developments, trends, and reports in the Engineering Services Market, consider subscribing to industry newsletters, following relevant companies and organizations, or regularly checking reputable industry news sources and publications.
Methodology
Step 1 - Identification of Relevant Samples Size from Population Database


Step 2 - Approaches for Defining Global Market Size (Value, Volume* & Price*)

Note*: In applicable scenarios
Step 3 - Data Sources
Primary Research
- Web Analytics
- Survey Reports
- Research Institute
- Latest Research Reports
- Opinion Leaders
Secondary Research
- Annual Reports
- White Paper
- Latest Press Release
- Industry Association
- Paid Database
- Investor Presentations

Step 4 - Data Triangulation
Involves using different sources of information in order to increase the validity of a study
These sources are likely to be stakeholders in a program - participants, other researchers, program staff, other community members, and so on.
Then we put all data in single framework & apply various statistical tools to find out the dynamic on the market.
During the analysis stage, feedback from the stakeholder groups would be compared to determine areas of agreement as well as areas of divergence