

Key Insights
The global Air Quality Monitoring Service market is poised for significant expansion, projected to reach an estimated USD 6.5 billion in 2025. This robust growth is fueled by a confluence of increasing environmental awareness, stringent regulatory mandates for cleaner air, and a growing understanding of the detrimental health impacts associated with poor air quality. Industries are increasingly investing in sophisticated monitoring solutions to ensure compliance, protect employee health, and maintain brand reputation. The rising concerns surrounding indoor air pollutants, such as formaldehyde, and outdoor particulate matter (PM2.5) are driving demand for specialized testing services across various applications, including schools, apartments, hospitals, and construction sites. The market's compound annual growth rate (CAGR) is expected to be a healthy 6.8% from 2025 to 2033, indicating sustained momentum.
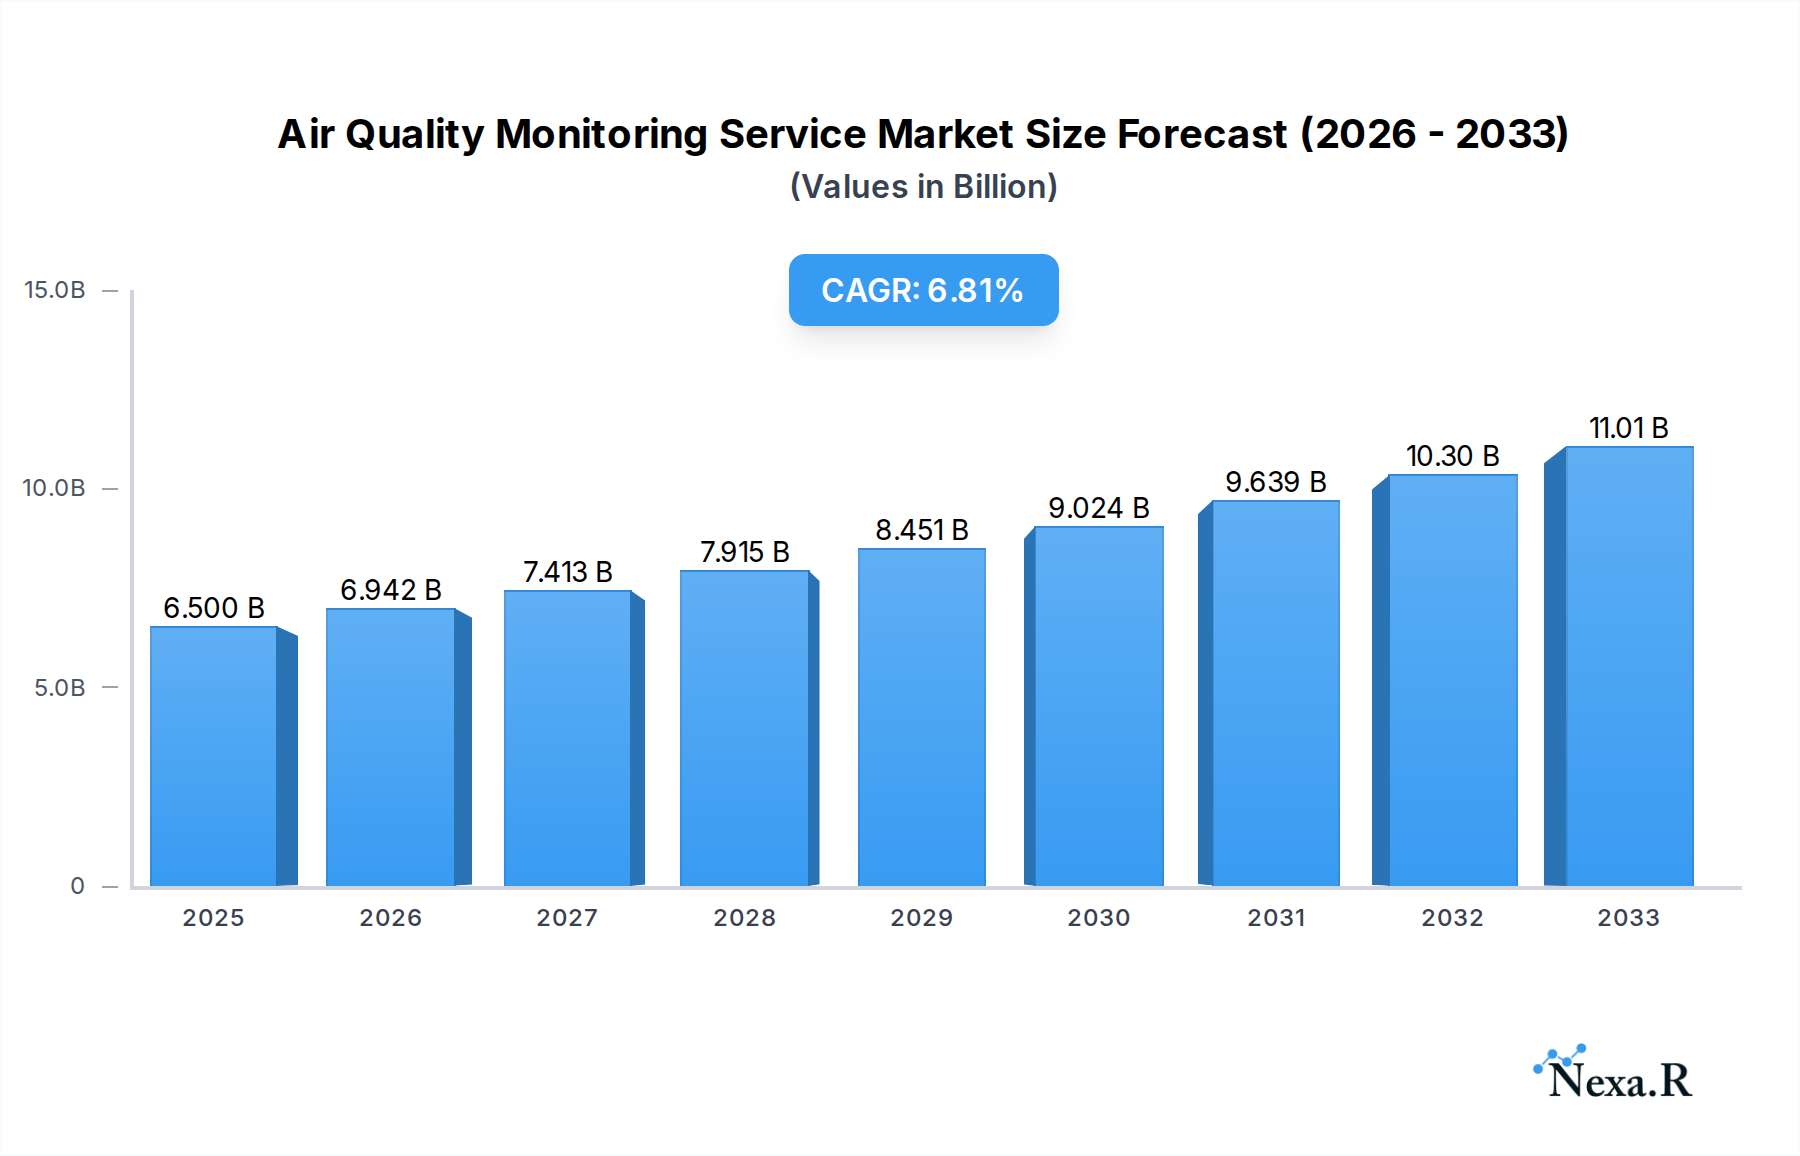
Air Quality Monitoring Service Market Size (In Billion)
The market's trajectory is further propelled by technological advancements in sensor technology, data analytics, and cloud-based platforms, enabling more accurate, real-time, and cost-effective air quality assessments. Innovations in portable and IoT-enabled devices are democratizing access to air quality data, empowering individuals and organizations alike. Key growth drivers include rising pollution levels in urban areas, increased industrialization, and a growing focus on public health initiatives. Despite the promising outlook, challenges such as high initial investment costs for advanced monitoring systems and the need for skilled professionals to interpret complex data may pose some restraint. However, the overarching trend towards sustainability and proactive environmental management is expected to outweigh these challenges, ensuring a dynamic and expanding market for air quality monitoring services.

Air Quality Monitoring Service Company Market Share
Air Quality Monitoring Service Market Report: Comprehensive Analysis and Future Outlook (2019-2033)
This comprehensive report delivers an in-depth analysis of the global Air Quality Monitoring Service market, forecasting its trajectory from 2019 to 2033. We explore critical market dynamics, growth drivers, regional dominance, technological innovations, and the competitive landscape. This report is an indispensable resource for industry professionals, researchers, and investors seeking to understand the evolving air quality testing, indoor air quality monitoring, outdoor pollution detection, and environmental sensing sectors. Our analysis covers both parent market (environmental consulting services) and child market (specialized air quality monitoring services), providing a holistic view of market value, projected to reach over $15 billion by 2025, with a robust CAGR.
Air Quality Monitoring Service Market Dynamics & Structure
The Air Quality Monitoring Service market exhibits a moderate concentration, with leading players like SGS, Envea, and Aeroqual holding significant shares. Technological innovation is a primary driver, fueled by advancements in IoT sensors, AI-powered data analytics, and real-time monitoring solutions. Stringent regulatory frameworks worldwide, mandating improved air quality in residential, commercial, and industrial spaces, further stimulate market growth. Competitive product substitutes include in-house monitoring equipment and basic testing kits, though these often lack the comprehensive data analysis and regulatory compliance offered by professional services. End-user demographics are diverse, encompassing government agencies, industrial facilities, educational institutions, healthcare providers, and residential complexes. Mergers and Acquisitions (M&A) trends are observed as companies seek to expand their service portfolios and geographical reach, with an estimated 15-20 significant M&A deals annually in the broader environmental services sector. Innovation barriers include the high cost of advanced sensor technology and the need for skilled personnel for data interpretation.
- Market Concentration: Moderate, with key players dominating specific niches.
- Technological Innovation: Driven by IoT, AI, and real-time sensing.
- Regulatory Frameworks: Stringent global standards enforcing air quality compliance.
- Competitive Substitutes: In-house equipment, basic testing kits.
- End-User Demographics: Diverse, including government, industry, and residential sectors.
- M&A Trends: Strategic acquisitions for service and geographic expansion.
- Innovation Barriers: High cost of advanced technology, skilled workforce needs.
Air Quality Monitoring Service Growth Trends & Insights
The Air Quality Monitoring Service market is poised for significant expansion, driven by increasing public awareness of the health impacts of poor air quality and escalating government regulations. The market size, estimated at $10 billion in 2024, is projected to reach over $15 billion by 2025 and is expected to continue its upward trajectory throughout the forecast period, exhibiting a Compound Annual Growth Rate (CAGR) of approximately 5.5%. Adoption rates are rapidly increasing across various applications, including Schools, Apartments, Hospitals, and Construction Sites. Technological disruptions, such as the miniaturization of sensors and the development of sophisticated data analytics platforms, are enhancing the accuracy and accessibility of air quality monitoring. Consumer behavior shifts, with a growing preference for healthier living and working environments, are further fueling demand for comprehensive indoor and outdoor air quality assessment services. The integration of smart city initiatives and the Internet of Things (IoT) is creating new avenues for continuous, real-time air quality surveillance, impacting urban planning and public health strategies. The growing concern over PM2.5 pollution, formaldehyde detection, and indoor air bacteria is a major catalyst for market growth. The market penetration of professional air quality monitoring services is steadily rising, particularly in developed economies with stringent environmental policies.
Dominant Regions, Countries, or Segments in Air Quality Monitoring Service
The Outdoor PM2.5 Content Testing Service segment, particularly within the Asia-Pacific region, is identified as a significant driver of market growth. This dominance is attributed to several interconnected factors, including rapid industrialization, dense urban populations, and the resultant severe air pollution challenges in countries like China, India, and Southeast Asian nations. Economic policies aimed at combating ambient air pollution and improving public health are compelling governments to invest heavily in air quality monitoring infrastructure. Infrastructure development, including smart city projects and extensive urban expansion, necessitates continuous monitoring of atmospheric conditions to ensure compliance and mitigate health risks. The market share within this segment is substantial, estimated to be over 30% of the total air quality monitoring services market by 2025. Growth potential remains exceptionally high due to the persistent nature of PM2.5 pollution and the increasing demand for accurate, real-time data for policy-making and public advisories.
Within the Application segment, Hospitals are exhibiting remarkable growth. Increasing awareness of hospital-acquired infections and the critical need for sterile, clean environments for patient recovery are driving substantial investment in sophisticated indoor air quality monitoring. The Indoor Air Bacteria Detection Service is consequently a rapidly expanding niche, with healthcare facilities prioritizing the detection and control of airborne pathogens. This segment benefits from stringent healthcare regulations and a proactive approach to patient safety.
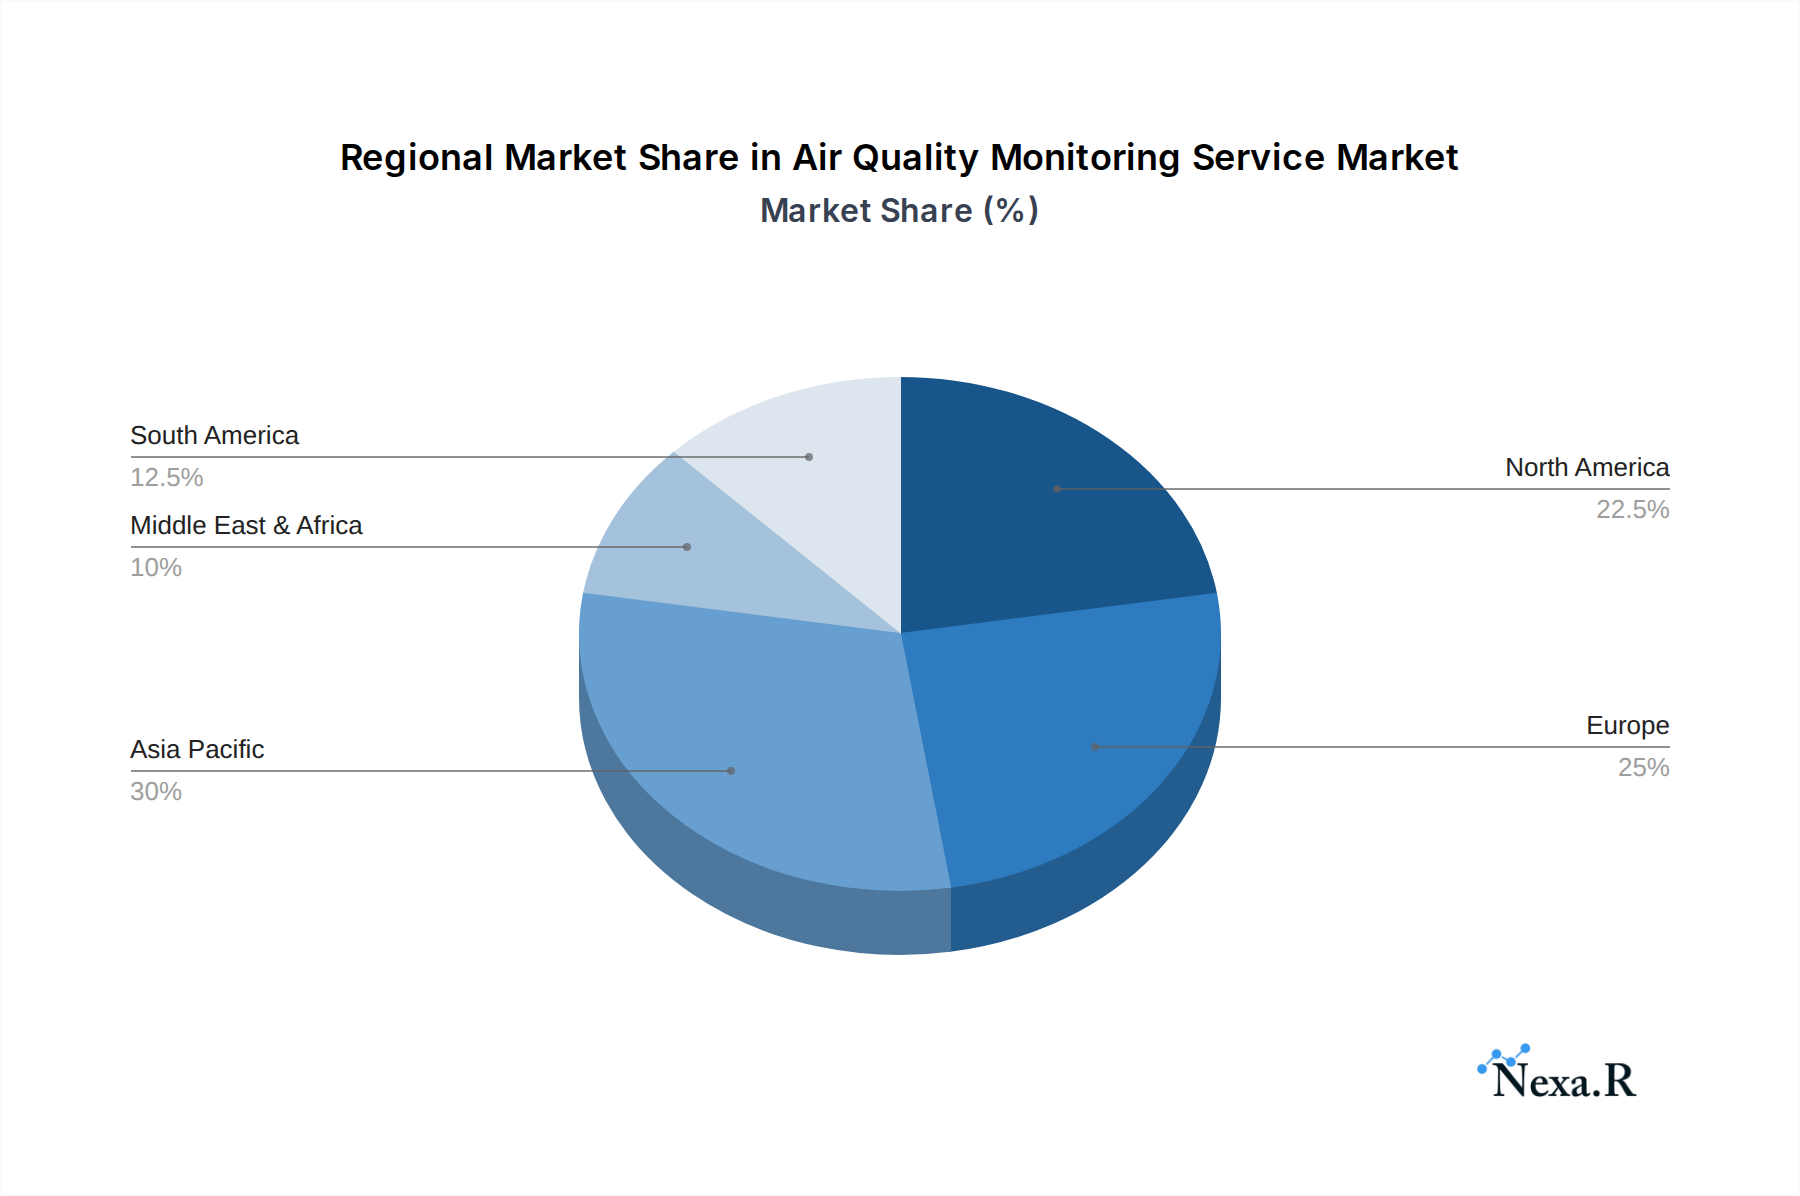
In terms of geographical dominance, North America and Europe continue to be mature but robust markets. They lead in the adoption of advanced monitoring technologies and have well-established regulatory frameworks that mandate comprehensive air quality testing across various sectors, including commercial buildings, residential complexes, and industrial sites. The focus here is on nuanced monitoring, including Indoor Formaldehyde Content Testing Service, due to concerns about building materials and VOC emissions.
- Dominant Segment (Type): Outdoor PM2.5 Content Testing Service.
- Key Drivers: Severe air pollution, industrialization, dense urban populations, government mandates.
- Market Share (2025 Estimate): Over 30% of the total air quality monitoring services market.
- Growth Potential: High, due to persistent pollution and data needs.
- Dominant Segment (Application): Hospitals.
- Key Drivers: Patient safety, infection control, demand for sterile environments.
- Growth Potential: High, with increased focus on healthcare hygiene.
- Dominant Regions: North America and Europe.
- Key Drivers: Mature regulatory frameworks, advanced technology adoption, awareness of indoor air quality.
Air Quality Monitoring Service Product Landscape
The product landscape for Air Quality Monitoring Services is characterized by increasing sophistication and integration. Innovations include low-cost, highly sensitive sensor networks for real-time data collection, mobile air quality monitoring units, and cloud-based platforms for advanced data analysis and visualization. Applications span from monitoring particulate matter (PM2.5, PM10), gaseous pollutants (NOx, SO2, CO, O3), and volatile organic compounds (VOCs) to detecting biological contaminants like bacteria and mold. Performance metrics emphasize accuracy, reliability, and ease of deployment. Unique selling propositions include predictive analytics for potential pollution events, personalized air quality reports, and seamless integration with building management systems and smart city infrastructure. Technological advancements are moving towards AI-driven anomaly detection and source attribution of pollution.
Key Drivers, Barriers & Challenges in Air Quality Monitoring Service
Key Drivers:
- Increasing Health Concerns: Growing awareness of the detrimental health effects of air pollution, both indoor and outdoor, is a primary impetus.
- Stringent Regulations: Government mandates and environmental policies worldwide are compelling industries and municipalities to adopt robust air quality monitoring.
- Technological Advancements: Development of more accurate, affordable, and connected sensors, coupled with AI-powered data analytics, enhances service efficacy.
- Smart City Initiatives: Integration of air quality monitoring into smart city frameworks for holistic urban planning and public health management.
- Corporate Social Responsibility (CSR): Companies are increasingly investing in air quality monitoring to demonstrate commitment to environmental sustainability.
Barriers & Challenges:
- High Initial Investment: The cost of deploying comprehensive monitoring systems and advanced sensor technology can be a significant barrier for some organizations.
- Data Management & Interpretation: Handling and interpreting vast amounts of real-time data requires specialized expertise and infrastructure.
- Sensor Calibration & Maintenance: Ensuring the accuracy and longevity of monitoring equipment necessitates regular calibration and maintenance, adding to operational costs.
- Regulatory Inconsistency: Variations in environmental regulations across different regions can create complexity for global service providers.
- Public Awareness Gaps: Despite growing concerns, pockets of the population may still lack comprehensive understanding of the importance of air quality monitoring, limiting demand.
- Supply Chain Disruptions: Global supply chain issues can impact the availability and cost of sensor components and monitoring equipment.
Emerging Opportunities in Air Quality Monitoring Service
Emerging opportunities lie in the expansion of IoT-enabled micro-monitoring networks for hyper-local air quality insights, particularly in residential areas and schools. The integration of air quality monitoring with building automation systems to proactively manage ventilation and maintain optimal indoor air conditions presents a significant growth avenue. Furthermore, the demand for specialized monitoring services for emerging pollutants, such as microplastics and specific industrial emissions, is on the rise. The development of portable, wearable air quality sensors for personal exposure assessment also represents a nascent but promising market. Partnerships with real estate developers and facility management companies to embed air quality monitoring as a standard feature in new constructions are key to unlocking future growth.
Growth Accelerators in the Air Quality Monitoring Service Industry
Long-term growth in the Air Quality Monitoring Service industry will be significantly accelerated by breakthroughs in AI-powered predictive analytics, enabling early detection and mitigation of pollution events. Strategic partnerships between sensor manufacturers, data analytics firms, and service providers will foster innovation and streamline service delivery. Market expansion strategies focusing on developing economies with nascent environmental regulations but burgeoning pollution issues will unlock substantial untapped potential. The increasing adoption of subscription-based models for monitoring services will also drive recurring revenue and customer loyalty, further solidifying market growth. The continued evolution of remote sensing technologies will also play a crucial role in expanding monitoring capabilities.
Key Players Shaping the Air Quality Monitoring Service Market
- CASHINS And Associates
- Focus Environmental
- C.G. Laboratories
- 1Source Safety And Health
- Mechanical Systems
- SGS
- CMA Testing
- Aeroqual
- Envea
Notable Milestones in Air Quality Monitoring Service Sector
- 2020: Introduction of advanced, low-cost PM2.5 sensors enabling wider deployment in urban areas.
- 2021: Increased regulatory focus on indoor air quality in commercial buildings following the global pandemic.
- 2022: Significant advancements in AI for real-time pollution source identification and predictive modeling.
- 2023: Launch of integrated IoT platforms for comprehensive environmental monitoring, including air quality, noise, and water.
- 2024 (Q1-Q4): Several strategic acquisitions by major players to expand service offerings in specialized testing, such as VOC and microbial monitoring.
In-Depth Air Quality Monitoring Service Market Outlook
The future of the Air Quality Monitoring Service market is exceptionally bright, fueled by a confluence of technological innovation, stringent regulatory imperatives, and growing societal awareness of environmental health. Accelerated by advancements in AI, IoT, and predictive analytics, the market is poised for sustained expansion. Strategic collaborations between technology providers and service experts, alongside targeted market expansion into developing regions, will act as powerful growth catalysts. The increasing demand for personalized environmental data and integrated building management solutions will further shape the industry's trajectory, promising a healthier and more sustainable future for all.
Air Quality Monitoring Service Segmentation
-
1. Application
- 1.1. School
- 1.2. Apartment
- 1.3. Hospital
- 1.4. Construction Site
- 1.5. Others
-
2. Types
- 2.1. Indoor Air Bacteria Detection Service
- 2.2. Outdoor PM2.5 Content Testing Service
- 2.3. Indoor Formaldehyde Content Testing Service
- 2.4. Other
Air Quality Monitoring Service Segmentation By Geography
-
1. North America
- 1.1. United States
- 1.2. Canada
- 1.3. Mexico
-
2. South America
- 2.1. Brazil
- 2.2. Argentina
- 2.3. Rest of South America
-
3. Europe
- 3.1. United Kingdom
- 3.2. Germany
- 3.3. France
- 3.4. Italy
- 3.5. Spain
- 3.6. Russia
- 3.7. Benelux
- 3.8. Nordics
- 3.9. Rest of Europe
-
4. Middle East & Africa
- 4.1. Turkey
- 4.2. Israel
- 4.3. GCC
- 4.4. North Africa
- 4.5. South Africa
- 4.6. Rest of Middle East & Africa
-
5. Asia Pacific
- 5.1. China
- 5.2. India
- 5.3. Japan
- 5.4. South Korea
- 5.5. ASEAN
- 5.6. Oceania
- 5.7. Rest of Asia Pacific
Air Quality Monitoring Service Regional Market Share
Geographic Coverage of Air Quality Monitoring Service
Air Quality Monitoring Service REPORT HIGHLIGHTS
| Aspects | Details |
|---|---|
| Study Period | 2020-2034 |
| Base Year | 2025 |
| Estimated Year | 2026 |
| Forecast Period | 2026-2034 |
| Historical Period | 2020-2025 |
| Growth Rate | CAGR of 6.8% from 2020-2034 |
| Segmentation |
|
Table of Contents
- 1. Introduction
- 1.1. Research Scope
- 1.2. Market Segmentation
- 1.3. Research Objective
- 1.4. Definitions and Assumptions
- 2. Executive Summary
- 2.1. Market Snapshot
- 3. Market Dynamics
- 3.1. Market Drivers
- 3.2. Market Restrains
- 3.3. Market Trends
- 3.4. Market Opportunities
- 4. Market Factor Analysis
- 4.1. Porters Five Forces
- 4.1.1. Bargaining Power of Suppliers
- 4.1.2. Bargaining Power of Buyers
- 4.1.3. Threat of New Entrants
- 4.1.4. Threat of Substitutes
- 4.1.5. Competitive Rivalry
- 4.2. PESTEL analysis
- 4.3. BCG Analysis
- 4.3.1. Stars (High Growth, High Market Share)
- 4.3.2. Cash Cows (Low Growth, High Market Share)
- 4.3.3. Question Mark (High Growth, Low Market Share)
- 4.3.4. Dogs (Low Growth, Low Market Share)
- 4.4. Ansoff Matrix Analysis
- 4.5. Supply Chain Analysis
- 4.6. Regulatory Landscape
- 4.7. Current Market Potential and Opportunity Assessment (TAM–SAM–SOM Framework)
- 4.8. NRP Analyst Note
- 4.1. Porters Five Forces
- 5. Market Analysis, Insights and Forecast 2021-2033
- 5.1. Market Analysis, Insights and Forecast - by Application
- 5.1.1. School
- 5.1.2. Apartment
- 5.1.3. Hospital
- 5.1.4. Construction Site
- 5.1.5. Others
- 5.2. Market Analysis, Insights and Forecast - by Types
- 5.2.1. Indoor Air Bacteria Detection Service
- 5.2.2. Outdoor PM2.5 Content Testing Service
- 5.2.3. Indoor Formaldehyde Content Testing Service
- 5.2.4. Other
- 5.3. Market Analysis, Insights and Forecast - by Region
- 5.3.1. North America
- 5.3.2. South America
- 5.3.3. Europe
- 5.3.4. Middle East & Africa
- 5.3.5. Asia Pacific
- 5.1. Market Analysis, Insights and Forecast - by Application
- 6. Global Air Quality Monitoring Service Analysis, Insights and Forecast, 2021-2033
- 6.1. Market Analysis, Insights and Forecast - by Application
- 6.1.1. School
- 6.1.2. Apartment
- 6.1.3. Hospital
- 6.1.4. Construction Site
- 6.1.5. Others
- 6.2. Market Analysis, Insights and Forecast - by Types
- 6.2.1. Indoor Air Bacteria Detection Service
- 6.2.2. Outdoor PM2.5 Content Testing Service
- 6.2.3. Indoor Formaldehyde Content Testing Service
- 6.2.4. Other
- 6.1. Market Analysis, Insights and Forecast - by Application
- 7. North America Air Quality Monitoring Service Analysis, Insights and Forecast, 2020-2032
- 7.1. Market Analysis, Insights and Forecast - by Application
- 7.1.1. School
- 7.1.2. Apartment
- 7.1.3. Hospital
- 7.1.4. Construction Site
- 7.1.5. Others
- 7.2. Market Analysis, Insights and Forecast - by Types
- 7.2.1. Indoor Air Bacteria Detection Service
- 7.2.2. Outdoor PM2.5 Content Testing Service
- 7.2.3. Indoor Formaldehyde Content Testing Service
- 7.2.4. Other
- 7.1. Market Analysis, Insights and Forecast - by Application
- 8. South America Air Quality Monitoring Service Analysis, Insights and Forecast, 2020-2032
- 8.1. Market Analysis, Insights and Forecast - by Application
- 8.1.1. School
- 8.1.2. Apartment
- 8.1.3. Hospital
- 8.1.4. Construction Site
- 8.1.5. Others
- 8.2. Market Analysis, Insights and Forecast - by Types
- 8.2.1. Indoor Air Bacteria Detection Service
- 8.2.2. Outdoor PM2.5 Content Testing Service
- 8.2.3. Indoor Formaldehyde Content Testing Service
- 8.2.4. Other
- 8.1. Market Analysis, Insights and Forecast - by Application
- 9. Europe Air Quality Monitoring Service Analysis, Insights and Forecast, 2020-2032
- 9.1. Market Analysis, Insights and Forecast - by Application
- 9.1.1. School
- 9.1.2. Apartment
- 9.1.3. Hospital
- 9.1.4. Construction Site
- 9.1.5. Others
- 9.2. Market Analysis, Insights and Forecast - by Types
- 9.2.1. Indoor Air Bacteria Detection Service
- 9.2.2. Outdoor PM2.5 Content Testing Service
- 9.2.3. Indoor Formaldehyde Content Testing Service
- 9.2.4. Other
- 9.1. Market Analysis, Insights and Forecast - by Application
- 10. Middle East & Africa Air Quality Monitoring Service Analysis, Insights and Forecast, 2020-2032
- 10.1. Market Analysis, Insights and Forecast - by Application
- 10.1.1. School
- 10.1.2. Apartment
- 10.1.3. Hospital
- 10.1.4. Construction Site
- 10.1.5. Others
- 10.2. Market Analysis, Insights and Forecast - by Types
- 10.2.1. Indoor Air Bacteria Detection Service
- 10.2.2. Outdoor PM2.5 Content Testing Service
- 10.2.3. Indoor Formaldehyde Content Testing Service
- 10.2.4. Other
- 10.1. Market Analysis, Insights and Forecast - by Application
- 11. Asia Pacific Air Quality Monitoring Service Analysis, Insights and Forecast, 2020-2032
- 11.1. Market Analysis, Insights and Forecast - by Application
- 11.1.1. School
- 11.1.2. Apartment
- 11.1.3. Hospital
- 11.1.4. Construction Site
- 11.1.5. Others
- 11.2. Market Analysis, Insights and Forecast - by Types
- 11.2.1. Indoor Air Bacteria Detection Service
- 11.2.2. Outdoor PM2.5 Content Testing Service
- 11.2.3. Indoor Formaldehyde Content Testing Service
- 11.2.4. Other
- 11.1. Market Analysis, Insights and Forecast - by Application
- 12. Competitive Analysis
- 12.1. Company Profiles
- 12.1.1 CASHINS And Associates
- 12.1.1.1. Company Overview
- 12.1.1.2. Products
- 12.1.1.3. Company Financials
- 12.1.1.4. SWOT Analysis
- 12.1.2 Focus Environmental
- 12.1.2.1. Company Overview
- 12.1.2.2. Products
- 12.1.2.3. Company Financials
- 12.1.2.4. SWOT Analysis
- 12.1.3 C.G. Laboratories
- 12.1.3.1. Company Overview
- 12.1.3.2. Products
- 12.1.3.3. Company Financials
- 12.1.3.4. SWOT Analysis
- 12.1.4 1Source Safety And Health
- 12.1.4.1. Company Overview
- 12.1.4.2. Products
- 12.1.4.3. Company Financials
- 12.1.4.4. SWOT Analysis
- 12.1.5 Mechanical Systems
- 12.1.5.1. Company Overview
- 12.1.5.2. Products
- 12.1.5.3. Company Financials
- 12.1.5.4. SWOT Analysis
- 12.1.6 SGS
- 12.1.6.1. Company Overview
- 12.1.6.2. Products
- 12.1.6.3. Company Financials
- 12.1.6.4. SWOT Analysis
- 12.1.7 CMA Testing
- 12.1.7.1. Company Overview
- 12.1.7.2. Products
- 12.1.7.3. Company Financials
- 12.1.7.4. SWOT Analysis
- 12.1.8 Aeroqual
- 12.1.8.1. Company Overview
- 12.1.8.2. Products
- 12.1.8.3. Company Financials
- 12.1.8.4. SWOT Analysis
- 12.1.9 Envea
- 12.1.9.1. Company Overview
- 12.1.9.2. Products
- 12.1.9.3. Company Financials
- 12.1.9.4. SWOT Analysis
- 12.1.1 CASHINS And Associates
- 12.2. Market Entropy
- 12.2.1 Company's Key Areas Served
- 12.2.2 Recent Developments
- 12.3. Company Market Share Analysis 2025
- 12.3.1 Top 5 Companies Market Share Analysis
- 12.3.2 Top 3 Companies Market Share Analysis
- 12.4. List of Potential Customers
- 13. Research Methodology
List of Figures
- Figure 1: Global Air Quality Monitoring Service Revenue Breakdown (undefined, %) by Region 2025 & 2033
- Figure 2: North America Air Quality Monitoring Service Revenue (undefined), by Application 2025 & 2033
- Figure 3: North America Air Quality Monitoring Service Revenue Share (%), by Application 2025 & 2033
- Figure 4: North America Air Quality Monitoring Service Revenue (undefined), by Types 2025 & 2033
- Figure 5: North America Air Quality Monitoring Service Revenue Share (%), by Types 2025 & 2033
- Figure 6: North America Air Quality Monitoring Service Revenue (undefined), by Country 2025 & 2033
- Figure 7: North America Air Quality Monitoring Service Revenue Share (%), by Country 2025 & 2033
- Figure 8: South America Air Quality Monitoring Service Revenue (undefined), by Application 2025 & 2033
- Figure 9: South America Air Quality Monitoring Service Revenue Share (%), by Application 2025 & 2033
- Figure 10: South America Air Quality Monitoring Service Revenue (undefined), by Types 2025 & 2033
- Figure 11: South America Air Quality Monitoring Service Revenue Share (%), by Types 2025 & 2033
- Figure 12: South America Air Quality Monitoring Service Revenue (undefined), by Country 2025 & 2033
- Figure 13: South America Air Quality Monitoring Service Revenue Share (%), by Country 2025 & 2033
- Figure 14: Europe Air Quality Monitoring Service Revenue (undefined), by Application 2025 & 2033
- Figure 15: Europe Air Quality Monitoring Service Revenue Share (%), by Application 2025 & 2033
- Figure 16: Europe Air Quality Monitoring Service Revenue (undefined), by Types 2025 & 2033
- Figure 17: Europe Air Quality Monitoring Service Revenue Share (%), by Types 2025 & 2033
- Figure 18: Europe Air Quality Monitoring Service Revenue (undefined), by Country 2025 & 2033
- Figure 19: Europe Air Quality Monitoring Service Revenue Share (%), by Country 2025 & 2033
- Figure 20: Middle East & Africa Air Quality Monitoring Service Revenue (undefined), by Application 2025 & 2033
- Figure 21: Middle East & Africa Air Quality Monitoring Service Revenue Share (%), by Application 2025 & 2033
- Figure 22: Middle East & Africa Air Quality Monitoring Service Revenue (undefined), by Types 2025 & 2033
- Figure 23: Middle East & Africa Air Quality Monitoring Service Revenue Share (%), by Types 2025 & 2033
- Figure 24: Middle East & Africa Air Quality Monitoring Service Revenue (undefined), by Country 2025 & 2033
- Figure 25: Middle East & Africa Air Quality Monitoring Service Revenue Share (%), by Country 2025 & 2033
- Figure 26: Asia Pacific Air Quality Monitoring Service Revenue (undefined), by Application 2025 & 2033
- Figure 27: Asia Pacific Air Quality Monitoring Service Revenue Share (%), by Application 2025 & 2033
- Figure 28: Asia Pacific Air Quality Monitoring Service Revenue (undefined), by Types 2025 & 2033
- Figure 29: Asia Pacific Air Quality Monitoring Service Revenue Share (%), by Types 2025 & 2033
- Figure 30: Asia Pacific Air Quality Monitoring Service Revenue (undefined), by Country 2025 & 2033
- Figure 31: Asia Pacific Air Quality Monitoring Service Revenue Share (%), by Country 2025 & 2033
List of Tables
- Table 1: Global Air Quality Monitoring Service Revenue undefined Forecast, by Application 2020 & 2033
- Table 2: Global Air Quality Monitoring Service Revenue undefined Forecast, by Types 2020 & 2033
- Table 3: Global Air Quality Monitoring Service Revenue undefined Forecast, by Region 2020 & 2033
- Table 4: Global Air Quality Monitoring Service Revenue undefined Forecast, by Application 2020 & 2033
- Table 5: Global Air Quality Monitoring Service Revenue undefined Forecast, by Types 2020 & 2033
- Table 6: Global Air Quality Monitoring Service Revenue undefined Forecast, by Country 2020 & 2033
- Table 7: United States Air Quality Monitoring Service Revenue (undefined) Forecast, by Application 2020 & 2033
- Table 8: Canada Air Quality Monitoring Service Revenue (undefined) Forecast, by Application 2020 & 2033
- Table 9: Mexico Air Quality Monitoring Service Revenue (undefined) Forecast, by Application 2020 & 2033
- Table 10: Global Air Quality Monitoring Service Revenue undefined Forecast, by Application 2020 & 2033
- Table 11: Global Air Quality Monitoring Service Revenue undefined Forecast, by Types 2020 & 2033
- Table 12: Global Air Quality Monitoring Service Revenue undefined Forecast, by Country 2020 & 2033
- Table 13: Brazil Air Quality Monitoring Service Revenue (undefined) Forecast, by Application 2020 & 2033
- Table 14: Argentina Air Quality Monitoring Service Revenue (undefined) Forecast, by Application 2020 & 2033
- Table 15: Rest of South America Air Quality Monitoring Service Revenue (undefined) Forecast, by Application 2020 & 2033
- Table 16: Global Air Quality Monitoring Service Revenue undefined Forecast, by Application 2020 & 2033
- Table 17: Global Air Quality Monitoring Service Revenue undefined Forecast, by Types 2020 & 2033
- Table 18: Global Air Quality Monitoring Service Revenue undefined Forecast, by Country 2020 & 2033
- Table 19: United Kingdom Air Quality Monitoring Service Revenue (undefined) Forecast, by Application 2020 & 2033
- Table 20: Germany Air Quality Monitoring Service Revenue (undefined) Forecast, by Application 2020 & 2033
- Table 21: France Air Quality Monitoring Service Revenue (undefined) Forecast, by Application 2020 & 2033
- Table 22: Italy Air Quality Monitoring Service Revenue (undefined) Forecast, by Application 2020 & 2033
- Table 23: Spain Air Quality Monitoring Service Revenue (undefined) Forecast, by Application 2020 & 2033
- Table 24: Russia Air Quality Monitoring Service Revenue (undefined) Forecast, by Application 2020 & 2033
- Table 25: Benelux Air Quality Monitoring Service Revenue (undefined) Forecast, by Application 2020 & 2033
- Table 26: Nordics Air Quality Monitoring Service Revenue (undefined) Forecast, by Application 2020 & 2033
- Table 27: Rest of Europe Air Quality Monitoring Service Revenue (undefined) Forecast, by Application 2020 & 2033
- Table 28: Global Air Quality Monitoring Service Revenue undefined Forecast, by Application 2020 & 2033
- Table 29: Global Air Quality Monitoring Service Revenue undefined Forecast, by Types 2020 & 2033
- Table 30: Global Air Quality Monitoring Service Revenue undefined Forecast, by Country 2020 & 2033
- Table 31: Turkey Air Quality Monitoring Service Revenue (undefined) Forecast, by Application 2020 & 2033
- Table 32: Israel Air Quality Monitoring Service Revenue (undefined) Forecast, by Application 2020 & 2033
- Table 33: GCC Air Quality Monitoring Service Revenue (undefined) Forecast, by Application 2020 & 2033
- Table 34: North Africa Air Quality Monitoring Service Revenue (undefined) Forecast, by Application 2020 & 2033
- Table 35: South Africa Air Quality Monitoring Service Revenue (undefined) Forecast, by Application 2020 & 2033
- Table 36: Rest of Middle East & Africa Air Quality Monitoring Service Revenue (undefined) Forecast, by Application 2020 & 2033
- Table 37: Global Air Quality Monitoring Service Revenue undefined Forecast, by Application 2020 & 2033
- Table 38: Global Air Quality Monitoring Service Revenue undefined Forecast, by Types 2020 & 2033
- Table 39: Global Air Quality Monitoring Service Revenue undefined Forecast, by Country 2020 & 2033
- Table 40: China Air Quality Monitoring Service Revenue (undefined) Forecast, by Application 2020 & 2033
- Table 41: India Air Quality Monitoring Service Revenue (undefined) Forecast, by Application 2020 & 2033
- Table 42: Japan Air Quality Monitoring Service Revenue (undefined) Forecast, by Application 2020 & 2033
- Table 43: South Korea Air Quality Monitoring Service Revenue (undefined) Forecast, by Application 2020 & 2033
- Table 44: ASEAN Air Quality Monitoring Service Revenue (undefined) Forecast, by Application 2020 & 2033
- Table 45: Oceania Air Quality Monitoring Service Revenue (undefined) Forecast, by Application 2020 & 2033
- Table 46: Rest of Asia Pacific Air Quality Monitoring Service Revenue (undefined) Forecast, by Application 2020 & 2033
Frequently Asked Questions
1. What is the projected Compound Annual Growth Rate (CAGR) of the Air Quality Monitoring Service?
The projected CAGR is approximately 6.8%.
2. Which companies are prominent players in the Air Quality Monitoring Service?
Key companies in the market include CASHINS And Associates, Focus Environmental, C.G. Laboratories, 1Source Safety And Health, Mechanical Systems, SGS, CMA Testing, Aeroqual, Envea.
3. What are the main segments of the Air Quality Monitoring Service?
The market segments include Application, Types.
4. Can you provide details about the market size?
The market size is estimated to be USD XXX N/A as of 2022.
5. What are some drivers contributing to market growth?
N/A
6. What are the notable trends driving market growth?
N/A
7. Are there any restraints impacting market growth?
N/A
8. Can you provide examples of recent developments in the market?
N/A
9. What pricing options are available for accessing the report?
Pricing options include single-user, multi-user, and enterprise licenses priced at USD 4350.00, USD 6525.00, and USD 8700.00 respectively.
10. Is the market size provided in terms of value or volume?
The market size is provided in terms of value, measured in N/A.
11. Are there any specific market keywords associated with the report?
Yes, the market keyword associated with the report is "Air Quality Monitoring Service," which aids in identifying and referencing the specific market segment covered.
12. How do I determine which pricing option suits my needs best?
The pricing options vary based on user requirements and access needs. Individual users may opt for single-user licenses, while businesses requiring broader access may choose multi-user or enterprise licenses for cost-effective access to the report.
13. Are there any additional resources or data provided in the Air Quality Monitoring Service report?
While the report offers comprehensive insights, it's advisable to review the specific contents or supplementary materials provided to ascertain if additional resources or data are available.
14. How can I stay updated on further developments or reports in the Air Quality Monitoring Service?
To stay informed about further developments, trends, and reports in the Air Quality Monitoring Service, consider subscribing to industry newsletters, following relevant companies and organizations, or regularly checking reputable industry news sources and publications.
Methodology
Step 1 - Identification of Relevant Samples Size from Population Database


Step 2 - Approaches for Defining Global Market Size (Value, Volume* & Price*)

Note*: In applicable scenarios
Step 3 - Data Sources
Primary Research
- Web Analytics
- Survey Reports
- Research Institute
- Latest Research Reports
- Opinion Leaders
Secondary Research
- Annual Reports
- White Paper
- Latest Press Release
- Industry Association
- Paid Database
- Investor Presentations

Step 4 - Data Triangulation
Involves using different sources of information in order to increase the validity of a study
These sources are likely to be stakeholders in a program - participants, other researchers, program staff, other community members, and so on.
Then we put all data in single framework & apply various statistical tools to find out the dynamic on the market.
During the analysis stage, feedback from the stakeholder groups would be compared to determine areas of agreement as well as areas of divergence