

Key Insights
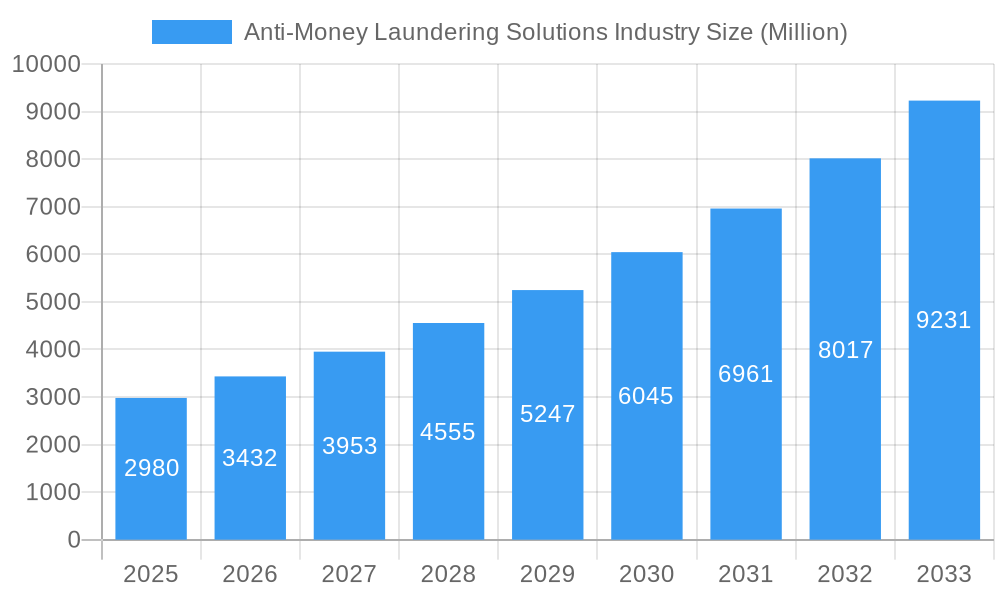
The global Anti-Money Laundering (AML) Solutions market is poised for substantial growth, projected to reach approximately USD 2.98 billion in 2025. This robust expansion is fueled by an impressive Compound Annual Growth Rate (CAGR) of 15.06%, indicating a dynamic and rapidly evolving landscape. The increasing stringency of regulatory frameworks worldwide, coupled with a surge in sophisticated financial crimes, necessitates the adoption of advanced AML solutions. Financial institutions are actively investing in technologies that enhance Know Your Customer (KYC) processes, improve compliance reporting accuracy, and enable real-time transaction monitoring. The demand for integrated solutions that streamline auditing and reporting functions is also a significant driver, as organizations strive for greater operational efficiency and risk mitigation.
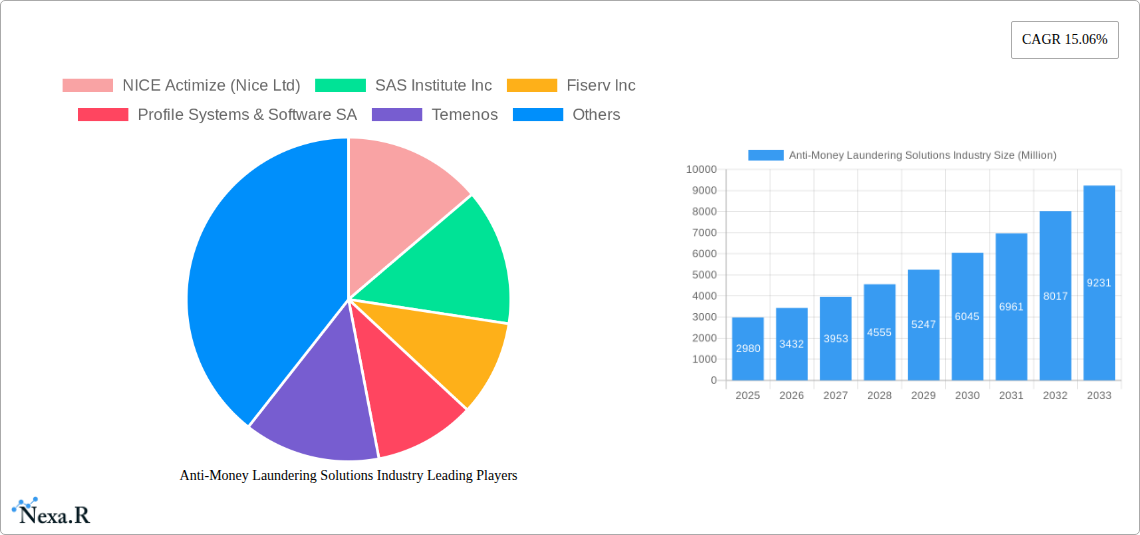
Anti-Money Laundering Solutions Industry Market Size (In Billion)
The market's trajectory is further shaped by key trends such as the integration of artificial intelligence (AI) and machine learning (ML) for predictive analytics and anomaly detection, alongside the growing adoption of cloud-based AML solutions for scalability and cost-effectiveness. While the market experiences strong tailwinds, certain restraints, such as the high implementation costs of sophisticated AML systems and the complexity of adapting to ever-changing regulations, may present challenges for some organizations. However, the overwhelming need to combat financial crime and maintain regulatory compliance is expected to outweigh these hurdles. Key market segments include software and services, with a notable shift towards on-cloud deployment models. Leading companies like NICE Actimize, SAS Institute, and Fiserv are at the forefront of innovation, offering comprehensive suites of AML solutions that cater to the evolving needs of the financial sector.
Anti-Money Laundering Solutions Industry Company Market Share
Comprehensive Anti-Money Laundering (AML) Solutions Market Report: Navigating Regulatory Compliance and Financial Crime Prevention (2019-2033)
This in-depth report provides a strategic analysis of the global Anti-Money Laundering (AML) Solutions market, offering crucial insights for stakeholders navigating the complex landscape of financial crime prevention. Covering the period from 2019 to 2033, with a base year of 2025, this research delves into market dynamics, growth trends, regional dominance, product innovations, key drivers, challenges, emerging opportunities, and the influential players shaping this vital sector. Understand the parent and child market segments to identify comprehensive growth avenues and strategic advantages.
Anti-Money Laundering Solutions Industry Market Dynamics & Structure
The Anti-Money Laundering (AML) Solutions market is characterized by a moderately concentrated structure, driven by significant technological innovation and an increasingly stringent global regulatory framework. Key drivers include the escalating sophistication of financial crimes, the need for robust Know Your Customer (KYC) systems, and the demand for efficient transaction monitoring. Competitive product substitutes, while present in rudimentary forms, are largely overshadowed by the advanced capabilities offered by specialized AML software and services. End-user demographics are predominantly financial institutions—banks, credit unions, investment firms, and insurance companies—requiring comprehensive compliance reporting and auditing tools. Mergers and acquisitions (M&A) trends are active, as larger players seek to consolidate market share, enhance their solution portfolios, and expand their geographical reach. For instance, the acquisition of FICO's Siron AML solutions by IMTF signifies a strategic consolidation. Innovation barriers are primarily associated with the high cost of R&D, the need for specialized expertise, and the constant adaptation to evolving regulatory requirements. The market is projected to see substantial growth, with M&A deal volumes expected to rise as firms seek to gain a competitive edge.
- Market Concentration: Moderately concentrated, with key players holding significant market shares.
- Technological Innovation Drivers: AI, machine learning for anomaly detection, cloud-based solutions, and advanced analytics for risk assessment.
- Regulatory Frameworks: Growing stringency of global AML regulations (e.g., FATF recommendations, U.S. Bank Secrecy Act, EU's AML Directives) is a primary growth driver.
- Competitive Product Substitutes: Primarily basic data analytics tools and manual compliance processes, which are increasingly inadequate.
- End-User Demographics: Global financial institutions, payment processors, and fintech companies.
- M&A Trends: Strategic acquisitions to expand solution offerings, gain new technologies, and increase market footprint.
- Innovation Barriers: High development costs, evolving regulatory landscapes, talent acquisition challenges, and integration complexities.
- Quantitative Insights: The AML solutions market is anticipated to witness a significant increase in M&A activities, with an estimated 15-20% of transactions focused on acquiring technological capabilities or market access.
Anti-Money Laundering Solutions Industry Growth Trends & Insights
The Anti-Money Laundering (AML) Solutions market is on a robust growth trajectory, driven by an escalating awareness of financial crime and the persistent evolution of regulatory mandates. The market size is projected to expand significantly, fueled by increasing adoption rates of advanced AML software and services across various financial sectors globally. Technological disruptions are a constant theme, with the integration of artificial intelligence (AI) and machine learning (ML) revolutionizing transaction monitoring, fraud detection, and risk assessment capabilities. These technologies enable more accurate anomaly detection, reduce false positives, and enhance the overall efficiency of compliance operations. Consumer behavior shifts are also playing a role, as financial institutions increasingly prioritize customer due diligence (CDD) and beneficial ownership identification to mitigate reputational risk and ensure regulatory adherence. The global AML solutions market is estimated to grow from approximately $5,000 million in 2024 to over $12,000 million by 2033, exhibiting a Compound Annual Growth Rate (CAGR) of around 10.5% during the forecast period (2025-2033). Market penetration is deepening, particularly in emerging economies where regulatory frameworks are being strengthened. The shift towards cloud-based deployment models is accelerating, offering scalability, cost-effectiveness, and enhanced accessibility for financial institutions of all sizes. The increasing complexity of money laundering schemes, including the use of cryptocurrencies and cross-border illicit transactions, necessitates continuous investment in sophisticated AML solutions. This demand is further amplified by the growing focus on combating terrorist financing (CTF) and sanctions evasion, pushing for more comprehensive and integrated compliance strategies. The historical period (2019-2024) has seen a steady climb in market value, laying the groundwork for accelerated expansion in the coming years. The estimated market size for 2025 is projected at $5,700 million, with significant contributions from both software and service segments. This sustained growth underscores the indispensable nature of effective AML solutions in safeguarding the integrity of the global financial system and preventing illicit financial flows.
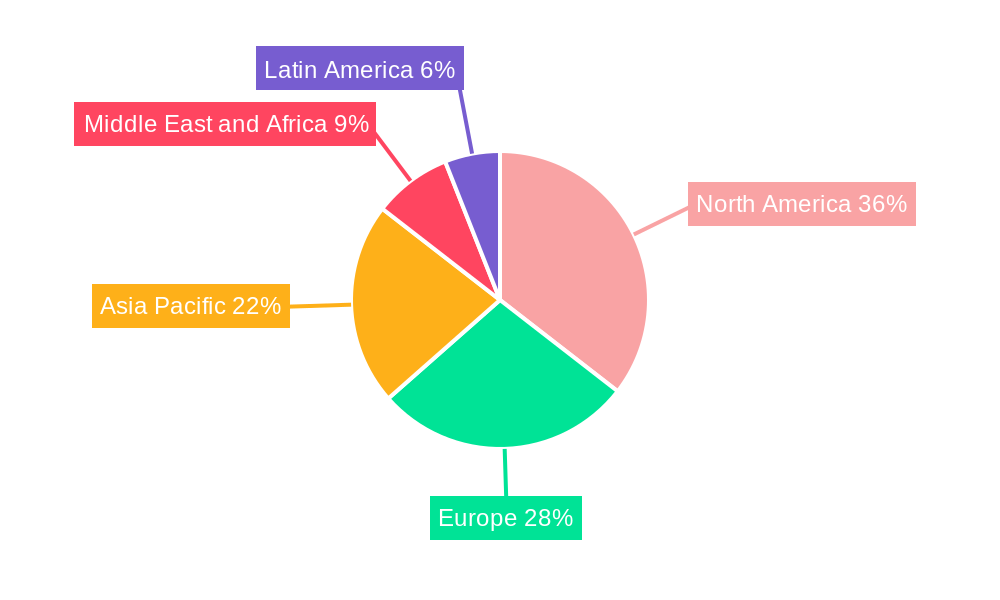
Dominant Regions, Countries, or Segments in Anti-Money Laundering Solutions Industry
The Anti-Money Laundering (AML) Solutions industry is witnessing significant dominance from North America, particularly the United States, driven by its stringent regulatory environment and a high concentration of major financial institutions. This region consistently leads in adopting advanced AML software and services, including sophisticated Know Your Customer (KYC) systems and real-time transaction monitoring solutions. The demand for robust compliance reporting and auditing capabilities further solidifies North America's leading position.
Dominant Region: North America (USA and Canada)
- Key Drivers: Strict regulatory enforcement (e.g., Bank Secrecy Act), high financial crime rates, and extensive adoption of advanced financial technologies.
- Market Share: Estimated to hold over 35% of the global AML solutions market.
- Growth Potential: Continued investment in AI-driven solutions and cloud-based platforms.
Dominant Segment (Solutions): Transaction Monitoring
- Key Drivers: The core of AML compliance, essential for detecting suspicious activities and preventing financial crimes. The increasing volume and complexity of financial transactions necessitate highly efficient monitoring systems.
- Market Share: Represents approximately 30% of the total AML solutions market by revenue.
- Growth Potential: Significant growth driven by real-time analytics, anomaly detection, and machine learning integration.
Dominant Segment (Type): Software
- Key Drivers: Software solutions form the backbone of AML compliance, offering scalable and automated capabilities for KYC, transaction monitoring, and reporting. The increasing reliance on technology for regulatory adherence fuels software demand.
- Market Share: Accounts for roughly 65% of the market.
- Growth Potential: Driven by cloud-native solutions, modular architectures, and enhanced integration capabilities.
Dominant Segment (Deployment Model): On-cloud
- Key Drivers: Cloud deployment offers scalability, flexibility, cost-efficiency, and faster deployment compared to on-premise solutions, aligning with the digital transformation initiatives of financial institutions.
- Market Share: Projected to grow substantially, currently holding over 55% of the market.
- Growth Potential: Continued adoption by small and medium-sized enterprises (SMEs) and large enterprises alike due to its accessibility and reduced infrastructure overhead.
Europe, particularly the UK and EU member states, is the second-largest market, driven by evolving AML directives and a strong emphasis on data privacy and regulatory compliance. Asia-Pacific is emerging as a high-growth region due to increasing financial inclusion, a rise in digital transactions, and the implementation of stricter AML regulations. The parent market, encompassing all AML solutions, is further dissected by child markets such as specialized KYC solutions, transaction monitoring platforms, and compliance management software, each with its own growth dynamics and adoption rates.
Anti-Money Laundering Solutions Industry Product Landscape
The product landscape of the Anti-Money Laundering (AML) Solutions industry is characterized by a sophisticated array of offerings designed to combat financial crime effectively. Innovations are centered around advanced analytics, AI, and machine learning to enhance transaction monitoring, identify suspicious patterns, and streamline Know Your Customer (KYC) processes. Solutions now offer real-time risk scoring, behavioral analytics, and sophisticated fraud detection capabilities. Key features include automated entity resolution, adverse media screening, and robust compliance reporting modules that integrate seamlessly with existing financial systems. Unique selling propositions often lie in the accuracy of anomaly detection, the speed of data processing, and the intuitive user interfaces that empower compliance teams. Technological advancements are focused on addressing emerging threats like cryptocurrency money laundering and the use of synthetic identities, making these solutions indispensable for modern financial institutions.
Key Drivers, Barriers & Challenges in Anti-Money Laundering Solutions Industry
The Anti-Money Laundering (AML) Solutions industry is propelled by a confluence of powerful drivers. The ever-increasing volume and complexity of financial crimes worldwide, coupled with stringent regulatory mandates from global bodies like FATF and national authorities, serve as primary catalysts. Technological advancements, particularly in AI and machine learning, are enabling more effective anomaly detection and risk assessment, driving demand for sophisticated solutions. Furthermore, the growing emphasis on corporate social responsibility and reputational risk management compels organizations to invest in robust AML frameworks. The expansion of digital banking and cross-border transactions also necessitates enhanced compliance measures.
Conversely, significant barriers and challenges impede market growth. The high cost of implementing and maintaining advanced AML solutions, especially for smaller financial institutions, remains a substantial hurdle. The scarcity of skilled professionals in AML compliance and data analytics further exacerbates this challenge. Evolving regulatory landscapes require constant adaptation, leading to increased R&D costs and implementation complexities. Supply chain issues can impact the availability of specialized hardware and software components. Competitive pressures from both established players and new entrants, as well as integration challenges with legacy systems, also present significant obstacles to widespread adoption and market expansion. The estimated market impact of these challenges can translate to delayed adoption cycles and increased operational expenditure for financial institutions.
Emerging Opportunities in Anti-Money Laundering Solutions Industry
Emerging opportunities within the Anti-Money Laundering (AML) Solutions industry are ripe for exploitation. The burgeoning fintech sector, with its innovative payment systems and digital wallets, presents a significant untapped market for tailored AML solutions that address the unique risks associated with these platforms. The increasing adoption of cryptocurrencies and decentralized finance (DeFi) applications is creating a demand for specialized blockchain analytics and AML tools designed to monitor virtual asset transactions and identify illicit activities. Furthermore, the growing global focus on Environmental, Social, and Governance (ESG) principles is prompting a closer examination of money laundering risks within supply chains, opening avenues for solutions that integrate ESG compliance with AML monitoring. Evolving consumer preferences for secure and transparent financial services also drive the need for advanced identity verification and fraud prevention technologies, creating opportunities for innovative KYC and CDD solutions. The rise of RegTech (Regulatory Technology) continues to foster innovation, with opportunities for integrated platforms that offer a holistic approach to regulatory compliance.
Growth Accelerators in the Anti-Money Laundering Solutions Industry Industry
Several key catalysts are accelerating the growth of the Anti-Money Laundering (AML) Solutions industry. Technological breakthroughs, particularly in the application of artificial intelligence (AI) and machine learning (ML) for predictive analytics and anomaly detection, are significantly enhancing the efficacy of AML systems. Strategic partnerships between AML solution providers and financial institutions, as well as collaborations with cybersecurity firms, are fostering innovation and expanding market reach. The increasing global regulatory convergence and the harmonization of AML standards across different jurisdictions are simplifying compliance efforts and driving demand for standardized solutions. Furthermore, market expansion strategies, including the penetration into emerging economies with rapidly developing financial sectors and growing regulatory frameworks, are proving to be significant growth accelerators. The ongoing digital transformation of the financial services industry, leading to increased online transactions and customer onboarding, inherently boosts the need for robust digital AML solutions.
Key Players Shaping the Anti-Money Laundering Solutions Industry Market
- NICE Actimize (Nice Ltd)
- SAS Institute Inc
- Fiserv Inc
- Profile Systems & Software SA
- Temenos
- Refinitiv Ltd
- Experian Information Solutions Inc (Experian Ltd)
- Tata Consultancy Services Limited
- Fair Isaac Corporation (FICO)
- Intellect Design Arena
- Oracle Corporation
- Symphony Innovation LLC
- Fidelity National Information Services Inc (FIS)
- ACI Worldwide Inc
- Wolters Kluwer NV
- Ltimindtree Limited
Notable Milestones in Anti-Money Laundering Solutions Industry Sector
- January 2023: IMTF acquired the Siron anti-money laundering and compliance solutions from US-based FICO Corporation, significantly expanding IMTF's global operations in anti-financial crime solutions.
- February 2023: Profile Software successfully implemented its RiskAvert solution at the Cooperative Bank of Epirus, enhancing risk management and capital requirements calculations, including compliance with the EU Capital Requirements Regulation/Directive (CRR/CRD) framework.
In-Depth Anti-Money Laundering Solutions Industry Market Outlook
The Anti-Money Laundering (AML) Solutions industry is poised for sustained and accelerated growth, driven by an intensifying global fight against financial crime and an evolving regulatory landscape. Future market potential is substantial, fueled by the increasing adoption of AI and ML for advanced fraud detection and transaction monitoring, offering greater accuracy and efficiency. Strategic opportunities lie in catering to the burgeoning fintech sector, developing specialized solutions for cryptocurrency and DeFi transactions, and integrating AML capabilities with broader ESG compliance frameworks. The ongoing digital transformation across financial services necessitates robust, scalable, and cloud-native AML solutions. As regulatory scrutiny continues to rise worldwide, investment in comprehensive AML compliance will remain a top priority for financial institutions, ensuring a robust and expanding market for innovative AML solutions.
Anti-Money Laundering Solutions Industry Segmentation
-
1. Solutions
- 1.1. Know Your Customer (KYC) Systems
- 1.2. Compliance Reporting
- 1.3. Transaction Monitoring
- 1.4. Auditing and Reporting
- 1.5. Other Solutions
-
2. Type
- 2.1. Software
- 2.2. Services
-
3. Deployment Model
- 3.1. On-cloud
- 3.2. On-premise
Anti-Money Laundering Solutions Industry Segmentation By Geography
-
1. North America
- 1.1. United States
- 1.2. Canada
-
2. Europe
- 2.1. United Kingdom
- 2.2. Germany
- 2.3. France
- 2.4. Spain
- 2.5. Rest of Europe
-
3. Asia Pacific
- 3.1. China
- 3.2. Japan
- 3.3. India
- 3.4. Southeast Asia
- 3.5. Rest of Asia Pacific
- 4. Latin America
- 5. Middle East and Africa
Anti-Money Laundering Solutions Industry Regional Market Share
Geographic Coverage of Anti-Money Laundering Solutions Industry
Anti-Money Laundering Solutions Industry REPORT HIGHLIGHTS
| Aspects | Details |
|---|---|
| Study Period | 2020-2034 |
| Base Year | 2025 |
| Estimated Year | 2026 |
| Forecast Period | 2026-2034 |
| Historical Period | 2020-2025 |
| Growth Rate | CAGR of 15.06% from 2020-2034 |
| Segmentation |
|
Table of Contents
- 1. Introduction
- 1.1. Research Scope
- 1.2. Market Segmentation
- 1.3. Research Objective
- 1.4. Definitions and Assumptions
- 2. Executive Summary
- 2.1. Market Snapshot
- 3. Market Dynamics
- 3.1. Market Drivers
- 3.2. Market Restrains
- 3.3. Market Trends
- 3.4. Market Opportunities
- 4. Market Factor Analysis
- 4.1. Porters Five Forces
- 4.1.1. Bargaining Power of Suppliers
- 4.1.2. Bargaining Power of Buyers
- 4.1.3. Threat of New Entrants
- 4.1.4. Threat of Substitutes
- 4.1.5. Competitive Rivalry
- 4.2. PESTEL analysis
- 4.3. BCG Analysis
- 4.3.1. Stars (High Growth, High Market Share)
- 4.3.2. Cash Cows (Low Growth, High Market Share)
- 4.3.3. Question Mark (High Growth, Low Market Share)
- 4.3.4. Dogs (Low Growth, Low Market Share)
- 4.4. Ansoff Matrix Analysis
- 4.5. Supply Chain Analysis
- 4.6. Regulatory Landscape
- 4.7. Current Market Potential and Opportunity Assessment (TAM–SAM–SOM Framework)
- 4.8. NRP Analyst Note
- 4.1. Porters Five Forces
- 5. Market Analysis, Insights and Forecast 2021-2033
- 5.1. Market Analysis, Insights and Forecast - by Solutions
- 5.1.1. Know Your Customer (KYC) Systems
- 5.1.2. Compliance Reporting
- 5.1.3. Transaction Monitoring
- 5.1.4. Auditing and Reporting
- 5.1.5. Other Solutions
- 5.2. Market Analysis, Insights and Forecast - by Type
- 5.2.1. Software
- 5.2.2. Services
- 5.3. Market Analysis, Insights and Forecast - by Deployment Model
- 5.3.1. On-cloud
- 5.3.2. On-premise
- 5.4. Market Analysis, Insights and Forecast - by Region
- 5.4.1. North America
- 5.4.2. Europe
- 5.4.3. Asia Pacific
- 5.4.4. Latin America
- 5.4.5. Middle East and Africa
- 5.1. Market Analysis, Insights and Forecast - by Solutions
- 6. Global Anti-Money Laundering Solutions Industry Analysis, Insights and Forecast, 2021-2033
- 6.1. Market Analysis, Insights and Forecast - by Solutions
- 6.1.1. Know Your Customer (KYC) Systems
- 6.1.2. Compliance Reporting
- 6.1.3. Transaction Monitoring
- 6.1.4. Auditing and Reporting
- 6.1.5. Other Solutions
- 6.2. Market Analysis, Insights and Forecast - by Type
- 6.2.1. Software
- 6.2.2. Services
- 6.3. Market Analysis, Insights and Forecast - by Deployment Model
- 6.3.1. On-cloud
- 6.3.2. On-premise
- 6.1. Market Analysis, Insights and Forecast - by Solutions
- 7. North America Anti-Money Laundering Solutions Industry Analysis, Insights and Forecast, 2020-2032
- 7.1. Market Analysis, Insights and Forecast - by Solutions
- 7.1.1. Know Your Customer (KYC) Systems
- 7.1.2. Compliance Reporting
- 7.1.3. Transaction Monitoring
- 7.1.4. Auditing and Reporting
- 7.1.5. Other Solutions
- 7.2. Market Analysis, Insights and Forecast - by Type
- 7.2.1. Software
- 7.2.2. Services
- 7.3. Market Analysis, Insights and Forecast - by Deployment Model
- 7.3.1. On-cloud
- 7.3.2. On-premise
- 7.1. Market Analysis, Insights and Forecast - by Solutions
- 8. Europe Anti-Money Laundering Solutions Industry Analysis, Insights and Forecast, 2020-2032
- 8.1. Market Analysis, Insights and Forecast - by Solutions
- 8.1.1. Know Your Customer (KYC) Systems
- 8.1.2. Compliance Reporting
- 8.1.3. Transaction Monitoring
- 8.1.4. Auditing and Reporting
- 8.1.5. Other Solutions
- 8.2. Market Analysis, Insights and Forecast - by Type
- 8.2.1. Software
- 8.2.2. Services
- 8.3. Market Analysis, Insights and Forecast - by Deployment Model
- 8.3.1. On-cloud
- 8.3.2. On-premise
- 8.1. Market Analysis, Insights and Forecast - by Solutions
- 9. Asia Pacific Anti-Money Laundering Solutions Industry Analysis, Insights and Forecast, 2020-2032
- 9.1. Market Analysis, Insights and Forecast - by Solutions
- 9.1.1. Know Your Customer (KYC) Systems
- 9.1.2. Compliance Reporting
- 9.1.3. Transaction Monitoring
- 9.1.4. Auditing and Reporting
- 9.1.5. Other Solutions
- 9.2. Market Analysis, Insights and Forecast - by Type
- 9.2.1. Software
- 9.2.2. Services
- 9.3. Market Analysis, Insights and Forecast - by Deployment Model
- 9.3.1. On-cloud
- 9.3.2. On-premise
- 9.1. Market Analysis, Insights and Forecast - by Solutions
- 10. Latin America Anti-Money Laundering Solutions Industry Analysis, Insights and Forecast, 2020-2032
- 10.1. Market Analysis, Insights and Forecast - by Solutions
- 10.1.1. Know Your Customer (KYC) Systems
- 10.1.2. Compliance Reporting
- 10.1.3. Transaction Monitoring
- 10.1.4. Auditing and Reporting
- 10.1.5. Other Solutions
- 10.2. Market Analysis, Insights and Forecast - by Type
- 10.2.1. Software
- 10.2.2. Services
- 10.3. Market Analysis, Insights and Forecast - by Deployment Model
- 10.3.1. On-cloud
- 10.3.2. On-premise
- 10.1. Market Analysis, Insights and Forecast - by Solutions
- 11. Middle East and Africa Anti-Money Laundering Solutions Industry Analysis, Insights and Forecast, 2020-2032
- 11.1. Market Analysis, Insights and Forecast - by Solutions
- 11.1.1. Know Your Customer (KYC) Systems
- 11.1.2. Compliance Reporting
- 11.1.3. Transaction Monitoring
- 11.1.4. Auditing and Reporting
- 11.1.5. Other Solutions
- 11.2. Market Analysis, Insights and Forecast - by Type
- 11.2.1. Software
- 11.2.2. Services
- 11.3. Market Analysis, Insights and Forecast - by Deployment Model
- 11.3.1. On-cloud
- 11.3.2. On-premise
- 11.1. Market Analysis, Insights and Forecast - by Solutions
- 12. Competitive Analysis
- 12.1. Company Profiles
- 12.1.1 NICE Actimize (Nice Ltd)
- 12.1.1.1. Company Overview
- 12.1.1.2. Products
- 12.1.1.3. Company Financials
- 12.1.1.4. SWOT Analysis
- 12.1.2 SAS Institute Inc
- 12.1.2.1. Company Overview
- 12.1.2.2. Products
- 12.1.2.3. Company Financials
- 12.1.2.4. SWOT Analysis
- 12.1.3 Fiserv Inc
- 12.1.3.1. Company Overview
- 12.1.3.2. Products
- 12.1.3.3. Company Financials
- 12.1.3.4. SWOT Analysis
- 12.1.4 Profile Systems & Software SA
- 12.1.4.1. Company Overview
- 12.1.4.2. Products
- 12.1.4.3. Company Financials
- 12.1.4.4. SWOT Analysis
- 12.1.5 Temenos
- 12.1.5.1. Company Overview
- 12.1.5.2. Products
- 12.1.5.3. Company Financials
- 12.1.5.4. SWOT Analysis
- 12.1.6 Refinitiv Ltd
- 12.1.6.1. Company Overview
- 12.1.6.2. Products
- 12.1.6.3. Company Financials
- 12.1.6.4. SWOT Analysis
- 12.1.7 Experian Information Solutions Inc (Experian Ltd)
- 12.1.7.1. Company Overview
- 12.1.7.2. Products
- 12.1.7.3. Company Financials
- 12.1.7.4. SWOT Analysis
- 12.1.8 Tata Consultancy Services Limited
- 12.1.8.1. Company Overview
- 12.1.8.2. Products
- 12.1.8.3. Company Financials
- 12.1.8.4. SWOT Analysis
- 12.1.9 Fair Isaac Corporation (FICO)
- 12.1.9.1. Company Overview
- 12.1.9.2. Products
- 12.1.9.3. Company Financials
- 12.1.9.4. SWOT Analysis
- 12.1.10 Intellect Design Arena*List Not Exhaustive
- 12.1.10.1. Company Overview
- 12.1.10.2. Products
- 12.1.10.3. Company Financials
- 12.1.10.4. SWOT Analysis
- 12.1.11 Oracle Corporation
- 12.1.11.1. Company Overview
- 12.1.11.2. Products
- 12.1.11.3. Company Financials
- 12.1.11.4. SWOT Analysis
- 12.1.12 Symphony Innovation LLC
- 12.1.12.1. Company Overview
- 12.1.12.2. Products
- 12.1.12.3. Company Financials
- 12.1.12.4. SWOT Analysis
- 12.1.13 Fidelity National Information Services Inc (FIS)
- 12.1.13.1. Company Overview
- 12.1.13.2. Products
- 12.1.13.3. Company Financials
- 12.1.13.4. SWOT Analysis
- 12.1.14 ACI Worldwide Inc
- 12.1.14.1. Company Overview
- 12.1.14.2. Products
- 12.1.14.3. Company Financials
- 12.1.14.4. SWOT Analysis
- 12.1.15 Wolters Kluwer NV
- 12.1.15.1. Company Overview
- 12.1.15.2. Products
- 12.1.15.3. Company Financials
- 12.1.15.4. SWOT Analysis
- 12.1.16 Ltimindtree Limited
- 12.1.16.1. Company Overview
- 12.1.16.2. Products
- 12.1.16.3. Company Financials
- 12.1.16.4. SWOT Analysis
- 12.1.1 NICE Actimize (Nice Ltd)
- 12.2. Market Entropy
- 12.2.1 Company's Key Areas Served
- 12.2.2 Recent Developments
- 12.3. Company Market Share Analysis 2025
- 12.3.1 Top 5 Companies Market Share Analysis
- 12.3.2 Top 3 Companies Market Share Analysis
- 12.4. List of Potential Customers
- 13. Research Methodology
List of Figures
- Figure 1: Global Anti-Money Laundering Solutions Industry Revenue Breakdown (Million, %) by Region 2025 & 2033
- Figure 2: North America Anti-Money Laundering Solutions Industry Revenue (Million), by Solutions 2025 & 2033
- Figure 3: North America Anti-Money Laundering Solutions Industry Revenue Share (%), by Solutions 2025 & 2033
- Figure 4: North America Anti-Money Laundering Solutions Industry Revenue (Million), by Type 2025 & 2033
- Figure 5: North America Anti-Money Laundering Solutions Industry Revenue Share (%), by Type 2025 & 2033
- Figure 6: North America Anti-Money Laundering Solutions Industry Revenue (Million), by Deployment Model 2025 & 2033
- Figure 7: North America Anti-Money Laundering Solutions Industry Revenue Share (%), by Deployment Model 2025 & 2033
- Figure 8: North America Anti-Money Laundering Solutions Industry Revenue (Million), by Country 2025 & 2033
- Figure 9: North America Anti-Money Laundering Solutions Industry Revenue Share (%), by Country 2025 & 2033
- Figure 10: Europe Anti-Money Laundering Solutions Industry Revenue (Million), by Solutions 2025 & 2033
- Figure 11: Europe Anti-Money Laundering Solutions Industry Revenue Share (%), by Solutions 2025 & 2033
- Figure 12: Europe Anti-Money Laundering Solutions Industry Revenue (Million), by Type 2025 & 2033
- Figure 13: Europe Anti-Money Laundering Solutions Industry Revenue Share (%), by Type 2025 & 2033
- Figure 14: Europe Anti-Money Laundering Solutions Industry Revenue (Million), by Deployment Model 2025 & 2033
- Figure 15: Europe Anti-Money Laundering Solutions Industry Revenue Share (%), by Deployment Model 2025 & 2033
- Figure 16: Europe Anti-Money Laundering Solutions Industry Revenue (Million), by Country 2025 & 2033
- Figure 17: Europe Anti-Money Laundering Solutions Industry Revenue Share (%), by Country 2025 & 2033
- Figure 18: Asia Pacific Anti-Money Laundering Solutions Industry Revenue (Million), by Solutions 2025 & 2033
- Figure 19: Asia Pacific Anti-Money Laundering Solutions Industry Revenue Share (%), by Solutions 2025 & 2033
- Figure 20: Asia Pacific Anti-Money Laundering Solutions Industry Revenue (Million), by Type 2025 & 2033
- Figure 21: Asia Pacific Anti-Money Laundering Solutions Industry Revenue Share (%), by Type 2025 & 2033
- Figure 22: Asia Pacific Anti-Money Laundering Solutions Industry Revenue (Million), by Deployment Model 2025 & 2033
- Figure 23: Asia Pacific Anti-Money Laundering Solutions Industry Revenue Share (%), by Deployment Model 2025 & 2033
- Figure 24: Asia Pacific Anti-Money Laundering Solutions Industry Revenue (Million), by Country 2025 & 2033
- Figure 25: Asia Pacific Anti-Money Laundering Solutions Industry Revenue Share (%), by Country 2025 & 2033
- Figure 26: Latin America Anti-Money Laundering Solutions Industry Revenue (Million), by Solutions 2025 & 2033
- Figure 27: Latin America Anti-Money Laundering Solutions Industry Revenue Share (%), by Solutions 2025 & 2033
- Figure 28: Latin America Anti-Money Laundering Solutions Industry Revenue (Million), by Type 2025 & 2033
- Figure 29: Latin America Anti-Money Laundering Solutions Industry Revenue Share (%), by Type 2025 & 2033
- Figure 30: Latin America Anti-Money Laundering Solutions Industry Revenue (Million), by Deployment Model 2025 & 2033
- Figure 31: Latin America Anti-Money Laundering Solutions Industry Revenue Share (%), by Deployment Model 2025 & 2033
- Figure 32: Latin America Anti-Money Laundering Solutions Industry Revenue (Million), by Country 2025 & 2033
- Figure 33: Latin America Anti-Money Laundering Solutions Industry Revenue Share (%), by Country 2025 & 2033
- Figure 34: Middle East and Africa Anti-Money Laundering Solutions Industry Revenue (Million), by Solutions 2025 & 2033
- Figure 35: Middle East and Africa Anti-Money Laundering Solutions Industry Revenue Share (%), by Solutions 2025 & 2033
- Figure 36: Middle East and Africa Anti-Money Laundering Solutions Industry Revenue (Million), by Type 2025 & 2033
- Figure 37: Middle East and Africa Anti-Money Laundering Solutions Industry Revenue Share (%), by Type 2025 & 2033
- Figure 38: Middle East and Africa Anti-Money Laundering Solutions Industry Revenue (Million), by Deployment Model 2025 & 2033
- Figure 39: Middle East and Africa Anti-Money Laundering Solutions Industry Revenue Share (%), by Deployment Model 2025 & 2033
- Figure 40: Middle East and Africa Anti-Money Laundering Solutions Industry Revenue (Million), by Country 2025 & 2033
- Figure 41: Middle East and Africa Anti-Money Laundering Solutions Industry Revenue Share (%), by Country 2025 & 2033
List of Tables
- Table 1: Global Anti-Money Laundering Solutions Industry Revenue Million Forecast, by Solutions 2020 & 2033
- Table 2: Global Anti-Money Laundering Solutions Industry Revenue Million Forecast, by Type 2020 & 2033
- Table 3: Global Anti-Money Laundering Solutions Industry Revenue Million Forecast, by Deployment Model 2020 & 2033
- Table 4: Global Anti-Money Laundering Solutions Industry Revenue Million Forecast, by Region 2020 & 2033
- Table 5: Global Anti-Money Laundering Solutions Industry Revenue Million Forecast, by Solutions 2020 & 2033
- Table 6: Global Anti-Money Laundering Solutions Industry Revenue Million Forecast, by Type 2020 & 2033
- Table 7: Global Anti-Money Laundering Solutions Industry Revenue Million Forecast, by Deployment Model 2020 & 2033
- Table 8: Global Anti-Money Laundering Solutions Industry Revenue Million Forecast, by Country 2020 & 2033
- Table 9: United States Anti-Money Laundering Solutions Industry Revenue (Million) Forecast, by Application 2020 & 2033
- Table 10: Canada Anti-Money Laundering Solutions Industry Revenue (Million) Forecast, by Application 2020 & 2033
- Table 11: Global Anti-Money Laundering Solutions Industry Revenue Million Forecast, by Solutions 2020 & 2033
- Table 12: Global Anti-Money Laundering Solutions Industry Revenue Million Forecast, by Type 2020 & 2033
- Table 13: Global Anti-Money Laundering Solutions Industry Revenue Million Forecast, by Deployment Model 2020 & 2033
- Table 14: Global Anti-Money Laundering Solutions Industry Revenue Million Forecast, by Country 2020 & 2033
- Table 15: United Kingdom Anti-Money Laundering Solutions Industry Revenue (Million) Forecast, by Application 2020 & 2033
- Table 16: Germany Anti-Money Laundering Solutions Industry Revenue (Million) Forecast, by Application 2020 & 2033
- Table 17: France Anti-Money Laundering Solutions Industry Revenue (Million) Forecast, by Application 2020 & 2033
- Table 18: Spain Anti-Money Laundering Solutions Industry Revenue (Million) Forecast, by Application 2020 & 2033
- Table 19: Rest of Europe Anti-Money Laundering Solutions Industry Revenue (Million) Forecast, by Application 2020 & 2033
- Table 20: Global Anti-Money Laundering Solutions Industry Revenue Million Forecast, by Solutions 2020 & 2033
- Table 21: Global Anti-Money Laundering Solutions Industry Revenue Million Forecast, by Type 2020 & 2033
- Table 22: Global Anti-Money Laundering Solutions Industry Revenue Million Forecast, by Deployment Model 2020 & 2033
- Table 23: Global Anti-Money Laundering Solutions Industry Revenue Million Forecast, by Country 2020 & 2033
- Table 24: China Anti-Money Laundering Solutions Industry Revenue (Million) Forecast, by Application 2020 & 2033
- Table 25: Japan Anti-Money Laundering Solutions Industry Revenue (Million) Forecast, by Application 2020 & 2033
- Table 26: India Anti-Money Laundering Solutions Industry Revenue (Million) Forecast, by Application 2020 & 2033
- Table 27: Southeast Asia Anti-Money Laundering Solutions Industry Revenue (Million) Forecast, by Application 2020 & 2033
- Table 28: Rest of Asia Pacific Anti-Money Laundering Solutions Industry Revenue (Million) Forecast, by Application 2020 & 2033
- Table 29: Global Anti-Money Laundering Solutions Industry Revenue Million Forecast, by Solutions 2020 & 2033
- Table 30: Global Anti-Money Laundering Solutions Industry Revenue Million Forecast, by Type 2020 & 2033
- Table 31: Global Anti-Money Laundering Solutions Industry Revenue Million Forecast, by Deployment Model 2020 & 2033
- Table 32: Global Anti-Money Laundering Solutions Industry Revenue Million Forecast, by Country 2020 & 2033
- Table 33: Global Anti-Money Laundering Solutions Industry Revenue Million Forecast, by Solutions 2020 & 2033
- Table 34: Global Anti-Money Laundering Solutions Industry Revenue Million Forecast, by Type 2020 & 2033
- Table 35: Global Anti-Money Laundering Solutions Industry Revenue Million Forecast, by Deployment Model 2020 & 2033
- Table 36: Global Anti-Money Laundering Solutions Industry Revenue Million Forecast, by Country 2020 & 2033
Frequently Asked Questions
1. What is the projected Compound Annual Growth Rate (CAGR) of the Anti-Money Laundering Solutions Industry?
The projected CAGR is approximately 15.06%.
2. Which companies are prominent players in the Anti-Money Laundering Solutions Industry?
Key companies in the market include NICE Actimize (Nice Ltd), SAS Institute Inc, Fiserv Inc, Profile Systems & Software SA, Temenos, Refinitiv Ltd, Experian Information Solutions Inc (Experian Ltd), Tata Consultancy Services Limited, Fair Isaac Corporation (FICO), Intellect Design Arena*List Not Exhaustive, Oracle Corporation, Symphony Innovation LLC, Fidelity National Information Services Inc (FIS), ACI Worldwide Inc, Wolters Kluwer NV, Ltimindtree Limited.
3. What are the main segments of the Anti-Money Laundering Solutions Industry?
The market segments include Solutions, Type, Deployment Model.
4. Can you provide details about the market size?
The market size is estimated to be USD 2.98 Million as of 2022.
5. What are some drivers contributing to market growth?
Increased Adoption of Digital/Mobile Payment Solutions; Stringent Government Regulations for Compliance Management.
6. What are the notable trends driving market growth?
Know Your Customer (KYC) Systems to Witness Major Growth.
7. Are there any restraints impacting market growth?
Lack of Skilled Professionals.
8. Can you provide examples of recent developments in the market?
January 2023 - IMTF, one of the leaders in regulatory technology and process automation for financial institutions, acquired the Siron anti-money laundering and compliance solutions developed by US-based FICO Corporation. With this acquisition, IMTF assumed the global operations of all Siron anti-financial crime solutions.
9. What pricing options are available for accessing the report?
Pricing options include single-user, multi-user, and enterprise licenses priced at USD 4750, USD 5250, and USD 8750 respectively.
10. Is the market size provided in terms of value or volume?
The market size is provided in terms of value, measured in Million.
11. Are there any specific market keywords associated with the report?
Yes, the market keyword associated with the report is "Anti-Money Laundering Solutions Industry," which aids in identifying and referencing the specific market segment covered.
12. How do I determine which pricing option suits my needs best?
The pricing options vary based on user requirements and access needs. Individual users may opt for single-user licenses, while businesses requiring broader access may choose multi-user or enterprise licenses for cost-effective access to the report.
13. Are there any additional resources or data provided in the Anti-Money Laundering Solutions Industry report?
While the report offers comprehensive insights, it's advisable to review the specific contents or supplementary materials provided to ascertain if additional resources or data are available.
14. How can I stay updated on further developments or reports in the Anti-Money Laundering Solutions Industry?
To stay informed about further developments, trends, and reports in the Anti-Money Laundering Solutions Industry, consider subscribing to industry newsletters, following relevant companies and organizations, or regularly checking reputable industry news sources and publications.
Methodology
Step 1 - Identification of Relevant Samples Size from Population Database


Step 2 - Approaches for Defining Global Market Size (Value, Volume* & Price*)

Note*: In applicable scenarios
Step 3 - Data Sources
Primary Research
- Web Analytics
- Survey Reports
- Research Institute
- Latest Research Reports
- Opinion Leaders
Secondary Research
- Annual Reports
- White Paper
- Latest Press Release
- Industry Association
- Paid Database
- Investor Presentations

Step 4 - Data Triangulation
Involves using different sources of information in order to increase the validity of a study
These sources are likely to be stakeholders in a program - participants, other researchers, program staff, other community members, and so on.
Then we put all data in single framework & apply various statistical tools to find out the dynamic on the market.
During the analysis stage, feedback from the stakeholder groups would be compared to determine areas of agreement as well as areas of divergence