

Key Insights
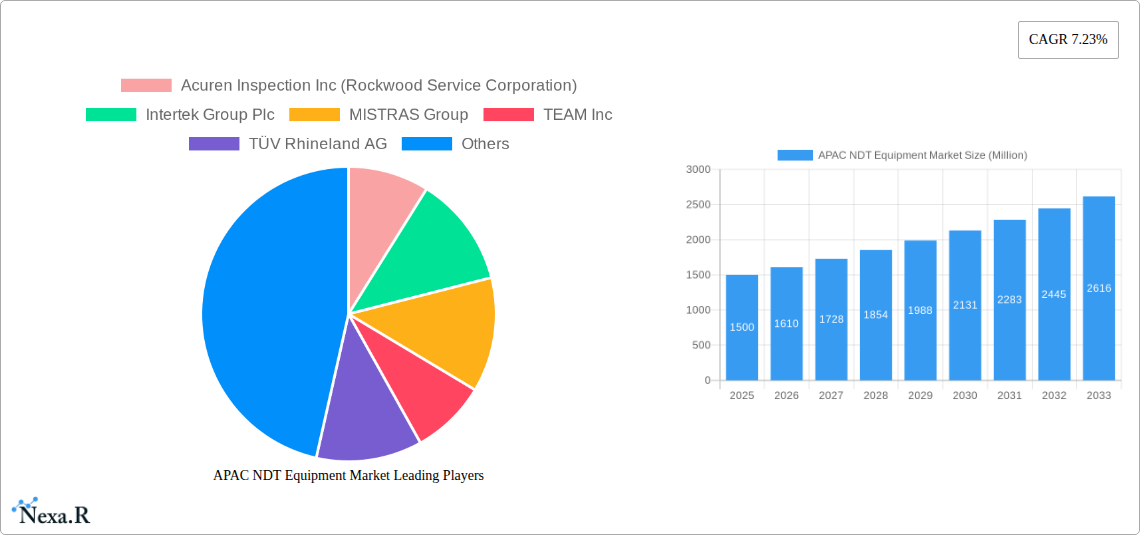
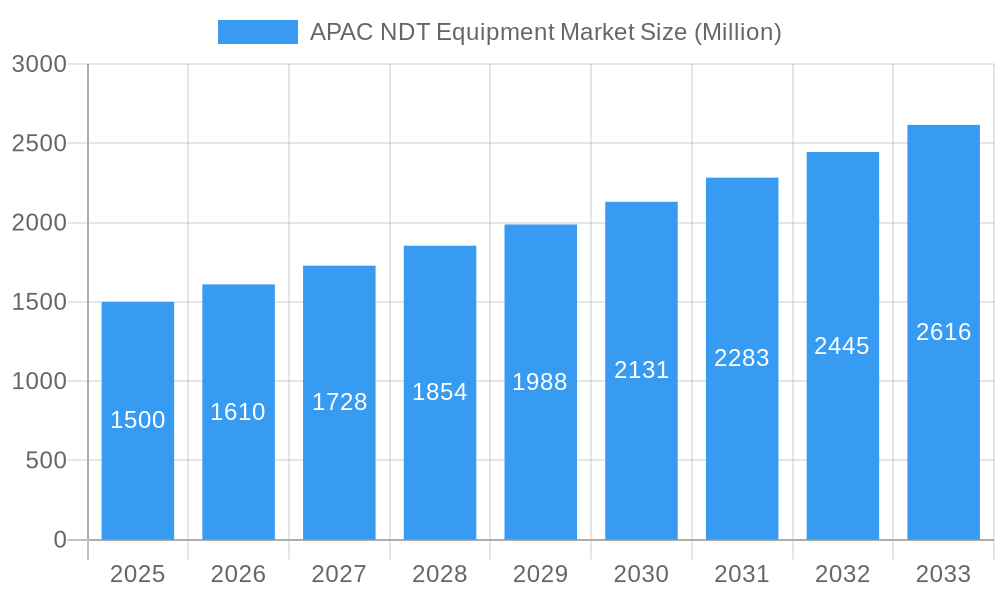
The Asia-Pacific (APAC) Non-Destructive Testing (NDT) equipment market is projected for significant expansion, driven by robust infrastructure investment in key economies like China, India, and Japan. Growth is further propelled by thriving industrial sectors such as automotive, aerospace & defense, and power & energy. The adoption of advanced NDT technologies, including Eddy Current and Magnetic Particle Testing, is increasing due to their superior accuracy and efficiency. Stringent safety regulations and a heightened focus on preventative maintenance across industries are also pivotal growth catalysts. While high initial investment and a shortage of skilled technicians pose challenges, the market demonstrates a positive trajectory. With a Compound Annual Growth Rate (CAGR) of 7.23%, the market is anticipated to reach a size of $5 billion by 2025, with strong growth expected in segments like Ultrasonic and Radiography Testing. The competitive landscape features both global and regional players, fostering innovation and competitive pricing. Japan and China lead the APAC market, with India and South Korea presenting considerable growth potential due to their expanding manufacturing sectors.
APAC NDT Equipment Market Market Size (In Billion)
Continued market expansion in APAC is intrinsically linked to regional economic growth and infrastructure development. Government initiatives supporting industrial modernization and enhanced safety standards are expected to accelerate this growth. Opportunities will emerge from the integration of NDT equipment with Industry 4.0 technologies and the increasing adoption of automation. Digitalization and data analytics, including AI-driven improvements in testing accuracy, will significantly shape the market during the forecast period. Companies are actively investing in R&D to develop more efficient and user-friendly NDT equipment, which will contribute to broader market penetration. The evolution of new materials and complex manufacturing processes further reinforces the indispensable role of NDT in quality control and safety assurance, thus bolstering market growth.
APAC NDT Equipment Market Company Market Share
This comprehensive report offers critical insights into the Asia-Pacific (APAC) Non-Destructive Testing (NDT) equipment market for industry professionals, investors, and strategic decision-makers. Analyzing the period from 2019 to 2033, with a detailed focus on the forecast period (2025-2033) and a base year of 2025, the report provides a granular understanding of market dynamics. Segmentation by technology type, end-user, and country highlights growth drivers, challenges, and opportunities. The report also profiles key industry players such as Acuren Inspection Inc, Intertek Group Plc, and MISTRAS Group, detailing their market contributions.
APAC NDT Equipment Market Dynamics & Structure
The APAC NDT equipment market is characterized by moderate concentration, with a few major players holding significant market share, but a large number of smaller, regional players also contributing. The market's growth is driven by technological advancements, stringent regulatory frameworks emphasizing quality control and safety across various industries, and the increasing demand for efficient and reliable inspection methods. Competitive pressures are evident, with companies continuously innovating to offer superior solutions. However, innovation is sometimes hampered by high R&D costs and the need for specialized expertise. Consolidation through mergers and acquisitions (M&A) is a prominent trend, with larger players seeking to expand their market reach and product portfolios. The number of M&A deals in the period 2019-2024 was xx, indicating a moderately active consolidation phase. End-user demographics are diversifying, with strong growth across sectors like oil & gas, power & energy, and construction.
- Market Concentration: Moderately concentrated, with top 5 players holding approximately xx% market share in 2024.
- Technological Innovation: Driven by advancements in AI, automation, and data analytics within NDT technologies.
- Regulatory Landscape: Stringent safety regulations across industries fuel demand for NDT equipment.
- Competitive Substitutes: Limited direct substitutes, but cost pressures exist from alternative inspection methods.
- M&A Activity: xx M&A deals in 2019-2024, indicating a moderate level of consolidation.
- End-user Demographics: Growth in oil & gas, power & energy, and construction sectors driving market expansion.
APAC NDT Equipment Market Growth Trends & Insights
The APAC NDT equipment market exhibited a CAGR of xx% during the historical period (2019-2024), reaching a market size of xx million units in 2024. This growth is attributed to several factors, including increasing infrastructure development across the region, the rising demand for quality control in manufacturing and construction, and the growing adoption of advanced NDT technologies. The market is expected to maintain a healthy growth trajectory during the forecast period (2025-2033), driven by continuous technological advancements, rising investments in infrastructure projects, and increasing awareness of the importance of asset integrity management. Market penetration of advanced technologies like Eddy Current Testing and Ultrasonic Testing is still relatively low, presenting significant growth opportunities. Consumer behavior shifts toward increased automation and efficiency across industries drive the uptake of sophisticated, automated NDT systems. The projected market size in 2033 is estimated to be xx million units, indicating substantial expansion opportunities in the coming years.
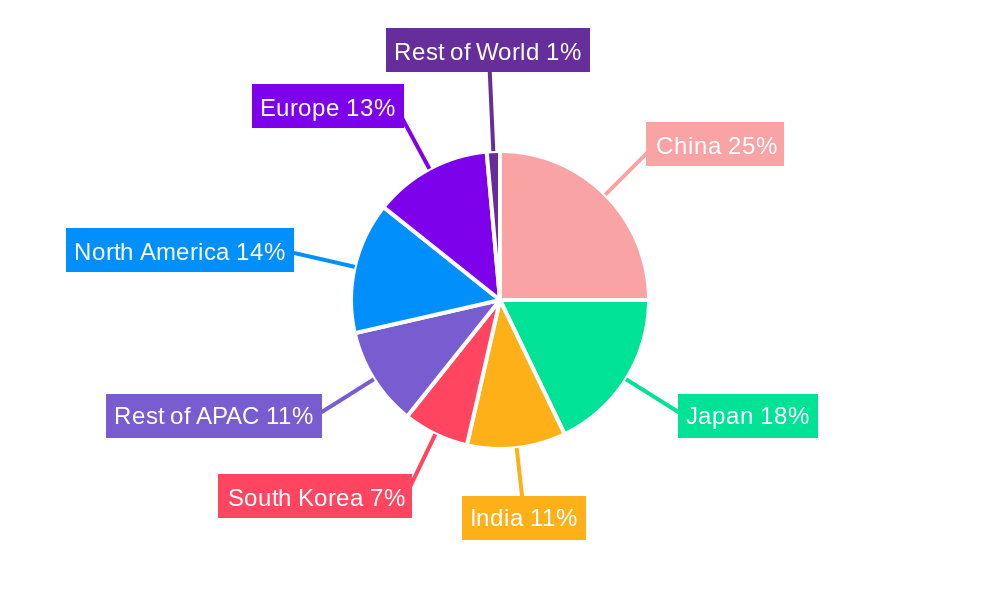
Dominant Regions, Countries, or Segments in APAC NDT Equipment Market
China dominates the APAC NDT equipment market, driven by its robust industrial sector, rapid infrastructure development, and significant government investments in manufacturing and energy infrastructure. Japan and India follow as key regional contributors, with South Korea and Singapore demonstrating substantial growth potential.
- China: Largest market driven by extensive industrial activity and infrastructure projects.
- Japan: Strong presence of advanced technology manufacturers and high adoption of NDT.
- India: Rapid industrialization and increasing focus on quality control driving market growth.
- Dominant Technology Segments: Ultrasonic Testing and Radiography Testing hold the largest market share due to their versatility and wide range of applications.
- Dominant End-User Segments: Oil & Gas, Power & Energy, and Construction sectors are leading consumers of NDT equipment.
APAP NDT Equipment Market Product Landscape
The APAP NDT equipment market offers a diverse range of products, from traditional methods such as liquid penetrant testing and magnetic particle testing to advanced technologies like ultrasonic testing (UT), radiographic testing (RT), and eddy current testing (ECT). These technologies are increasingly integrated with advanced data analytics and AI, leading to improved accuracy and efficiency. Several vendors offer portable and handheld devices, catering to diverse inspection requirements. The unique selling propositions often revolve around ease of use, enhanced accuracy, and faster data processing and analysis capabilities. Technological advancements include miniaturization, improved image quality, and greater automation capabilities.
Key Drivers, Barriers & Challenges in APAC NDT Equipment Market
Key Drivers:
- Strong economic growth across the APAC region leading to increased infrastructural investments.
- Stringent safety regulations and quality control standards mandating the use of NDT equipment.
- Growing awareness of asset integrity management and the need for preventative maintenance.
- Technological advancements offering enhanced accuracy, speed, and efficiency.
Challenges & Restraints:
- High initial investment costs associated with advanced NDT equipment.
- Lack of skilled personnel for operating and maintaining advanced systems.
- Supply chain disruptions leading to material shortages and price fluctuations.
- Intense competition among numerous vendors, often leading to price wars.
Emerging Opportunities in APAC NDT Equipment Market
The APAC NDT equipment market presents substantial opportunities in several areas:
- Adoption of innovative technologies like AI-powered NDT solutions, which are currently still at the early stages of market penetration.
- Expansion into emerging markets like Indonesia and Vietnam.
- Development of specialized NDT solutions for niche applications (e.g., renewable energy).
Growth Accelerators in the APAC NDT Equipment Market Industry
Long-term growth will be fueled by technological breakthroughs in areas like phased array UT, digital radiography, and advanced data analytics integration. Strategic partnerships and collaborations between equipment manufacturers and NDT service providers will also expand market penetration and promote wider technology adoption. Expansion into new markets, particularly within emerging economies, alongside a focus on customized solutions will drive future expansion.
Key Players Shaping the APAC NDT Equipment Market Market
- Acuren Inspection Inc (Rockwood Service Corporation)
- Intertek Group Plc
- MISTRAS Group
- TEAM Inc
- TÜV Rhineland AG
- Zetec Inc
- SGS Group
- Bureau Veritas S A
- Nikon Metrology NV
- Fujifilm Corporation
- Olympus Corporation
- Magnaflux Corp
- NCS Testing Technology Co Limited
- GE Measurement and Control
- Applus Services S A
- YXLON International Gmbh ( COMET Group)
Notable Milestones in APAC NDT Equipment Market Sector
- April 2021: Nikon Corporation launched the Lasermeister 102A, expanding capabilities in additive manufacturing and impacting precision component inspection.
- April 2021: Nikon Corporation released a "Remote Control SDK" for its NEXIV series, enhancing automation in electronic component measurement and inspection.
- April 2021: Bureau Veritas joined the TCFD, highlighting growing focus on environmental sustainability and influencing NDT adoption in environmentally conscious industries.
- April 2021: Carnival Corporation partnered with Bureau Veritas for NDT services, showcasing increasing demand for NDT in the travel and leisure sector.
In-Depth APAC NDT Equipment Market Market Outlook
The APAC NDT equipment market holds immense potential for future growth, driven by sustained infrastructure development, expanding industrial sectors, and the continuous adoption of advanced technologies. Strategic opportunities exist in developing customized solutions for niche industries, expanding into underserved markets, and fostering collaborations to promote technology adoption. The increasing focus on asset integrity management across various industries ensures a consistent demand for reliable and efficient NDT equipment, creating a positive outlook for market expansion in the coming years.
APAC NDT Equipment Market Segmentation
-
1. Technology Type
- 1.1. Radiography Testing
- 1.2. Ultrasonic Testing
- 1.3. Magnetic Particle Testing*
- 1.4. Liquid Penetrant Testing
- 1.5. Visual Inspection
- 1.6. Eddy Current Testing*
- 1.7. Other Technologies
-
2. End-user
- 2.1. Oil & Gas
- 2.2. Power & Energy
- 2.3. Construction
- 2.4. Automotive & Transportation
- 2.5. Aerospace & Defense
- 2.6. Other End-users
APAC NDT Equipment Market Segmentation By Geography
-
1. North America
- 1.1. United States
- 1.2. Canada
- 1.3. Mexico
-
2. South America
- 2.1. Brazil
- 2.2. Argentina
- 2.3. Rest of South America
-
3. Europe
- 3.1. United Kingdom
- 3.2. Germany
- 3.3. France
- 3.4. Italy
- 3.5. Spain
- 3.6. Russia
- 3.7. Benelux
- 3.8. Nordics
- 3.9. Rest of Europe
-
4. Middle East & Africa
- 4.1. Turkey
- 4.2. Israel
- 4.3. GCC
- 4.4. North Africa
- 4.5. South Africa
- 4.6. Rest of Middle East & Africa
-
5. Asia Pacific
- 5.1. China
- 5.2. India
- 5.3. Japan
- 5.4. South Korea
- 5.5. ASEAN
- 5.6. Oceania
- 5.7. Rest of Asia Pacific
APAC NDT Equipment Market Regional Market Share
Geographic Coverage of APAC NDT Equipment Market
APAC NDT Equipment Market REPORT HIGHLIGHTS
| Aspects | Details |
|---|---|
| Study Period | 2020-2034 |
| Base Year | 2025 |
| Estimated Year | 2026 |
| Forecast Period | 2026-2034 |
| Historical Period | 2020-2025 |
| Growth Rate | CAGR of 7.23% from 2020-2034 |
| Segmentation |
|
Table of Contents
- 1. Introduction
- 1.1. Research Scope
- 1.2. Market Segmentation
- 1.3. Research Objective
- 1.4. Definitions and Assumptions
- 2. Executive Summary
- 2.1. Market Snapshot
- 3. Market Dynamics
- 3.1. Market Drivers
- 3.2. Market Restrains
- 3.3. Market Trends
- 3.4. Market Opportunities
- 4. Market Factor Analysis
- 4.1. Porters Five Forces
- 4.1.1. Bargaining Power of Suppliers
- 4.1.2. Bargaining Power of Buyers
- 4.1.3. Threat of New Entrants
- 4.1.4. Threat of Substitutes
- 4.1.5. Competitive Rivalry
- 4.2. PESTEL analysis
- 4.3. BCG Analysis
- 4.3.1. Stars (High Growth, High Market Share)
- 4.3.2. Cash Cows (Low Growth, High Market Share)
- 4.3.3. Question Mark (High Growth, Low Market Share)
- 4.3.4. Dogs (Low Growth, Low Market Share)
- 4.4. Ansoff Matrix Analysis
- 4.5. Supply Chain Analysis
- 4.6. Regulatory Landscape
- 4.7. Current Market Potential and Opportunity Assessment (TAM–SAM–SOM Framework)
- 4.8. NRP Analyst Note
- 4.1. Porters Five Forces
- 5. Market Analysis, Insights and Forecast 2021-2033
- 5.1. Market Analysis, Insights and Forecast - by Technology Type
- 5.1.1. Radiography Testing
- 5.1.2. Ultrasonic Testing
- 5.1.3. Magnetic Particle Testing*
- 5.1.4. Liquid Penetrant Testing
- 5.1.5. Visual Inspection
- 5.1.6. Eddy Current Testing*
- 5.1.7. Other Technologies
- 5.2. Market Analysis, Insights and Forecast - by End-user
- 5.2.1. Oil & Gas
- 5.2.2. Power & Energy
- 5.2.3. Construction
- 5.2.4. Automotive & Transportation
- 5.2.5. Aerospace & Defense
- 5.2.6. Other End-users
- 5.3. Market Analysis, Insights and Forecast - by Region
- 5.3.1. North America
- 5.3.2. South America
- 5.3.3. Europe
- 5.3.4. Middle East & Africa
- 5.3.5. Asia Pacific
- 5.1. Market Analysis, Insights and Forecast - by Technology Type
- 6. Global APAC NDT Equipment Market Analysis, Insights and Forecast, 2021-2033
- 6.1. Market Analysis, Insights and Forecast - by Technology Type
- 6.1.1. Radiography Testing
- 6.1.2. Ultrasonic Testing
- 6.1.3. Magnetic Particle Testing*
- 6.1.4. Liquid Penetrant Testing
- 6.1.5. Visual Inspection
- 6.1.6. Eddy Current Testing*
- 6.1.7. Other Technologies
- 6.2. Market Analysis, Insights and Forecast - by End-user
- 6.2.1. Oil & Gas
- 6.2.2. Power & Energy
- 6.2.3. Construction
- 6.2.4. Automotive & Transportation
- 6.2.5. Aerospace & Defense
- 6.2.6. Other End-users
- 6.1. Market Analysis, Insights and Forecast - by Technology Type
- 7. North America APAC NDT Equipment Market Analysis, Insights and Forecast, 2020-2032
- 7.1. Market Analysis, Insights and Forecast - by Technology Type
- 7.1.1. Radiography Testing
- 7.1.2. Ultrasonic Testing
- 7.1.3. Magnetic Particle Testing*
- 7.1.4. Liquid Penetrant Testing
- 7.1.5. Visual Inspection
- 7.1.6. Eddy Current Testing*
- 7.1.7. Other Technologies
- 7.2. Market Analysis, Insights and Forecast - by End-user
- 7.2.1. Oil & Gas
- 7.2.2. Power & Energy
- 7.2.3. Construction
- 7.2.4. Automotive & Transportation
- 7.2.5. Aerospace & Defense
- 7.2.6. Other End-users
- 7.1. Market Analysis, Insights and Forecast - by Technology Type
- 8. South America APAC NDT Equipment Market Analysis, Insights and Forecast, 2020-2032
- 8.1. Market Analysis, Insights and Forecast - by Technology Type
- 8.1.1. Radiography Testing
- 8.1.2. Ultrasonic Testing
- 8.1.3. Magnetic Particle Testing*
- 8.1.4. Liquid Penetrant Testing
- 8.1.5. Visual Inspection
- 8.1.6. Eddy Current Testing*
- 8.1.7. Other Technologies
- 8.2. Market Analysis, Insights and Forecast - by End-user
- 8.2.1. Oil & Gas
- 8.2.2. Power & Energy
- 8.2.3. Construction
- 8.2.4. Automotive & Transportation
- 8.2.5. Aerospace & Defense
- 8.2.6. Other End-users
- 8.1. Market Analysis, Insights and Forecast - by Technology Type
- 9. Europe APAC NDT Equipment Market Analysis, Insights and Forecast, 2020-2032
- 9.1. Market Analysis, Insights and Forecast - by Technology Type
- 9.1.1. Radiography Testing
- 9.1.2. Ultrasonic Testing
- 9.1.3. Magnetic Particle Testing*
- 9.1.4. Liquid Penetrant Testing
- 9.1.5. Visual Inspection
- 9.1.6. Eddy Current Testing*
- 9.1.7. Other Technologies
- 9.2. Market Analysis, Insights and Forecast - by End-user
- 9.2.1. Oil & Gas
- 9.2.2. Power & Energy
- 9.2.3. Construction
- 9.2.4. Automotive & Transportation
- 9.2.5. Aerospace & Defense
- 9.2.6. Other End-users
- 9.1. Market Analysis, Insights and Forecast - by Technology Type
- 10. Middle East & Africa APAC NDT Equipment Market Analysis, Insights and Forecast, 2020-2032
- 10.1. Market Analysis, Insights and Forecast - by Technology Type
- 10.1.1. Radiography Testing
- 10.1.2. Ultrasonic Testing
- 10.1.3. Magnetic Particle Testing*
- 10.1.4. Liquid Penetrant Testing
- 10.1.5. Visual Inspection
- 10.1.6. Eddy Current Testing*
- 10.1.7. Other Technologies
- 10.2. Market Analysis, Insights and Forecast - by End-user
- 10.2.1. Oil & Gas
- 10.2.2. Power & Energy
- 10.2.3. Construction
- 10.2.4. Automotive & Transportation
- 10.2.5. Aerospace & Defense
- 10.2.6. Other End-users
- 10.1. Market Analysis, Insights and Forecast - by Technology Type
- 11. Asia Pacific APAC NDT Equipment Market Analysis, Insights and Forecast, 2020-2032
- 11.1. Market Analysis, Insights and Forecast - by Technology Type
- 11.1.1. Radiography Testing
- 11.1.2. Ultrasonic Testing
- 11.1.3. Magnetic Particle Testing*
- 11.1.4. Liquid Penetrant Testing
- 11.1.5. Visual Inspection
- 11.1.6. Eddy Current Testing*
- 11.1.7. Other Technologies
- 11.2. Market Analysis, Insights and Forecast - by End-user
- 11.2.1. Oil & Gas
- 11.2.2. Power & Energy
- 11.2.3. Construction
- 11.2.4. Automotive & Transportation
- 11.2.5. Aerospace & Defense
- 11.2.6. Other End-users
- 11.1. Market Analysis, Insights and Forecast - by Technology Type
- 12. Competitive Analysis
- 12.1. Company Profiles
- 12.1.1 Acuren Inspection Inc (Rockwood Service Corporation)
- 12.1.1.1. Company Overview
- 12.1.1.2. Products
- 12.1.1.3. Company Financials
- 12.1.1.4. SWOT Analysis
- 12.1.2 Intertek Group Plc
- 12.1.2.1. Company Overview
- 12.1.2.2. Products
- 12.1.2.3. Company Financials
- 12.1.2.4. SWOT Analysis
- 12.1.3 MISTRAS Group
- 12.1.3.1. Company Overview
- 12.1.3.2. Products
- 12.1.3.3. Company Financials
- 12.1.3.4. SWOT Analysis
- 12.1.4 TEAM Inc
- 12.1.4.1. Company Overview
- 12.1.4.2. Products
- 12.1.4.3. Company Financials
- 12.1.4.4. SWOT Analysis
- 12.1.5 TÜV Rhineland AG
- 12.1.5.1. Company Overview
- 12.1.5.2. Products
- 12.1.5.3. Company Financials
- 12.1.5.4. SWOT Analysis
- 12.1.6 Zetec Inc *List Not Exhaustive
- 12.1.6.1. Company Overview
- 12.1.6.2. Products
- 12.1.6.3. Company Financials
- 12.1.6.4. SWOT Analysis
- 12.1.7 SGS Group
- 12.1.7.1. Company Overview
- 12.1.7.2. Products
- 12.1.7.3. Company Financials
- 12.1.7.4. SWOT Analysis
- 12.1.8 Bureau Veritas S A
- 12.1.8.1. Company Overview
- 12.1.8.2. Products
- 12.1.8.3. Company Financials
- 12.1.8.4. SWOT Analysis
- 12.1.9 Nikon Metrology NV
- 12.1.9.1. Company Overview
- 12.1.9.2. Products
- 12.1.9.3. Company Financials
- 12.1.9.4. SWOT Analysis
- 12.1.10 Fujifilm Corporation
- 12.1.10.1. Company Overview
- 12.1.10.2. Products
- 12.1.10.3. Company Financials
- 12.1.10.4. SWOT Analysis
- 12.1.11 Olympus Corporation
- 12.1.11.1. Company Overview
- 12.1.11.2. Products
- 12.1.11.3. Company Financials
- 12.1.11.4. SWOT Analysis
- 12.1.12 Magnaflux Corp
- 12.1.12.1. Company Overview
- 12.1.12.2. Products
- 12.1.12.3. Company Financials
- 12.1.12.4. SWOT Analysis
- 12.1.13 NCS Testing Technology Co Limited
- 12.1.13.1. Company Overview
- 12.1.13.2. Products
- 12.1.13.3. Company Financials
- 12.1.13.4. SWOT Analysis
- 12.1.14 GE Measurement and Control
- 12.1.14.1. Company Overview
- 12.1.14.2. Products
- 12.1.14.3. Company Financials
- 12.1.14.4. SWOT Analysis
- 12.1.15 Applus Services S A
- 12.1.15.1. Company Overview
- 12.1.15.2. Products
- 12.1.15.3. Company Financials
- 12.1.15.4. SWOT Analysis
- 12.1.16 YXLON International Gmbh ( COMET Group)
- 12.1.16.1. Company Overview
- 12.1.16.2. Products
- 12.1.16.3. Company Financials
- 12.1.16.4. SWOT Analysis
- 12.1.1 Acuren Inspection Inc (Rockwood Service Corporation)
- 12.2. Market Entropy
- 12.2.1 Company's Key Areas Served
- 12.2.2 Recent Developments
- 12.3. Company Market Share Analysis 2025
- 12.3.1 Top 5 Companies Market Share Analysis
- 12.3.2 Top 3 Companies Market Share Analysis
- 12.4. List of Potential Customers
- 13. Research Methodology
List of Figures
- Figure 1: Global APAC NDT Equipment Market Revenue Breakdown (billion, %) by Region 2025 & 2033
- Figure 2: North America APAC NDT Equipment Market Revenue (billion), by Technology Type 2025 & 2033
- Figure 3: North America APAC NDT Equipment Market Revenue Share (%), by Technology Type 2025 & 2033
- Figure 4: North America APAC NDT Equipment Market Revenue (billion), by End-user 2025 & 2033
- Figure 5: North America APAC NDT Equipment Market Revenue Share (%), by End-user 2025 & 2033
- Figure 6: North America APAC NDT Equipment Market Revenue (billion), by Country 2025 & 2033
- Figure 7: North America APAC NDT Equipment Market Revenue Share (%), by Country 2025 & 2033
- Figure 8: South America APAC NDT Equipment Market Revenue (billion), by Technology Type 2025 & 2033
- Figure 9: South America APAC NDT Equipment Market Revenue Share (%), by Technology Type 2025 & 2033
- Figure 10: South America APAC NDT Equipment Market Revenue (billion), by End-user 2025 & 2033
- Figure 11: South America APAC NDT Equipment Market Revenue Share (%), by End-user 2025 & 2033
- Figure 12: South America APAC NDT Equipment Market Revenue (billion), by Country 2025 & 2033
- Figure 13: South America APAC NDT Equipment Market Revenue Share (%), by Country 2025 & 2033
- Figure 14: Europe APAC NDT Equipment Market Revenue (billion), by Technology Type 2025 & 2033
- Figure 15: Europe APAC NDT Equipment Market Revenue Share (%), by Technology Type 2025 & 2033
- Figure 16: Europe APAC NDT Equipment Market Revenue (billion), by End-user 2025 & 2033
- Figure 17: Europe APAC NDT Equipment Market Revenue Share (%), by End-user 2025 & 2033
- Figure 18: Europe APAC NDT Equipment Market Revenue (billion), by Country 2025 & 2033
- Figure 19: Europe APAC NDT Equipment Market Revenue Share (%), by Country 2025 & 2033
- Figure 20: Middle East & Africa APAC NDT Equipment Market Revenue (billion), by Technology Type 2025 & 2033
- Figure 21: Middle East & Africa APAC NDT Equipment Market Revenue Share (%), by Technology Type 2025 & 2033
- Figure 22: Middle East & Africa APAC NDT Equipment Market Revenue (billion), by End-user 2025 & 2033
- Figure 23: Middle East & Africa APAC NDT Equipment Market Revenue Share (%), by End-user 2025 & 2033
- Figure 24: Middle East & Africa APAC NDT Equipment Market Revenue (billion), by Country 2025 & 2033
- Figure 25: Middle East & Africa APAC NDT Equipment Market Revenue Share (%), by Country 2025 & 2033
- Figure 26: Asia Pacific APAC NDT Equipment Market Revenue (billion), by Technology Type 2025 & 2033
- Figure 27: Asia Pacific APAC NDT Equipment Market Revenue Share (%), by Technology Type 2025 & 2033
- Figure 28: Asia Pacific APAC NDT Equipment Market Revenue (billion), by End-user 2025 & 2033
- Figure 29: Asia Pacific APAC NDT Equipment Market Revenue Share (%), by End-user 2025 & 2033
- Figure 30: Asia Pacific APAC NDT Equipment Market Revenue (billion), by Country 2025 & 2033
- Figure 31: Asia Pacific APAC NDT Equipment Market Revenue Share (%), by Country 2025 & 2033
List of Tables
- Table 1: Global APAC NDT Equipment Market Revenue billion Forecast, by Technology Type 2020 & 2033
- Table 2: Global APAC NDT Equipment Market Revenue billion Forecast, by End-user 2020 & 2033
- Table 3: Global APAC NDT Equipment Market Revenue billion Forecast, by Region 2020 & 2033
- Table 4: Global APAC NDT Equipment Market Revenue billion Forecast, by Technology Type 2020 & 2033
- Table 5: Global APAC NDT Equipment Market Revenue billion Forecast, by End-user 2020 & 2033
- Table 6: Global APAC NDT Equipment Market Revenue billion Forecast, by Country 2020 & 2033
- Table 7: United States APAC NDT Equipment Market Revenue (billion) Forecast, by Application 2020 & 2033
- Table 8: Canada APAC NDT Equipment Market Revenue (billion) Forecast, by Application 2020 & 2033
- Table 9: Mexico APAC NDT Equipment Market Revenue (billion) Forecast, by Application 2020 & 2033
- Table 10: Global APAC NDT Equipment Market Revenue billion Forecast, by Technology Type 2020 & 2033
- Table 11: Global APAC NDT Equipment Market Revenue billion Forecast, by End-user 2020 & 2033
- Table 12: Global APAC NDT Equipment Market Revenue billion Forecast, by Country 2020 & 2033
- Table 13: Brazil APAC NDT Equipment Market Revenue (billion) Forecast, by Application 2020 & 2033
- Table 14: Argentina APAC NDT Equipment Market Revenue (billion) Forecast, by Application 2020 & 2033
- Table 15: Rest of South America APAC NDT Equipment Market Revenue (billion) Forecast, by Application 2020 & 2033
- Table 16: Global APAC NDT Equipment Market Revenue billion Forecast, by Technology Type 2020 & 2033
- Table 17: Global APAC NDT Equipment Market Revenue billion Forecast, by End-user 2020 & 2033
- Table 18: Global APAC NDT Equipment Market Revenue billion Forecast, by Country 2020 & 2033
- Table 19: United Kingdom APAC NDT Equipment Market Revenue (billion) Forecast, by Application 2020 & 2033
- Table 20: Germany APAC NDT Equipment Market Revenue (billion) Forecast, by Application 2020 & 2033
- Table 21: France APAC NDT Equipment Market Revenue (billion) Forecast, by Application 2020 & 2033
- Table 22: Italy APAC NDT Equipment Market Revenue (billion) Forecast, by Application 2020 & 2033
- Table 23: Spain APAC NDT Equipment Market Revenue (billion) Forecast, by Application 2020 & 2033
- Table 24: Russia APAC NDT Equipment Market Revenue (billion) Forecast, by Application 2020 & 2033
- Table 25: Benelux APAC NDT Equipment Market Revenue (billion) Forecast, by Application 2020 & 2033
- Table 26: Nordics APAC NDT Equipment Market Revenue (billion) Forecast, by Application 2020 & 2033
- Table 27: Rest of Europe APAC NDT Equipment Market Revenue (billion) Forecast, by Application 2020 & 2033
- Table 28: Global APAC NDT Equipment Market Revenue billion Forecast, by Technology Type 2020 & 2033
- Table 29: Global APAC NDT Equipment Market Revenue billion Forecast, by End-user 2020 & 2033
- Table 30: Global APAC NDT Equipment Market Revenue billion Forecast, by Country 2020 & 2033
- Table 31: Turkey APAC NDT Equipment Market Revenue (billion) Forecast, by Application 2020 & 2033
- Table 32: Israel APAC NDT Equipment Market Revenue (billion) Forecast, by Application 2020 & 2033
- Table 33: GCC APAC NDT Equipment Market Revenue (billion) Forecast, by Application 2020 & 2033
- Table 34: North Africa APAC NDT Equipment Market Revenue (billion) Forecast, by Application 2020 & 2033
- Table 35: South Africa APAC NDT Equipment Market Revenue (billion) Forecast, by Application 2020 & 2033
- Table 36: Rest of Middle East & Africa APAC NDT Equipment Market Revenue (billion) Forecast, by Application 2020 & 2033
- Table 37: Global APAC NDT Equipment Market Revenue billion Forecast, by Technology Type 2020 & 2033
- Table 38: Global APAC NDT Equipment Market Revenue billion Forecast, by End-user 2020 & 2033
- Table 39: Global APAC NDT Equipment Market Revenue billion Forecast, by Country 2020 & 2033
- Table 40: China APAC NDT Equipment Market Revenue (billion) Forecast, by Application 2020 & 2033
- Table 41: India APAC NDT Equipment Market Revenue (billion) Forecast, by Application 2020 & 2033
- Table 42: Japan APAC NDT Equipment Market Revenue (billion) Forecast, by Application 2020 & 2033
- Table 43: South Korea APAC NDT Equipment Market Revenue (billion) Forecast, by Application 2020 & 2033
- Table 44: ASEAN APAC NDT Equipment Market Revenue (billion) Forecast, by Application 2020 & 2033
- Table 45: Oceania APAC NDT Equipment Market Revenue (billion) Forecast, by Application 2020 & 2033
- Table 46: Rest of Asia Pacific APAC NDT Equipment Market Revenue (billion) Forecast, by Application 2020 & 2033
Frequently Asked Questions
1. What is the projected Compound Annual Growth Rate (CAGR) of the APAC NDT Equipment Market?
The projected CAGR is approximately 7.23%.
2. Which companies are prominent players in the APAC NDT Equipment Market?
Key companies in the market include Acuren Inspection Inc (Rockwood Service Corporation), Intertek Group Plc, MISTRAS Group, TEAM Inc, TÜV Rhineland AG, Zetec Inc *List Not Exhaustive, SGS Group, Bureau Veritas S A, Nikon Metrology NV, Fujifilm Corporation, Olympus Corporation, Magnaflux Corp, NCS Testing Technology Co Limited, GE Measurement and Control, Applus Services S A, YXLON International Gmbh ( COMET Group).
3. What are the main segments of the APAC NDT Equipment Market?
The market segments include Technology Type, End-user.
4. Can you provide details about the market size?
The market size is estimated to be USD 5 billion as of 2022.
5. What are some drivers contributing to market growth?
Stringent safety regulations and growth in inspection services industry expected to drive adoption; Growing demand from the construction industry.
6. What are the notable trends driving market growth?
Stringent Regulations Mandating Safety.
7. Are there any restraints impacting market growth?
High replacement rate remains a key concern followed by reluctance to adopt new technologies in emerging regions.
8. Can you provide examples of recent developments in the market?
APRIL 2021- Nikon Corporation launched the Lasermeister 102A, a new optical processing system capable of titanium alloy additive manufacturing. The Lasermeister series uses a high-precision laser to perform a variety of metal processing tasks, including additive manufacturing like a 3D printer and laser marking and welding.
9. What pricing options are available for accessing the report?
Pricing options include single-user, multi-user, and enterprise licenses priced at USD 4750, USD 4950, and USD 6800 respectively.
10. Is the market size provided in terms of value or volume?
The market size is provided in terms of value, measured in billion.
11. Are there any specific market keywords associated with the report?
Yes, the market keyword associated with the report is "APAC NDT Equipment Market," which aids in identifying and referencing the specific market segment covered.
12. How do I determine which pricing option suits my needs best?
The pricing options vary based on user requirements and access needs. Individual users may opt for single-user licenses, while businesses requiring broader access may choose multi-user or enterprise licenses for cost-effective access to the report.
13. Are there any additional resources or data provided in the APAC NDT Equipment Market report?
While the report offers comprehensive insights, it's advisable to review the specific contents or supplementary materials provided to ascertain if additional resources or data are available.
14. How can I stay updated on further developments or reports in the APAC NDT Equipment Market?
To stay informed about further developments, trends, and reports in the APAC NDT Equipment Market, consider subscribing to industry newsletters, following relevant companies and organizations, or regularly checking reputable industry news sources and publications.
Methodology
Step 1 - Identification of Relevant Samples Size from Population Database


Step 2 - Approaches for Defining Global Market Size (Value, Volume* & Price*)

Note*: In applicable scenarios
Step 3 - Data Sources
Primary Research
- Web Analytics
- Survey Reports
- Research Institute
- Latest Research Reports
- Opinion Leaders
Secondary Research
- Annual Reports
- White Paper
- Latest Press Release
- Industry Association
- Paid Database
- Investor Presentations

Step 4 - Data Triangulation
Involves using different sources of information in order to increase the validity of a study
These sources are likely to be stakeholders in a program - participants, other researchers, program staff, other community members, and so on.
Then we put all data in single framework & apply various statistical tools to find out the dynamic on the market.
During the analysis stage, feedback from the stakeholder groups would be compared to determine areas of agreement as well as areas of divergence