

Key Insights
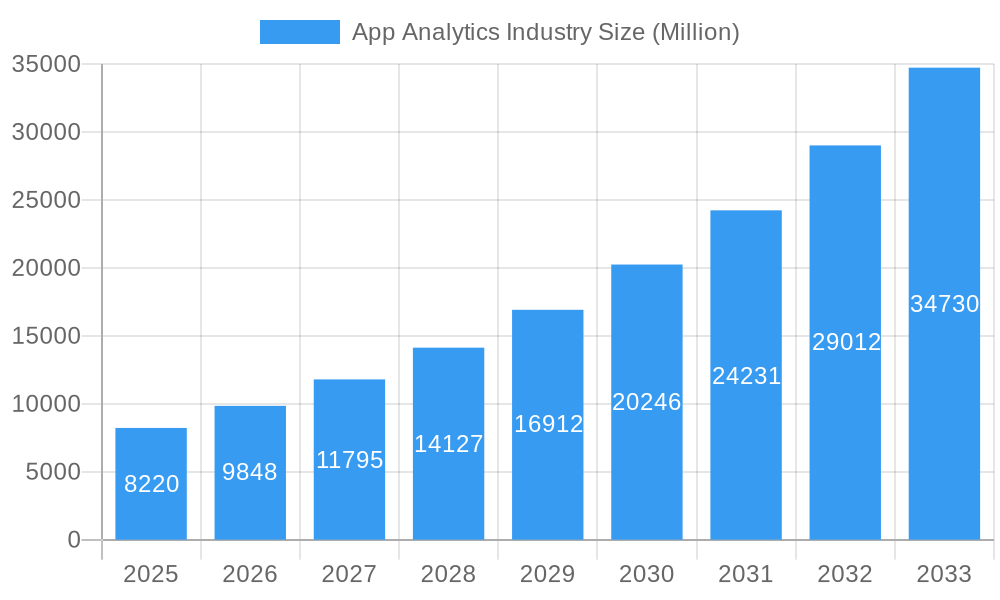
The global App Analytics market is poised for significant expansion, projected to reach $8.22 billion in 2025. This growth is propelled by a robust CAGR of 19.6% throughout the forecast period of 2025-2033. The increasing proliferation of mobile applications across diverse industries, coupled with a heightened demand for data-driven decision-making, are primary catalysts. Businesses are increasingly reliant on app analytics to understand user behavior, optimize in-app experiences, personalize marketing campaigns, and ultimately drive revenue. Key applications such as Marketing/Advertising Analytics, Revenue Analytics, and In-app Performance Analytics are central to this surge, enabling organizations to gain actionable insights and refine their digital strategies. The widespread adoption of mobile apps in sectors like BFSI, E-commerce, Media, Travel and Tourism, and IT and Telecom underscores the pervasive need for advanced analytical tools.
App Analytics Industry Market Size (In Billion)
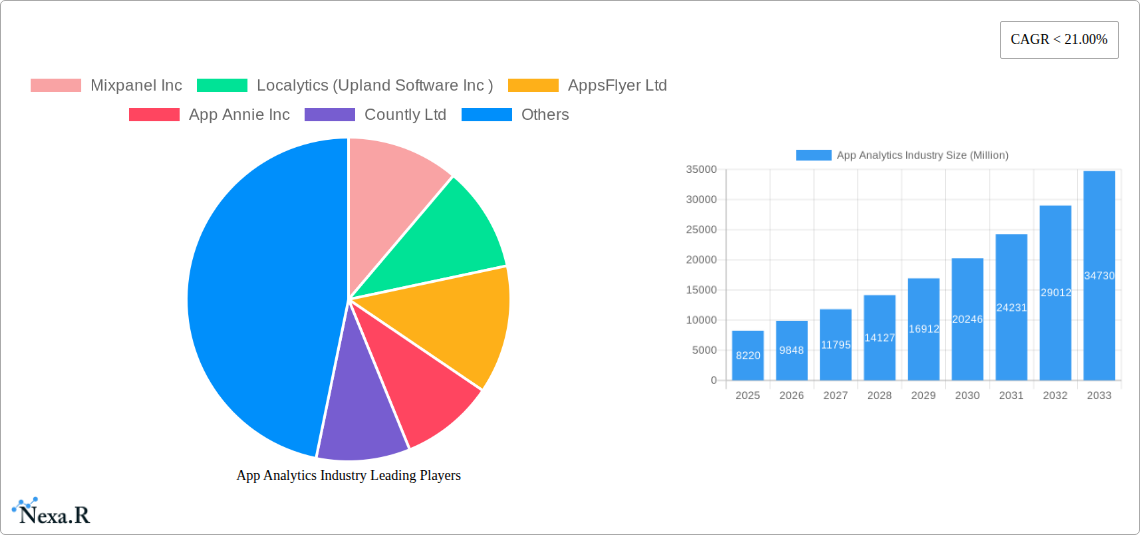
The competitive landscape is characterized by innovation and strategic collaborations among key players, including Mixpanel Inc., Localytics (Upland Software Inc.), AppsFlyer Ltd., App Annie Inc., and Google LLC. These companies are continuously developing sophisticated platforms to address the evolving needs of app developers and marketers. While the market is flourishing, potential restraints could emerge from data privacy regulations and the increasing complexity of data integration. However, the overarching trend of digital transformation and the imperative for businesses to maintain a competitive edge in the app ecosystem are expected to outweigh these challenges, ensuring sustained market momentum. The North America and Europe regions are anticipated to lead in market share, driven by early adoption and advanced technological infrastructure, with Asia Pacific demonstrating rapid growth potential due to its expanding smartphone user base and burgeoning digital economy.
App Analytics Industry Company Market Share
Gain a definitive edge in the rapidly evolving app ecosystem with this in-depth App Analytics Industry report. Delve into critical market dynamics, growth trajectories, and strategic insights covering the global app analytics market size from 2019-2033, with a base year of 2025 and a forecast period extending to 2033. This comprehensive analysis is essential for understanding the forces shaping mobile app analytics, website analytics, and application performance monitoring.
This report provides an unparalleled deep dive into the app monetization analytics, marketing analytics, and user behavior analytics landscape, vital for stakeholders in BFSI, e-commerce, media, travel and tourism, IT and telecom, and other key industries. Discover how leading players like Mixpanel Inc, Localytics (Upland Software Inc), AppsFlyer Ltd, App Annie Inc, Countly Ltd, Google LLC, Adobe Inc, Amazon Web Services Inc, AppDynamics LLC, Flurry Inc, and Kochava Inc are navigating this dynamic sector.
App Analytics Industry Market Dynamics & Structure
The app analytics industry is characterized by a moderately concentrated market structure, driven by significant technological innovation and the increasing demand for data-driven decision-making across all digital touchpoints. Key drivers of innovation include advancements in AI and machine learning, enabling more sophisticated predictive analytics and personalization. Regulatory frameworks, particularly data privacy laws like GDPR and CCPA, are increasingly influencing how app data is collected, analyzed, and utilized, posing both challenges and opportunities for market players. The competitive landscape is shaped by a mix of specialized analytics providers and broad technology giants offering integrated solutions. End-user demographics are increasingly diverse, with a growing reliance on apps across all age groups and professional sectors, amplifying the need for robust analytics. Mergers and acquisitions (M&A) activity remains a significant trend, as larger players seek to consolidate market share and expand their service offerings, while smaller, innovative companies are acquired for their niche technologies.
- Market Concentration: Moderately concentrated, with a few dominant players and a vibrant ecosystem of specialized providers.
- Technological Innovation Drivers: AI/ML for predictive analytics, real-time data processing, personalization engines.
- Regulatory Frameworks: Growing emphasis on data privacy (GDPR, CCPA) impacting data collection and usage.
- Competitive Product Substitutes: Integrated platform solutions vs. standalone specialized tools.
- End-User Demographics: Expanding across all age groups and industries, demanding tailored analytics.
- M&A Trends: Ongoing consolidation for market share and technological acquisition.
App Analytics Industry Growth Trends & Insights
The global app analytics market is poised for robust expansion, driven by the indispensable role of data in optimizing app performance, enhancing user engagement, and maximizing revenue. Over the study period of 2019–2033, the market will witness a significant evolution from its historical roots to a future dominated by hyper-personalization and predictive insights. The base year of 2025 stands as a pivotal point, reflecting current adoption rates and technological maturity, with an estimated market size projected to be around $XX billion. The forecast period (2025–2033) is expected to witness a Compound Annual Growth Rate (CAGR) of approximately X%, fueling the market to reach an estimated $XX billion by 2033. This growth is underpinned by a surge in mobile-first strategies and the increasing complexity of digital consumer journeys, compelling businesses to leverage advanced analytics for actionable intelligence.
Adoption rates for app analytics solutions have accelerated across all segments, from small businesses to large enterprises, as the understanding of their ROI becomes clearer. Technological disruptions are continuously redefining the market, with the integration of AI and machine learning enabling more sophisticated in-app analytics, fraud detection, and customer segmentation. Cloud-based analytics platforms are becoming the norm, offering scalability and accessibility for businesses of all sizes. Consumer behavior shifts, such as the growing demand for seamless and personalized experiences, directly translate into a higher need for granular data analysis to understand user journeys, churn prediction, and conversion optimization. The proliferation of IoT devices and wearables also presents a nascent but rapidly expanding avenue for app analytics, capturing new data streams and user interactions. The shift from basic performance tracking to advanced behavioral analytics is a key trend, enabling businesses to move beyond what happened to understanding why it happened and what is likely to happen next. The increasing volume and variety of data generated by apps necessitate sophisticated tools to derive meaningful insights, thus propelling the adoption of comprehensive app analytics platforms.
Dominant Regions, Countries, or Segments in App Analytics Industry
The mobile apps segment, encompassing both iOS and Android platforms, stands as the undisputed dominant force in the app analytics industry, driving a substantial portion of the market's growth and innovation. This dominance is further amplified by the widespread adoption of marketing/advertising analytics, which allows businesses to precisely measure campaign effectiveness, optimize ad spend, and acquire users more efficiently. The e-commerce industry, a primary consumer of these services, relies heavily on app analytics to understand customer purchasing behavior, personalize product recommendations, and streamline the checkout process, contributing significantly to the global app analytics market value.
North America, particularly the United States, continues to lead in market share due to its early adoption of digital technologies, a robust startup ecosystem, and a high concentration of major technology companies and e-commerce giants. Economic policies that foster innovation and investment in R&D further bolster its position. The IT and Telecom sector also plays a crucial role, leveraging app analytics for network performance monitoring, customer service optimization, and the development of new digital services. The Asia-Pacific region, with its rapidly growing internet penetration and a massive mobile-first population, represents the fastest-growing market for app analytics, driven by emerging economies and a burgeoning digital economy. Countries like China and India are key contributors to this regional growth.
The increasing sophistication of revenue analytics is a significant growth driver across all segments, enabling businesses to understand monetization strategies, identify high-value user segments, and optimize in-app purchases and subscription models. While Website/Desktop Apps analytics continues to be relevant, the sheer volume and engagement metrics associated with mobile apps position them as the primary focus for app analytics providers. The Travel and Tourism sector is increasingly leveraging app analytics to personalize travel planning, booking experiences, and in-trip services, further expanding the application of these tools. The BFSI sector is also adopting app analytics for enhanced customer experience, fraud detection, and personalized financial advice, underscoring the cross-industry applicability and growth potential of app analytics.
App Analytics Industry Product Landscape
The product landscape of the app analytics industry is characterized by an increasing convergence of features, offering comprehensive solutions that go beyond basic data collection. Innovations are centered on real-time data processing, predictive analytics powered by AI/ML, and advanced segmentation tools that enable hyper-personalization. Unique selling propositions often lie in the depth of insights provided, the ease of integration with existing tech stacks, and the ability to offer actionable recommendations rather than just raw data. Technological advancements are focused on improving data visualization, enabling cross-platform tracking, and ensuring robust data security and privacy compliance.
Key Drivers, Barriers & Challenges in App Analytics Industry
The app analytics industry is propelled by several key drivers, including the escalating need for data-driven decision-making, the continuous rise of the mobile-first economy, and the demand for enhanced customer personalization. Technological advancements in AI and machine learning are enabling more sophisticated predictive capabilities, further accelerating adoption. Economic growth and increased digital transformation initiatives across industries also contribute significantly to market expansion.
However, the industry faces several barriers and challenges. Data privacy regulations, while driving innovation in compliant solutions, can also introduce complexity and restrict data collection. The high cost of advanced analytics tools can be a barrier for smaller businesses. Furthermore, the shortage of skilled data scientists and analysts poses a challenge in effectively leveraging the insights generated by these platforms. Intense competition and market saturation also present challenges for new entrants.
Emerging Opportunities in App Analytics Industry
Emerging opportunities in the app analytics industry are manifold, focusing on untapped markets and evolving consumer preferences. The rapid growth of the Internet of Things (IoT) presents a significant avenue, with the potential to integrate data from connected devices for richer user insights. The burgeoning gaming industry, with its complex in-game economies and user engagement metrics, offers fertile ground for specialized analytics solutions. Furthermore, the increasing demand for ethical and transparent data usage is creating opportunities for privacy-preserving analytics tools. The application of AI for hyper-personalization across various touchpoints, including augmented reality (AR) and virtual reality (VR) experiences, is another promising frontier.
Growth Accelerators in the App Analytics Industry Industry
Several growth accelerators are poised to significantly boost the app analytics industry. Technological breakthroughs in areas like real-time data processing and explainable AI will empower businesses with deeper and more trustworthy insights. Strategic partnerships between analytics providers and cloud infrastructure companies will enhance scalability and accessibility. Market expansion into emerging economies with high mobile penetration rates will unlock new customer bases. The increasing focus on customer lifetime value (CLV) optimization and churn prediction will drive demand for sophisticated analytical tools that can accurately forecast user behavior. Furthermore, the development of no-code/low-code analytics platforms will democratize data analysis, making it accessible to a wider range of users within organizations.
Key Players Shaping the App Analytics Industry Market
- Mixpanel Inc
- Localytics (Upland Software Inc)
- AppsFlyer Ltd
- App Annie Inc
- Countly Ltd
- Google LLC
- Adobe Inc
- Amazon Web Services Inc
- AppDynamics LLC
- Flurry Inc
- Kochava Inc
Notable Milestones in App Analytics Industry Sector
- 2019: Increased adoption of AI-powered predictive analytics features by leading platforms.
- 2020: Heightened focus on mobile app performance and user engagement amidst global shifts.
- 2021: Significant M&A activity as larger tech companies sought to bolster their analytics capabilities.
- 2022: Growing emphasis on data privacy compliance and the development of privacy-centric analytics solutions.
- 2023: Introduction of advanced attribution models and cross-channel analytics capabilities.
- 2024: Further integration of analytics with marketing automation and CRM platforms for a holistic view.
In-Depth App Analytics Industry Market Outlook
The app analytics industry is set for sustained and robust growth, driven by its critical role in enabling businesses to navigate the increasingly complex digital landscape. The confluence of technological advancements, evolving consumer expectations for personalized experiences, and the ongoing digital transformation across industries will continue to fuel demand for sophisticated app analytics solutions. The market's outlook is exceptionally positive, with emerging opportunities in areas like IoT data integration, gaming analytics, and privacy-enhancing technologies. Strategic partnerships and the expansion into new geographical markets will act as significant catalysts, ensuring the industry remains dynamic and innovative, ultimately empowering businesses to make smarter, data-informed decisions and achieve superior outcomes.
App Analytics Industry Segmentation
-
1. Type
- 1.1. Mobile Apps
- 1.2. Website/Desktop Apps
-
2. Application
- 2.1. Marketing/Advertising Analytics
- 2.2. Revenue Analytics
- 2.3. In-app Performance Analytics
-
3. End-user Industry
- 3.1. BFSI
- 3.2. E-commerce
- 3.3. Media an
- 3.4. Travel and Tourism
- 3.5. IT and Telecom
- 3.6. Other En
App Analytics Industry Segmentation By Geography
- 1. North America
- 2. Europe
- 3. Asia
- 4. Australia and New Zealand
- 5. Latin America
- 6. Middle East and Africa
App Analytics Industry Regional Market Share
Geographic Coverage of App Analytics Industry
App Analytics Industry REPORT HIGHLIGHTS
| Aspects | Details |
|---|---|
| Study Period | 2020-2034 |
| Base Year | 2025 |
| Estimated Year | 2026 |
| Forecast Period | 2026-2034 |
| Historical Period | 2020-2025 |
| Growth Rate | CAGR of 19.6% from 2020-2034 |
| Segmentation |
|
Table of Contents
- 1. Introduction
- 1.1. Research Scope
- 1.2. Market Segmentation
- 1.3. Research Objective
- 1.4. Definitions and Assumptions
- 2. Executive Summary
- 2.1. Market Snapshot
- 3. Market Dynamics
- 3.1. Market Drivers
- 3.2. Market Restrains
- 3.3. Market Trends
- 3.4. Market Opportunities
- 4. Market Factor Analysis
- 4.1. Porters Five Forces
- 4.1.1. Bargaining Power of Suppliers
- 4.1.2. Bargaining Power of Buyers
- 4.1.3. Threat of New Entrants
- 4.1.4. Threat of Substitutes
- 4.1.5. Competitive Rivalry
- 4.2. PESTEL analysis
- 4.3. BCG Analysis
- 4.3.1. Stars (High Growth, High Market Share)
- 4.3.2. Cash Cows (Low Growth, High Market Share)
- 4.3.3. Question Mark (High Growth, Low Market Share)
- 4.3.4. Dogs (Low Growth, Low Market Share)
- 4.4. Ansoff Matrix Analysis
- 4.5. Supply Chain Analysis
- 4.6. Regulatory Landscape
- 4.7. Current Market Potential and Opportunity Assessment (TAM–SAM–SOM Framework)
- 4.8. NRP Analyst Note
- 4.1. Porters Five Forces
- 5. Market Analysis, Insights and Forecast 2021-2033
- 5.1. Market Analysis, Insights and Forecast - by Type
- 5.1.1. Mobile Apps
- 5.1.2. Website/Desktop Apps
- 5.2. Market Analysis, Insights and Forecast - by Application
- 5.2.1. Marketing/Advertising Analytics
- 5.2.2. Revenue Analytics
- 5.2.3. In-app Performance Analytics
- 5.3. Market Analysis, Insights and Forecast - by End-user Industry
- 5.3.1. BFSI
- 5.3.2. E-commerce
- 5.3.3. Media an
- 5.3.4. Travel and Tourism
- 5.3.5. IT and Telecom
- 5.3.6. Other En
- 5.4. Market Analysis, Insights and Forecast - by Region
- 5.4.1. North America
- 5.4.2. Europe
- 5.4.3. Asia
- 5.4.4. Australia and New Zealand
- 5.4.5. Latin America
- 5.4.6. Middle East and Africa
- 5.1. Market Analysis, Insights and Forecast - by Type
- 6. Global App Analytics Industry Analysis, Insights and Forecast, 2021-2033
- 6.1. Market Analysis, Insights and Forecast - by Type
- 6.1.1. Mobile Apps
- 6.1.2. Website/Desktop Apps
- 6.2. Market Analysis, Insights and Forecast - by Application
- 6.2.1. Marketing/Advertising Analytics
- 6.2.2. Revenue Analytics
- 6.2.3. In-app Performance Analytics
- 6.3. Market Analysis, Insights and Forecast - by End-user Industry
- 6.3.1. BFSI
- 6.3.2. E-commerce
- 6.3.3. Media an
- 6.3.4. Travel and Tourism
- 6.3.5. IT and Telecom
- 6.3.6. Other En
- 6.1. Market Analysis, Insights and Forecast - by Type
- 7. North America App Analytics Industry Analysis, Insights and Forecast, 2020-2032
- 7.1. Market Analysis, Insights and Forecast - by Type
- 7.1.1. Mobile Apps
- 7.1.2. Website/Desktop Apps
- 7.2. Market Analysis, Insights and Forecast - by Application
- 7.2.1. Marketing/Advertising Analytics
- 7.2.2. Revenue Analytics
- 7.2.3. In-app Performance Analytics
- 7.3. Market Analysis, Insights and Forecast - by End-user Industry
- 7.3.1. BFSI
- 7.3.2. E-commerce
- 7.3.3. Media an
- 7.3.4. Travel and Tourism
- 7.3.5. IT and Telecom
- 7.3.6. Other En
- 7.1. Market Analysis, Insights and Forecast - by Type
- 8. Europe App Analytics Industry Analysis, Insights and Forecast, 2020-2032
- 8.1. Market Analysis, Insights and Forecast - by Type
- 8.1.1. Mobile Apps
- 8.1.2. Website/Desktop Apps
- 8.2. Market Analysis, Insights and Forecast - by Application
- 8.2.1. Marketing/Advertising Analytics
- 8.2.2. Revenue Analytics
- 8.2.3. In-app Performance Analytics
- 8.3. Market Analysis, Insights and Forecast - by End-user Industry
- 8.3.1. BFSI
- 8.3.2. E-commerce
- 8.3.3. Media an
- 8.3.4. Travel and Tourism
- 8.3.5. IT and Telecom
- 8.3.6. Other En
- 8.1. Market Analysis, Insights and Forecast - by Type
- 9. Asia App Analytics Industry Analysis, Insights and Forecast, 2020-2032
- 9.1. Market Analysis, Insights and Forecast - by Type
- 9.1.1. Mobile Apps
- 9.1.2. Website/Desktop Apps
- 9.2. Market Analysis, Insights and Forecast - by Application
- 9.2.1. Marketing/Advertising Analytics
- 9.2.2. Revenue Analytics
- 9.2.3. In-app Performance Analytics
- 9.3. Market Analysis, Insights and Forecast - by End-user Industry
- 9.3.1. BFSI
- 9.3.2. E-commerce
- 9.3.3. Media an
- 9.3.4. Travel and Tourism
- 9.3.5. IT and Telecom
- 9.3.6. Other En
- 9.1. Market Analysis, Insights and Forecast - by Type
- 10. Australia and New Zealand App Analytics Industry Analysis, Insights and Forecast, 2020-2032
- 10.1. Market Analysis, Insights and Forecast - by Type
- 10.1.1. Mobile Apps
- 10.1.2. Website/Desktop Apps
- 10.2. Market Analysis, Insights and Forecast - by Application
- 10.2.1. Marketing/Advertising Analytics
- 10.2.2. Revenue Analytics
- 10.2.3. In-app Performance Analytics
- 10.3. Market Analysis, Insights and Forecast - by End-user Industry
- 10.3.1. BFSI
- 10.3.2. E-commerce
- 10.3.3. Media an
- 10.3.4. Travel and Tourism
- 10.3.5. IT and Telecom
- 10.3.6. Other En
- 10.1. Market Analysis, Insights and Forecast - by Type
- 11. Latin America App Analytics Industry Analysis, Insights and Forecast, 2020-2032
- 11.1. Market Analysis, Insights and Forecast - by Type
- 11.1.1. Mobile Apps
- 11.1.2. Website/Desktop Apps
- 11.2. Market Analysis, Insights and Forecast - by Application
- 11.2.1. Marketing/Advertising Analytics
- 11.2.2. Revenue Analytics
- 11.2.3. In-app Performance Analytics
- 11.3. Market Analysis, Insights and Forecast - by End-user Industry
- 11.3.1. BFSI
- 11.3.2. E-commerce
- 11.3.3. Media an
- 11.3.4. Travel and Tourism
- 11.3.5. IT and Telecom
- 11.3.6. Other En
- 11.1. Market Analysis, Insights and Forecast - by Type
- 12. Middle East and Africa App Analytics Industry Analysis, Insights and Forecast, 2020-2032
- 12.1. Market Analysis, Insights and Forecast - by Type
- 12.1.1. Mobile Apps
- 12.1.2. Website/Desktop Apps
- 12.2. Market Analysis, Insights and Forecast - by Application
- 12.2.1. Marketing/Advertising Analytics
- 12.2.2. Revenue Analytics
- 12.2.3. In-app Performance Analytics
- 12.3. Market Analysis, Insights and Forecast - by End-user Industry
- 12.3.1. BFSI
- 12.3.2. E-commerce
- 12.3.3. Media an
- 12.3.4. Travel and Tourism
- 12.3.5. IT and Telecom
- 12.3.6. Other En
- 12.1. Market Analysis, Insights and Forecast - by Type
- 13. Competitive Analysis
- 13.1. Company Profiles
- 13.1.1 Mixpanel Inc
- 13.1.1.1. Company Overview
- 13.1.1.2. Products
- 13.1.1.3. Company Financials
- 13.1.1.4. SWOT Analysis
- 13.1.2 Localytics (Upland Software Inc )
- 13.1.2.1. Company Overview
- 13.1.2.2. Products
- 13.1.2.3. Company Financials
- 13.1.2.4. SWOT Analysis
- 13.1.3 AppsFlyer Ltd
- 13.1.3.1. Company Overview
- 13.1.3.2. Products
- 13.1.3.3. Company Financials
- 13.1.3.4. SWOT Analysis
- 13.1.4 App Annie Inc
- 13.1.4.1. Company Overview
- 13.1.4.2. Products
- 13.1.4.3. Company Financials
- 13.1.4.4. SWOT Analysis
- 13.1.5 Countly Ltd
- 13.1.5.1. Company Overview
- 13.1.5.2. Products
- 13.1.5.3. Company Financials
- 13.1.5.4. SWOT Analysis
- 13.1.6 Google LLC
- 13.1.6.1. Company Overview
- 13.1.6.2. Products
- 13.1.6.3. Company Financials
- 13.1.6.4. SWOT Analysis
- 13.1.7 Adobe Inc
- 13.1.7.1. Company Overview
- 13.1.7.2. Products
- 13.1.7.3. Company Financials
- 13.1.7.4. SWOT Analysis
- 13.1.8 Amazon Web Services Inc
- 13.1.8.1. Company Overview
- 13.1.8.2. Products
- 13.1.8.3. Company Financials
- 13.1.8.4. SWOT Analysis
- 13.1.9 AppDynamics LLC
- 13.1.9.1. Company Overview
- 13.1.9.2. Products
- 13.1.9.3. Company Financials
- 13.1.9.4. SWOT Analysis
- 13.1.10 Flurry Inc
- 13.1.10.1. Company Overview
- 13.1.10.2. Products
- 13.1.10.3. Company Financials
- 13.1.10.4. SWOT Analysis
- 13.1.11 Kochava Inc
- 13.1.11.1. Company Overview
- 13.1.11.2. Products
- 13.1.11.3. Company Financials
- 13.1.11.4. SWOT Analysis
- 13.1.1 Mixpanel Inc
- 13.2. Market Entropy
- 13.2.1 Company's Key Areas Served
- 13.2.2 Recent Developments
- 13.3. Company Market Share Analysis 2025
- 13.3.1 Top 5 Companies Market Share Analysis
- 13.3.2 Top 3 Companies Market Share Analysis
- 13.4. List of Potential Customers
- 14. Research Methodology
List of Figures
- Figure 1: Global App Analytics Industry Revenue Breakdown (undefined, %) by Region 2025 & 2033
- Figure 2: North America App Analytics Industry Revenue (undefined), by Type 2025 & 2033
- Figure 3: North America App Analytics Industry Revenue Share (%), by Type 2025 & 2033
- Figure 4: North America App Analytics Industry Revenue (undefined), by Application 2025 & 2033
- Figure 5: North America App Analytics Industry Revenue Share (%), by Application 2025 & 2033
- Figure 6: North America App Analytics Industry Revenue (undefined), by End-user Industry 2025 & 2033
- Figure 7: North America App Analytics Industry Revenue Share (%), by End-user Industry 2025 & 2033
- Figure 8: North America App Analytics Industry Revenue (undefined), by Country 2025 & 2033
- Figure 9: North America App Analytics Industry Revenue Share (%), by Country 2025 & 2033
- Figure 10: Europe App Analytics Industry Revenue (undefined), by Type 2025 & 2033
- Figure 11: Europe App Analytics Industry Revenue Share (%), by Type 2025 & 2033
- Figure 12: Europe App Analytics Industry Revenue (undefined), by Application 2025 & 2033
- Figure 13: Europe App Analytics Industry Revenue Share (%), by Application 2025 & 2033
- Figure 14: Europe App Analytics Industry Revenue (undefined), by End-user Industry 2025 & 2033
- Figure 15: Europe App Analytics Industry Revenue Share (%), by End-user Industry 2025 & 2033
- Figure 16: Europe App Analytics Industry Revenue (undefined), by Country 2025 & 2033
- Figure 17: Europe App Analytics Industry Revenue Share (%), by Country 2025 & 2033
- Figure 18: Asia App Analytics Industry Revenue (undefined), by Type 2025 & 2033
- Figure 19: Asia App Analytics Industry Revenue Share (%), by Type 2025 & 2033
- Figure 20: Asia App Analytics Industry Revenue (undefined), by Application 2025 & 2033
- Figure 21: Asia App Analytics Industry Revenue Share (%), by Application 2025 & 2033
- Figure 22: Asia App Analytics Industry Revenue (undefined), by End-user Industry 2025 & 2033
- Figure 23: Asia App Analytics Industry Revenue Share (%), by End-user Industry 2025 & 2033
- Figure 24: Asia App Analytics Industry Revenue (undefined), by Country 2025 & 2033
- Figure 25: Asia App Analytics Industry Revenue Share (%), by Country 2025 & 2033
- Figure 26: Australia and New Zealand App Analytics Industry Revenue (undefined), by Type 2025 & 2033
- Figure 27: Australia and New Zealand App Analytics Industry Revenue Share (%), by Type 2025 & 2033
- Figure 28: Australia and New Zealand App Analytics Industry Revenue (undefined), by Application 2025 & 2033
- Figure 29: Australia and New Zealand App Analytics Industry Revenue Share (%), by Application 2025 & 2033
- Figure 30: Australia and New Zealand App Analytics Industry Revenue (undefined), by End-user Industry 2025 & 2033
- Figure 31: Australia and New Zealand App Analytics Industry Revenue Share (%), by End-user Industry 2025 & 2033
- Figure 32: Australia and New Zealand App Analytics Industry Revenue (undefined), by Country 2025 & 2033
- Figure 33: Australia and New Zealand App Analytics Industry Revenue Share (%), by Country 2025 & 2033
- Figure 34: Latin America App Analytics Industry Revenue (undefined), by Type 2025 & 2033
- Figure 35: Latin America App Analytics Industry Revenue Share (%), by Type 2025 & 2033
- Figure 36: Latin America App Analytics Industry Revenue (undefined), by Application 2025 & 2033
- Figure 37: Latin America App Analytics Industry Revenue Share (%), by Application 2025 & 2033
- Figure 38: Latin America App Analytics Industry Revenue (undefined), by End-user Industry 2025 & 2033
- Figure 39: Latin America App Analytics Industry Revenue Share (%), by End-user Industry 2025 & 2033
- Figure 40: Latin America App Analytics Industry Revenue (undefined), by Country 2025 & 2033
- Figure 41: Latin America App Analytics Industry Revenue Share (%), by Country 2025 & 2033
- Figure 42: Middle East and Africa App Analytics Industry Revenue (undefined), by Type 2025 & 2033
- Figure 43: Middle East and Africa App Analytics Industry Revenue Share (%), by Type 2025 & 2033
- Figure 44: Middle East and Africa App Analytics Industry Revenue (undefined), by Application 2025 & 2033
- Figure 45: Middle East and Africa App Analytics Industry Revenue Share (%), by Application 2025 & 2033
- Figure 46: Middle East and Africa App Analytics Industry Revenue (undefined), by End-user Industry 2025 & 2033
- Figure 47: Middle East and Africa App Analytics Industry Revenue Share (%), by End-user Industry 2025 & 2033
- Figure 48: Middle East and Africa App Analytics Industry Revenue (undefined), by Country 2025 & 2033
- Figure 49: Middle East and Africa App Analytics Industry Revenue Share (%), by Country 2025 & 2033
List of Tables
- Table 1: Global App Analytics Industry Revenue undefined Forecast, by Type 2020 & 2033
- Table 2: Global App Analytics Industry Revenue undefined Forecast, by Application 2020 & 2033
- Table 3: Global App Analytics Industry Revenue undefined Forecast, by End-user Industry 2020 & 2033
- Table 4: Global App Analytics Industry Revenue undefined Forecast, by Region 2020 & 2033
- Table 5: Global App Analytics Industry Revenue undefined Forecast, by Type 2020 & 2033
- Table 6: Global App Analytics Industry Revenue undefined Forecast, by Application 2020 & 2033
- Table 7: Global App Analytics Industry Revenue undefined Forecast, by End-user Industry 2020 & 2033
- Table 8: Global App Analytics Industry Revenue undefined Forecast, by Country 2020 & 2033
- Table 9: Global App Analytics Industry Revenue undefined Forecast, by Type 2020 & 2033
- Table 10: Global App Analytics Industry Revenue undefined Forecast, by Application 2020 & 2033
- Table 11: Global App Analytics Industry Revenue undefined Forecast, by End-user Industry 2020 & 2033
- Table 12: Global App Analytics Industry Revenue undefined Forecast, by Country 2020 & 2033
- Table 13: Global App Analytics Industry Revenue undefined Forecast, by Type 2020 & 2033
- Table 14: Global App Analytics Industry Revenue undefined Forecast, by Application 2020 & 2033
- Table 15: Global App Analytics Industry Revenue undefined Forecast, by End-user Industry 2020 & 2033
- Table 16: Global App Analytics Industry Revenue undefined Forecast, by Country 2020 & 2033
- Table 17: Global App Analytics Industry Revenue undefined Forecast, by Type 2020 & 2033
- Table 18: Global App Analytics Industry Revenue undefined Forecast, by Application 2020 & 2033
- Table 19: Global App Analytics Industry Revenue undefined Forecast, by End-user Industry 2020 & 2033
- Table 20: Global App Analytics Industry Revenue undefined Forecast, by Country 2020 & 2033
- Table 21: Global App Analytics Industry Revenue undefined Forecast, by Type 2020 & 2033
- Table 22: Global App Analytics Industry Revenue undefined Forecast, by Application 2020 & 2033
- Table 23: Global App Analytics Industry Revenue undefined Forecast, by End-user Industry 2020 & 2033
- Table 24: Global App Analytics Industry Revenue undefined Forecast, by Country 2020 & 2033
- Table 25: Global App Analytics Industry Revenue undefined Forecast, by Type 2020 & 2033
- Table 26: Global App Analytics Industry Revenue undefined Forecast, by Application 2020 & 2033
- Table 27: Global App Analytics Industry Revenue undefined Forecast, by End-user Industry 2020 & 2033
- Table 28: Global App Analytics Industry Revenue undefined Forecast, by Country 2020 & 2033
Frequently Asked Questions
1. What is the projected Compound Annual Growth Rate (CAGR) of the App Analytics Industry?
The projected CAGR is approximately 19.6%.
2. Which companies are prominent players in the App Analytics Industry?
Key companies in the market include Mixpanel Inc, Localytics (Upland Software Inc ), AppsFlyer Ltd, App Annie Inc, Countly Ltd, Google LLC, Adobe Inc, Amazon Web Services Inc, AppDynamics LLC, Flurry Inc, Kochava Inc.
3. What are the main segments of the App Analytics Industry?
The market segments include Type, Application, End-user Industry.
4. Can you provide details about the market size?
The market size is estimated to be USD XXX N/A as of 2022.
5. What are some drivers contributing to market growth?
; Increasing Usage of Mobile/Web Apps Across Various End-user Industries; Increasing Adoption of Technologies like 5G Technology and Deeper Penetration of Smartphones; Increase in the Amount of Time Spent on Mobile Devices Coupled With the Increasing Focus on Enhancing Customer Experience.
6. What are the notable trends driving market growth?
Media and Entertainment Industry Expected to Capture Significant Share.
7. Are there any restraints impacting market growth?
; Privacy and Security Concerns regarding the Data Saftey and Application.
8. Can you provide examples of recent developments in the market?
N/A
9. What pricing options are available for accessing the report?
Pricing options include single-user, multi-user, and enterprise licenses priced at USD 4750, USD 5250, and USD 8750 respectively.
10. Is the market size provided in terms of value or volume?
The market size is provided in terms of value, measured in N/A.
11. Are there any specific market keywords associated with the report?
Yes, the market keyword associated with the report is "App Analytics Industry," which aids in identifying and referencing the specific market segment covered.
12. How do I determine which pricing option suits my needs best?
The pricing options vary based on user requirements and access needs. Individual users may opt for single-user licenses, while businesses requiring broader access may choose multi-user or enterprise licenses for cost-effective access to the report.
13. Are there any additional resources or data provided in the App Analytics Industry report?
While the report offers comprehensive insights, it's advisable to review the specific contents or supplementary materials provided to ascertain if additional resources or data are available.
14. How can I stay updated on further developments or reports in the App Analytics Industry?
To stay informed about further developments, trends, and reports in the App Analytics Industry, consider subscribing to industry newsletters, following relevant companies and organizations, or regularly checking reputable industry news sources and publications.
Methodology
Step 1 - Identification of Relevant Samples Size from Population Database


Step 2 - Approaches for Defining Global Market Size (Value, Volume* & Price*)

Note*: In applicable scenarios
Step 3 - Data Sources
Primary Research
- Web Analytics
- Survey Reports
- Research Institute
- Latest Research Reports
- Opinion Leaders
Secondary Research
- Annual Reports
- White Paper
- Latest Press Release
- Industry Association
- Paid Database
- Investor Presentations

Step 4 - Data Triangulation
Involves using different sources of information in order to increase the validity of a study
These sources are likely to be stakeholders in a program - participants, other researchers, program staff, other community members, and so on.
Then we put all data in single framework & apply various statistical tools to find out the dynamic on the market.
During the analysis stage, feedback from the stakeholder groups would be compared to determine areas of agreement as well as areas of divergence