

Key Insights
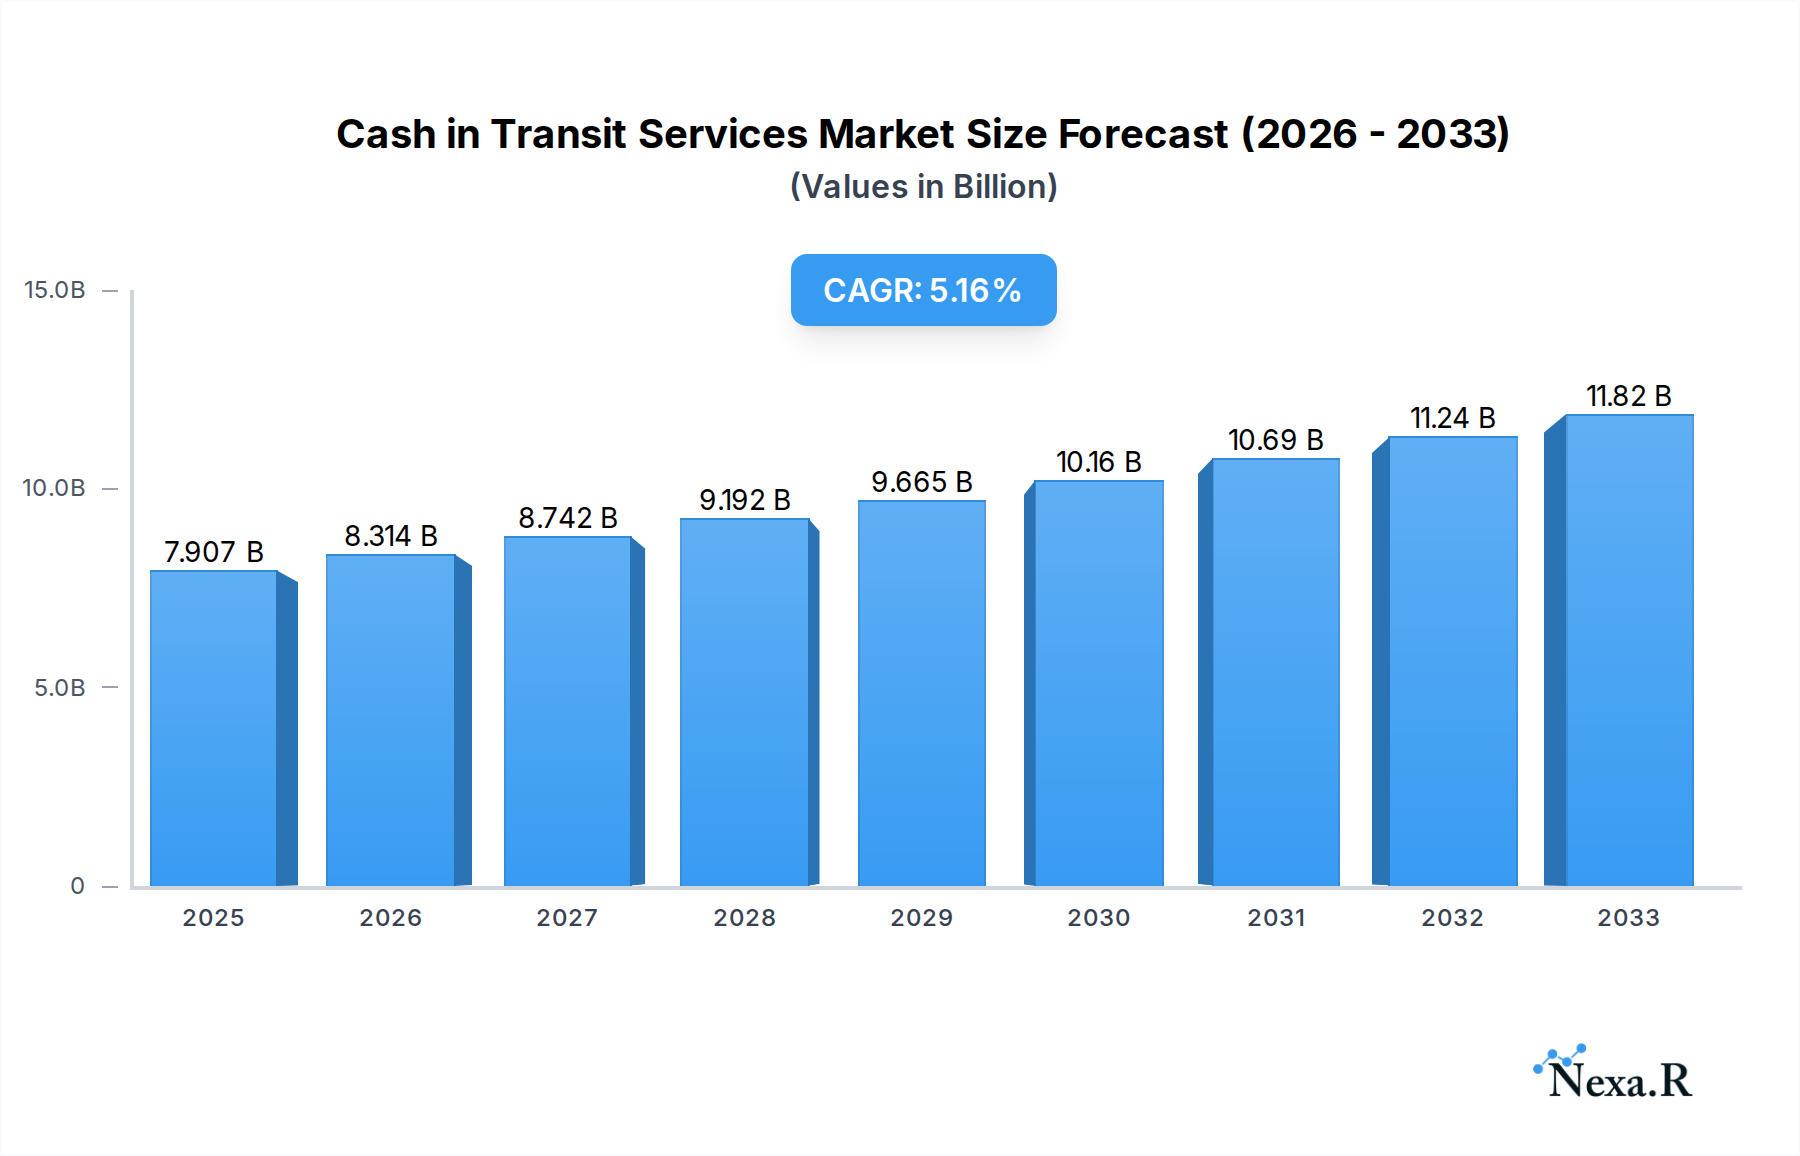
The global Cash in Transit (CIT) services market is projected to experience robust growth, reaching an estimated $7,906.6 million in 2025 and expanding at a compound annual growth rate (CAGR) of 5.2% through 2033. This expansion is driven by a confluence of factors, including the persistent reliance on cash in various sectors, the increasing need for secure and efficient cash management solutions, and the growing apprehension surrounding physical cash theft and fraud. The retail sector, financial institutions, and casinos are key adopters of CIT services, demanding efficient cash collection and delivery mechanisms to streamline their operations and mitigate risks. Government agencies and healthcare facilities are also increasingly recognizing the value of professional CIT services for secure cash handling and compliance. The market's trajectory is further shaped by evolving security technologies and a demand for specialized services like armored transportation, ATM servicing, and secure cash processing.

Cash in Transit Services Market Size (In Billion)
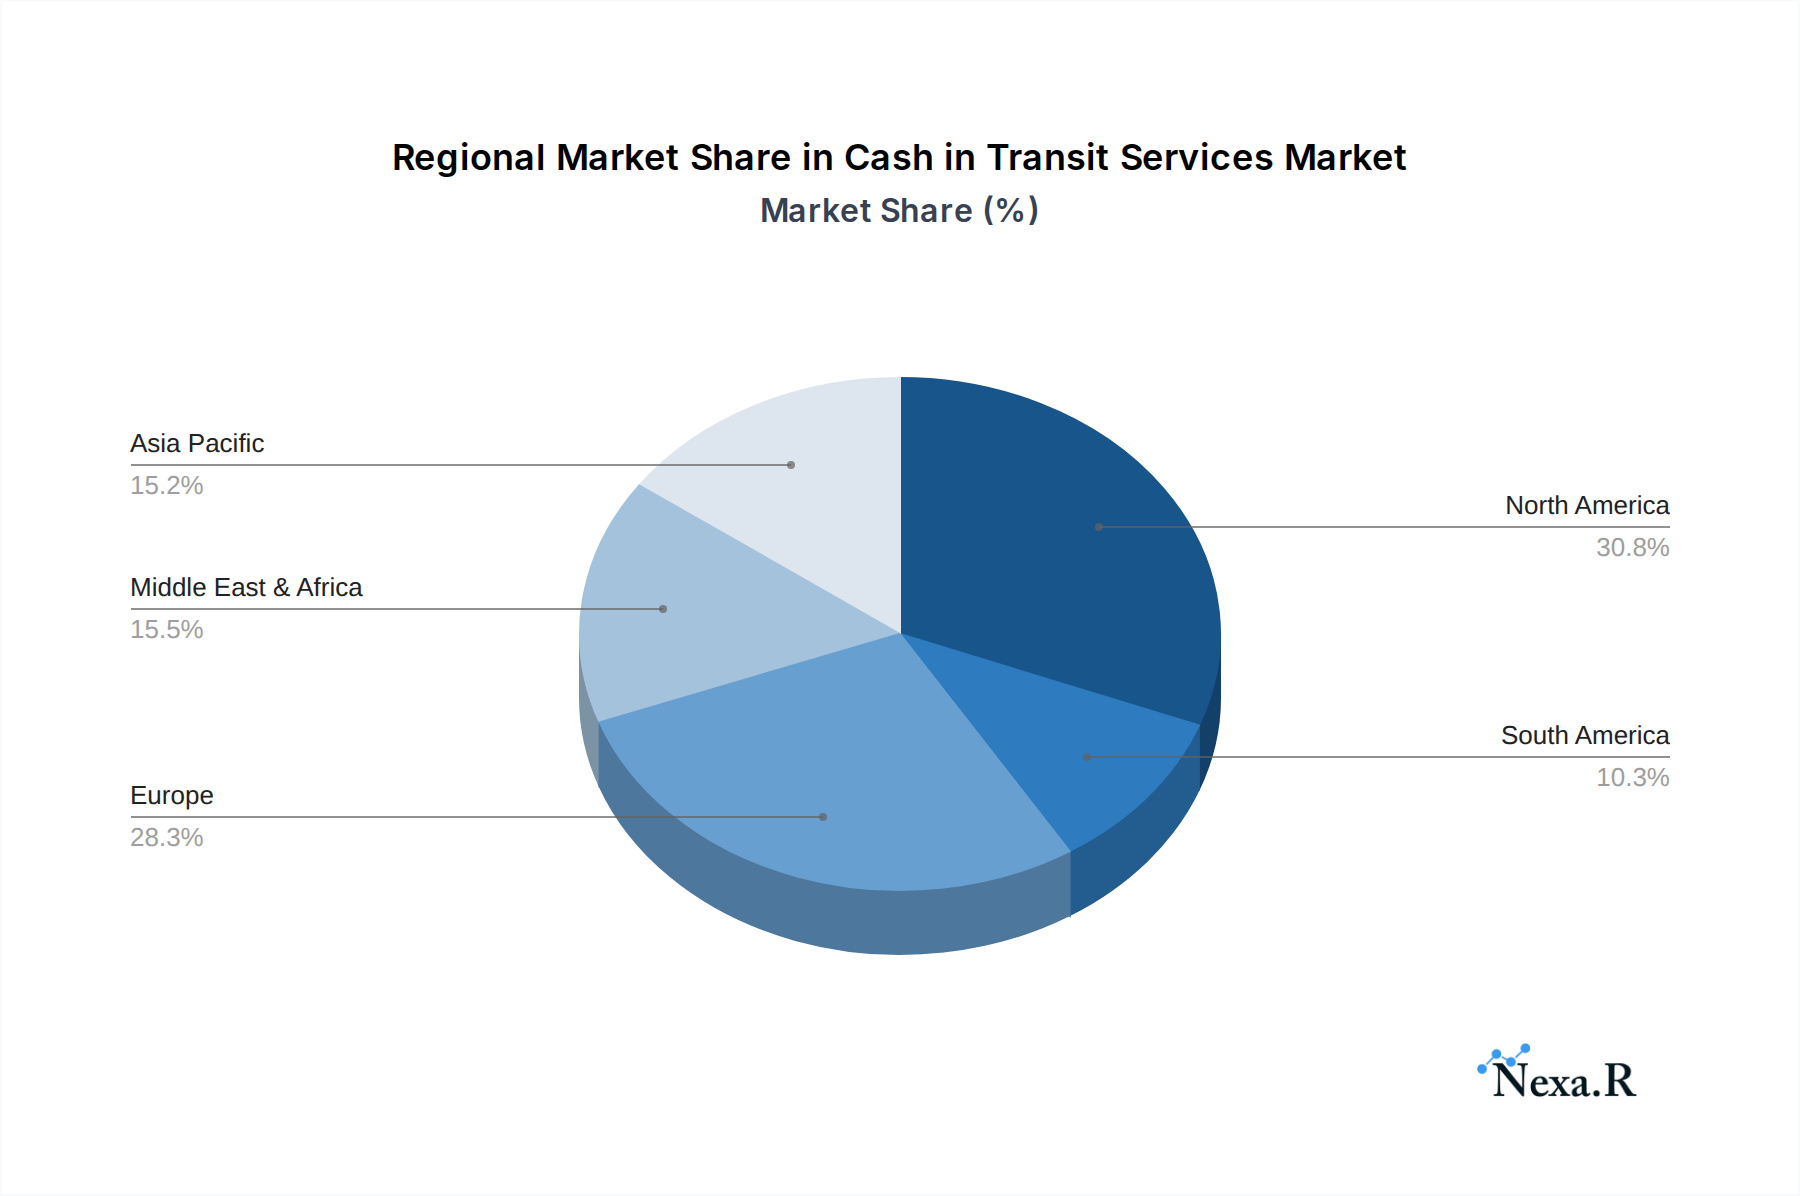
Emerging trends such as the integration of advanced tracking and monitoring systems, the adoption of cashless payment options influencing cash volumes, and the consolidation within the CIT provider landscape are shaping the market's dynamics. While the growth of digital payments presents a long-term consideration, the immediate and ongoing need for secure physical cash management across diverse industries underpins the market's resilience. The market's geographical landscape showcases a strong presence in North America and Europe, with Asia Pacific demonstrating significant growth potential due to its expanding economies and increasing transactional activities. Companies are focusing on technological innovation, strategic partnerships, and expanding service portfolios to cater to the diverse and evolving needs of their clientele. The continued demand for reliable and secure cash handling solutions will ensure sustained growth for the CIT services market.
Cash in Transit Services Company Market Share
This comprehensive market research report delivers unparalleled insights into the global Cash in Transit Services Market. Spanning from 2019 to 2033, with a base year of 2025, this analysis provides actionable intelligence for industry stakeholders seeking to understand market dynamics, growth trajectories, and competitive landscapes. Delve into critical segments like Retail, Financial Institutes, Casino, Government Agencies, Hospitals and Hotels, and Others, examining key service types including Cash Collection, Cash Delivery, and Cash Counting. With a focus on quantitative data, including market share percentages and CAGR projections, and qualitative analysis of industry developments, this report empowers strategic decision-making. Explore the parent market's influence and the intricate dynamics of the child market within this vital sector.
Cash in Transit Services Market Dynamics & Structure
The Cash in Transit Services Market exhibits a moderate level of market concentration, with a few prominent global players like Brink's Incorporated, Loomis AB, and G4S Limited holding significant market share. Technological innovation is a key driver, with advancements in GPS tracking, real-time monitoring, armored vehicle technology, and AI-powered route optimization enhancing efficiency and security. Regulatory frameworks, while varying by region, are largely focused on stringent security protocols, personnel vetting, and compliance with anti-money laundering regulations, posing a barrier to entry for new, less compliant players. Competitive product substitutes are limited, primarily revolving around secure logistics and digital payment solutions, though the intrinsic need for physical cash handling continues to sustain the core business. End-user demographics are diverse, encompassing businesses of all sizes requiring secure cash management. Mergers and acquisitions (M&A) trends indicate strategic consolidation, with companies like Knightguard and SecureCash actively participating in acquiring smaller entities to expand geographical reach and service offerings, with an estimated xx billion in deal volume during the historical period.
- Market Concentration: Moderate, dominated by a few key global providers.
- Technological Innovation: Driven by GPS, real-time tracking, AI, and advanced vehicle security.
- Regulatory Frameworks: Focus on security, compliance, and personnel integrity, acting as a barrier.
- Competitive Landscape: Limited direct substitutes, with digital payments posing an indirect challenge.
- End-User Demographics: Broad, from large corporations to small businesses reliant on cash.
- M&A Trends: Strategic consolidation for market expansion and service integration, with estimated xx billion in deal volume.
Cash in Transit Services Growth Trends & Insights
The global Cash in Transit Services Market is poised for steady growth, projected to reach an estimated USD 250 billion by 2033, exhibiting a Compound Annual Growth Rate (CAGR) of approximately 5.5% from the base year of 2025. This growth is underpinned by the persistent reliance on physical currency across various sectors, particularly in emerging economies and specific segments like retail and casinos, where cash transactions remain prevalent. Adoption rates for advanced cash management solutions are steadily increasing, driven by the need for enhanced security and operational efficiency. Technological disruptions are primarily focused on enhancing transparency and security, such as the integration of biometric scanners, tamper-evident packaging, and predictive analytics for route planning to mitigate risks. Consumer behavior shifts, while leaning towards digital payments, have not entirely eradicated cash usage; in fact, the convenience and anonymity of cash in certain transactions continue to drive demand for secure transit. Market penetration of advanced services is expected to rise as businesses prioritize cost-efficiency and risk reduction, further solidifying the market's upward trajectory. The parent market's overall economic health significantly influences the demand for cash-in-transit services, with a strong correlation between economic activity and cash flow requirements.
Dominant Regions, Countries, or Segments in Cash in Transit Services
North America currently dominates the Cash in Transit Services Market, driven by a mature financial infrastructure, a robust retail sector, and high levels of consumer spending that necessitate secure cash handling. The United States, in particular, represents a significant portion of this regional dominance, fueled by a vast network of financial institutions and a thriving casino industry. The Financial Institutes segment is a primary driver of growth, with banks and credit unions requiring constant secure transportation of cash for ATM replenishment, branch deposits, and inter-branch transfers, contributing approximately 30% to the overall market share. The Retail segment also holds substantial importance, with a widespread need for daily cash collections and secure delivery of change, accounting for another 25% of the market. Government agencies, especially in their disbursement of funds and collection of taxes, also represent a consistent demand.
- North America's Dominance: Strong economic foundation, advanced financial systems, and high cash circulation.
- United States as a Key Player: Extensive network of financial institutions and a robust retail landscape.
- Financial Institutes Segment (30% Market Share): Critical for ATM services, branch operations, and inter-bank transfers.
- Retail Segment (25% Market Share): Essential for daily cash collections and change delivery.
- Government Agencies: Consistent demand for secure fund transportation and collection.
- Technological Adoption: High adoption of advanced security and tracking technologies.
- Regulatory Environment: Stringent but well-established regulations supporting secure operations.
- Economic Stability: Contributes to consistent demand for cash handling services.
- Infrastructure: Well-developed transportation networks facilitating efficient transit.
Cash in Transit Services Product Landscape
The Cash in Transit Services product landscape is characterized by an evolution towards enhanced security, real-time visibility, and efficiency. Armored vehicles equipped with advanced locking mechanisms, GPS tracking, and tamper-evident features are standard. Innovations include smart safes and cash deposit machines that automate counting and reconciliation, reducing manual handling and associated risks. Performance metrics focus on on-time delivery rates, security breach prevention, and accuracy in cash counting. Unique selling propositions often lie in the technological sophistication of their fleet, the comprehensiveness of their security protocols, and their ability to offer end-to-end cash management solutions, from collection to deposit.
Key Drivers, Barriers & Challenges in Cash in Transit Services
Key Drivers:
- Persistent Cash Usage: Despite digital trends, cash remains vital for many transactions.
- Increasing Security Concerns: Businesses prioritize protecting assets from theft and fraud.
- Regulatory Compliance: Strict regulations mandate secure cash handling.
- Technological Advancements: Enhanced tracking, monitoring, and automation improve efficiency.
- Growth in Emerging Economies: Rising economic activity in developing regions fuels cash demand.
Key Barriers & Challenges:
- Supply Chain Disruptions: Global events can impact vehicle maintenance and security equipment availability.
- Regulatory Hurdles: Navigating diverse and evolving international regulations.
- Competitive Pressures: Intense competition from established players and new entrants.
- Rising Operational Costs: Fuel prices, labor, and insurance contribute to increased expenses.
- Digital Payment Adoption: Long-term shift towards digital transactions poses a threat to traditional cash services.
Emerging Opportunities in Cash in Transit Services
Emerging opportunities lie in providing specialized cash handling solutions for the burgeoning e-commerce sector’s cash-on-delivery models and for the increasing adoption of cryptocurrencies that require secure physical redemption points. The development of eco-friendly and hybrid armored vehicles presents a niche market. Furthermore, offering data analytics services derived from cash flow patterns can provide valuable insights to clients, creating an additional revenue stream. Untapped markets in developing nations with a strong cash-dependent economy present significant expansion potential.
Growth Accelerators in the Cash in Transit Services Industry
Growth accelerators for the Cash in Transit Services Industry include strategic partnerships with financial institutions and large retail chains to secure long-term contracts. The adoption of IoT devices for real-time monitoring of cash levels and vehicle status, coupled with AI-powered predictive maintenance, will significantly enhance operational efficiency and reduce downtime. Furthermore, expanding service offerings to include secure document and high-value item logistics can diversify revenue streams and leverage existing infrastructure. Market expansion into underserved regions, driven by economic growth, will also be a crucial catalyst.
Key Players Shaping the Cash in Transit Services Market
- Knightguard
- SecureCash
- Grupo Protégé
- Brink's Incorporated
- Loomis AB
- The Prosegur Group
- G4S Limited
Notable Milestones in Cash in Transit Services Sector
- 2019: Increased investment in GPS and real-time tracking technologies by major players.
- 2020: Heightened focus on contactless cash handling solutions due to global health concerns.
- 2021: Strategic M&A activities leading to consolidation and expanded service portfolios.
- 2022: Development and deployment of more fuel-efficient and secure armored vehicle designs.
- 2023: Integration of advanced cybersecurity measures to protect digital tracking and communication systems.
- 2024: Enhanced adoption of AI for route optimization and risk assessment in cash logistics.
In-Depth Cash in Transit Services Market Outlook
The Cash in Transit Services Market is projected for sustained growth, driven by the continued global reliance on physical currency and the increasing demand for secure and efficient cash management solutions. Key growth accelerators include the integration of advanced technologies like AI and IoT for enhanced operational efficiency and predictive analytics, alongside strategic partnerships and market expansion into high-potential emerging economies. The market's resilience lies in its essential nature for a broad spectrum of industries, ensuring a robust future outlook characterized by innovation and strategic adaptation.
Cash in Transit Services Segmentation
-
1. Application
- 1.1. Retail
- 1.2. Financial Institutes
- 1.3. Casino
- 1.4. Government Agencies
- 1.5. Hospitals and Hotels
- 1.6. Others
-
2. Types
- 2.1. Cash Collection
- 2.2. Cash Delivery
- 2.3. Cash Counting
Cash in Transit Services Segmentation By Geography
-
1. North America
- 1.1. United States
- 1.2. Canada
- 1.3. Mexico
-
2. South America
- 2.1. Brazil
- 2.2. Argentina
- 2.3. Rest of South America
-
3. Europe
- 3.1. United Kingdom
- 3.2. Germany
- 3.3. France
- 3.4. Italy
- 3.5. Spain
- 3.6. Russia
- 3.7. Benelux
- 3.8. Nordics
- 3.9. Rest of Europe
-
4. Middle East & Africa
- 4.1. Turkey
- 4.2. Israel
- 4.3. GCC
- 4.4. North Africa
- 4.5. South Africa
- 4.6. Rest of Middle East & Africa
-
5. Asia Pacific
- 5.1. China
- 5.2. India
- 5.3. Japan
- 5.4. South Korea
- 5.5. ASEAN
- 5.6. Oceania
- 5.7. Rest of Asia Pacific
Cash in Transit Services Regional Market Share
Geographic Coverage of Cash in Transit Services
Cash in Transit Services REPORT HIGHLIGHTS
| Aspects | Details |
|---|---|
| Study Period | 2020-2034 |
| Base Year | 2025 |
| Estimated Year | 2026 |
| Forecast Period | 2026-2034 |
| Historical Period | 2020-2025 |
| Growth Rate | CAGR of 5.2% from 2020-2034 |
| Segmentation |
|
Table of Contents
- 1. Introduction
- 1.1. Research Scope
- 1.2. Market Segmentation
- 1.3. Research Methodology
- 1.4. Definitions and Assumptions
- 2. Executive Summary
- 2.1. Introduction
- 3. Market Dynamics
- 3.1. Introduction
- 3.2. Market Drivers
- 3.3. Market Restrains
- 3.4. Market Trends
- 4. Market Factor Analysis
- 4.1. Porters Five Forces
- 4.2. Supply/Value Chain
- 4.3. PESTEL analysis
- 4.4. Market Entropy
- 4.5. Patent/Trademark Analysis
- 5. Global Cash in Transit Services Analysis, Insights and Forecast, 2020-2032
- 5.1. Market Analysis, Insights and Forecast - by Application
- 5.1.1. Retail
- 5.1.2. Financial Institutes
- 5.1.3. Casino
- 5.1.4. Government Agencies
- 5.1.5. Hospitals and Hotels
- 5.1.6. Others
- 5.2. Market Analysis, Insights and Forecast - by Types
- 5.2.1. Cash Collection
- 5.2.2. Cash Delivery
- 5.2.3. Cash Counting
- 5.3. Market Analysis, Insights and Forecast - by Region
- 5.3.1. North America
- 5.3.2. South America
- 5.3.3. Europe
- 5.3.4. Middle East & Africa
- 5.3.5. Asia Pacific
- 5.1. Market Analysis, Insights and Forecast - by Application
- 6. North America Cash in Transit Services Analysis, Insights and Forecast, 2020-2032
- 6.1. Market Analysis, Insights and Forecast - by Application
- 6.1.1. Retail
- 6.1.2. Financial Institutes
- 6.1.3. Casino
- 6.1.4. Government Agencies
- 6.1.5. Hospitals and Hotels
- 6.1.6. Others
- 6.2. Market Analysis, Insights and Forecast - by Types
- 6.2.1. Cash Collection
- 6.2.2. Cash Delivery
- 6.2.3. Cash Counting
- 6.1. Market Analysis, Insights and Forecast - by Application
- 7. South America Cash in Transit Services Analysis, Insights and Forecast, 2020-2032
- 7.1. Market Analysis, Insights and Forecast - by Application
- 7.1.1. Retail
- 7.1.2. Financial Institutes
- 7.1.3. Casino
- 7.1.4. Government Agencies
- 7.1.5. Hospitals and Hotels
- 7.1.6. Others
- 7.2. Market Analysis, Insights and Forecast - by Types
- 7.2.1. Cash Collection
- 7.2.2. Cash Delivery
- 7.2.3. Cash Counting
- 7.1. Market Analysis, Insights and Forecast - by Application
- 8. Europe Cash in Transit Services Analysis, Insights and Forecast, 2020-2032
- 8.1. Market Analysis, Insights and Forecast - by Application
- 8.1.1. Retail
- 8.1.2. Financial Institutes
- 8.1.3. Casino
- 8.1.4. Government Agencies
- 8.1.5. Hospitals and Hotels
- 8.1.6. Others
- 8.2. Market Analysis, Insights and Forecast - by Types
- 8.2.1. Cash Collection
- 8.2.2. Cash Delivery
- 8.2.3. Cash Counting
- 8.1. Market Analysis, Insights and Forecast - by Application
- 9. Middle East & Africa Cash in Transit Services Analysis, Insights and Forecast, 2020-2032
- 9.1. Market Analysis, Insights and Forecast - by Application
- 9.1.1. Retail
- 9.1.2. Financial Institutes
- 9.1.3. Casino
- 9.1.4. Government Agencies
- 9.1.5. Hospitals and Hotels
- 9.1.6. Others
- 9.2. Market Analysis, Insights and Forecast - by Types
- 9.2.1. Cash Collection
- 9.2.2. Cash Delivery
- 9.2.3. Cash Counting
- 9.1. Market Analysis, Insights and Forecast - by Application
- 10. Asia Pacific Cash in Transit Services Analysis, Insights and Forecast, 2020-2032
- 10.1. Market Analysis, Insights and Forecast - by Application
- 10.1.1. Retail
- 10.1.2. Financial Institutes
- 10.1.3. Casino
- 10.1.4. Government Agencies
- 10.1.5. Hospitals and Hotels
- 10.1.6. Others
- 10.2. Market Analysis, Insights and Forecast - by Types
- 10.2.1. Cash Collection
- 10.2.2. Cash Delivery
- 10.2.3. Cash Counting
- 10.1. Market Analysis, Insights and Forecast - by Application
- 11. Competitive Analysis
- 11.1. Global Market Share Analysis 2025
- 11.2. Company Profiles
- 11.2.1 Knightguard
- 11.2.1.1. Overview
- 11.2.1.2. Products
- 11.2.1.3. SWOT Analysis
- 11.2.1.4. Recent Developments
- 11.2.1.5. Financials (Based on Availability)
- 11.2.2 SecureCash
- 11.2.2.1. Overview
- 11.2.2.2. Products
- 11.2.2.3. SWOT Analysis
- 11.2.2.4. Recent Developments
- 11.2.2.5. Financials (Based on Availability)
- 11.2.3 Grupo Protégé
- 11.2.3.1. Overview
- 11.2.3.2. Products
- 11.2.3.3. SWOT Analysis
- 11.2.3.4. Recent Developments
- 11.2.3.5. Financials (Based on Availability)
- 11.2.4 Brink's Incorporated
- 11.2.4.1. Overview
- 11.2.4.2. Products
- 11.2.4.3. SWOT Analysis
- 11.2.4.4. Recent Developments
- 11.2.4.5. Financials (Based on Availability)
- 11.2.5 Loomis AB
- 11.2.5.1. Overview
- 11.2.5.2. Products
- 11.2.5.3. SWOT Analysis
- 11.2.5.4. Recent Developments
- 11.2.5.5. Financials (Based on Availability)
- 11.2.6 The Prosegur Group
- 11.2.6.1. Overview
- 11.2.6.2. Products
- 11.2.6.3. SWOT Analysis
- 11.2.6.4. Recent Developments
- 11.2.6.5. Financials (Based on Availability)
- 11.2.7 G4S Limited
- 11.2.7.1. Overview
- 11.2.7.2. Products
- 11.2.7.3. SWOT Analysis
- 11.2.7.4. Recent Developments
- 11.2.7.5. Financials (Based on Availability)
- 11.2.1 Knightguard
List of Figures
- Figure 1: Global Cash in Transit Services Revenue Breakdown (undefined, %) by Region 2025 & 2033
- Figure 2: North America Cash in Transit Services Revenue (undefined), by Application 2025 & 2033
- Figure 3: North America Cash in Transit Services Revenue Share (%), by Application 2025 & 2033
- Figure 4: North America Cash in Transit Services Revenue (undefined), by Types 2025 & 2033
- Figure 5: North America Cash in Transit Services Revenue Share (%), by Types 2025 & 2033
- Figure 6: North America Cash in Transit Services Revenue (undefined), by Country 2025 & 2033
- Figure 7: North America Cash in Transit Services Revenue Share (%), by Country 2025 & 2033
- Figure 8: South America Cash in Transit Services Revenue (undefined), by Application 2025 & 2033
- Figure 9: South America Cash in Transit Services Revenue Share (%), by Application 2025 & 2033
- Figure 10: South America Cash in Transit Services Revenue (undefined), by Types 2025 & 2033
- Figure 11: South America Cash in Transit Services Revenue Share (%), by Types 2025 & 2033
- Figure 12: South America Cash in Transit Services Revenue (undefined), by Country 2025 & 2033
- Figure 13: South America Cash in Transit Services Revenue Share (%), by Country 2025 & 2033
- Figure 14: Europe Cash in Transit Services Revenue (undefined), by Application 2025 & 2033
- Figure 15: Europe Cash in Transit Services Revenue Share (%), by Application 2025 & 2033
- Figure 16: Europe Cash in Transit Services Revenue (undefined), by Types 2025 & 2033
- Figure 17: Europe Cash in Transit Services Revenue Share (%), by Types 2025 & 2033
- Figure 18: Europe Cash in Transit Services Revenue (undefined), by Country 2025 & 2033
- Figure 19: Europe Cash in Transit Services Revenue Share (%), by Country 2025 & 2033
- Figure 20: Middle East & Africa Cash in Transit Services Revenue (undefined), by Application 2025 & 2033
- Figure 21: Middle East & Africa Cash in Transit Services Revenue Share (%), by Application 2025 & 2033
- Figure 22: Middle East & Africa Cash in Transit Services Revenue (undefined), by Types 2025 & 2033
- Figure 23: Middle East & Africa Cash in Transit Services Revenue Share (%), by Types 2025 & 2033
- Figure 24: Middle East & Africa Cash in Transit Services Revenue (undefined), by Country 2025 & 2033
- Figure 25: Middle East & Africa Cash in Transit Services Revenue Share (%), by Country 2025 & 2033
- Figure 26: Asia Pacific Cash in Transit Services Revenue (undefined), by Application 2025 & 2033
- Figure 27: Asia Pacific Cash in Transit Services Revenue Share (%), by Application 2025 & 2033
- Figure 28: Asia Pacific Cash in Transit Services Revenue (undefined), by Types 2025 & 2033
- Figure 29: Asia Pacific Cash in Transit Services Revenue Share (%), by Types 2025 & 2033
- Figure 30: Asia Pacific Cash in Transit Services Revenue (undefined), by Country 2025 & 2033
- Figure 31: Asia Pacific Cash in Transit Services Revenue Share (%), by Country 2025 & 2033
List of Tables
- Table 1: Global Cash in Transit Services Revenue undefined Forecast, by Application 2020 & 2033
- Table 2: Global Cash in Transit Services Revenue undefined Forecast, by Types 2020 & 2033
- Table 3: Global Cash in Transit Services Revenue undefined Forecast, by Region 2020 & 2033
- Table 4: Global Cash in Transit Services Revenue undefined Forecast, by Application 2020 & 2033
- Table 5: Global Cash in Transit Services Revenue undefined Forecast, by Types 2020 & 2033
- Table 6: Global Cash in Transit Services Revenue undefined Forecast, by Country 2020 & 2033
- Table 7: United States Cash in Transit Services Revenue (undefined) Forecast, by Application 2020 & 2033
- Table 8: Canada Cash in Transit Services Revenue (undefined) Forecast, by Application 2020 & 2033
- Table 9: Mexico Cash in Transit Services Revenue (undefined) Forecast, by Application 2020 & 2033
- Table 10: Global Cash in Transit Services Revenue undefined Forecast, by Application 2020 & 2033
- Table 11: Global Cash in Transit Services Revenue undefined Forecast, by Types 2020 & 2033
- Table 12: Global Cash in Transit Services Revenue undefined Forecast, by Country 2020 & 2033
- Table 13: Brazil Cash in Transit Services Revenue (undefined) Forecast, by Application 2020 & 2033
- Table 14: Argentina Cash in Transit Services Revenue (undefined) Forecast, by Application 2020 & 2033
- Table 15: Rest of South America Cash in Transit Services Revenue (undefined) Forecast, by Application 2020 & 2033
- Table 16: Global Cash in Transit Services Revenue undefined Forecast, by Application 2020 & 2033
- Table 17: Global Cash in Transit Services Revenue undefined Forecast, by Types 2020 & 2033
- Table 18: Global Cash in Transit Services Revenue undefined Forecast, by Country 2020 & 2033
- Table 19: United Kingdom Cash in Transit Services Revenue (undefined) Forecast, by Application 2020 & 2033
- Table 20: Germany Cash in Transit Services Revenue (undefined) Forecast, by Application 2020 & 2033
- Table 21: France Cash in Transit Services Revenue (undefined) Forecast, by Application 2020 & 2033
- Table 22: Italy Cash in Transit Services Revenue (undefined) Forecast, by Application 2020 & 2033
- Table 23: Spain Cash in Transit Services Revenue (undefined) Forecast, by Application 2020 & 2033
- Table 24: Russia Cash in Transit Services Revenue (undefined) Forecast, by Application 2020 & 2033
- Table 25: Benelux Cash in Transit Services Revenue (undefined) Forecast, by Application 2020 & 2033
- Table 26: Nordics Cash in Transit Services Revenue (undefined) Forecast, by Application 2020 & 2033
- Table 27: Rest of Europe Cash in Transit Services Revenue (undefined) Forecast, by Application 2020 & 2033
- Table 28: Global Cash in Transit Services Revenue undefined Forecast, by Application 2020 & 2033
- Table 29: Global Cash in Transit Services Revenue undefined Forecast, by Types 2020 & 2033
- Table 30: Global Cash in Transit Services Revenue undefined Forecast, by Country 2020 & 2033
- Table 31: Turkey Cash in Transit Services Revenue (undefined) Forecast, by Application 2020 & 2033
- Table 32: Israel Cash in Transit Services Revenue (undefined) Forecast, by Application 2020 & 2033
- Table 33: GCC Cash in Transit Services Revenue (undefined) Forecast, by Application 2020 & 2033
- Table 34: North Africa Cash in Transit Services Revenue (undefined) Forecast, by Application 2020 & 2033
- Table 35: South Africa Cash in Transit Services Revenue (undefined) Forecast, by Application 2020 & 2033
- Table 36: Rest of Middle East & Africa Cash in Transit Services Revenue (undefined) Forecast, by Application 2020 & 2033
- Table 37: Global Cash in Transit Services Revenue undefined Forecast, by Application 2020 & 2033
- Table 38: Global Cash in Transit Services Revenue undefined Forecast, by Types 2020 & 2033
- Table 39: Global Cash in Transit Services Revenue undefined Forecast, by Country 2020 & 2033
- Table 40: China Cash in Transit Services Revenue (undefined) Forecast, by Application 2020 & 2033
- Table 41: India Cash in Transit Services Revenue (undefined) Forecast, by Application 2020 & 2033
- Table 42: Japan Cash in Transit Services Revenue (undefined) Forecast, by Application 2020 & 2033
- Table 43: South Korea Cash in Transit Services Revenue (undefined) Forecast, by Application 2020 & 2033
- Table 44: ASEAN Cash in Transit Services Revenue (undefined) Forecast, by Application 2020 & 2033
- Table 45: Oceania Cash in Transit Services Revenue (undefined) Forecast, by Application 2020 & 2033
- Table 46: Rest of Asia Pacific Cash in Transit Services Revenue (undefined) Forecast, by Application 2020 & 2033
Frequently Asked Questions
1. What is the projected Compound Annual Growth Rate (CAGR) of the Cash in Transit Services?
The projected CAGR is approximately 5.2%.
2. Which companies are prominent players in the Cash in Transit Services?
Key companies in the market include Knightguard, SecureCash, Grupo Protégé, Brink's Incorporated, Loomis AB, The Prosegur Group, G4S Limited.
3. What are the main segments of the Cash in Transit Services?
The market segments include Application, Types.
4. Can you provide details about the market size?
The market size is estimated to be USD XXX N/A as of 2022.
5. What are some drivers contributing to market growth?
N/A
6. What are the notable trends driving market growth?
N/A
7. Are there any restraints impacting market growth?
N/A
8. Can you provide examples of recent developments in the market?
N/A
9. What pricing options are available for accessing the report?
Pricing options include single-user, multi-user, and enterprise licenses priced at USD 3350.00, USD 5025.00, and USD 6700.00 respectively.
10. Is the market size provided in terms of value or volume?
The market size is provided in terms of value, measured in N/A.
11. Are there any specific market keywords associated with the report?
Yes, the market keyword associated with the report is "Cash in Transit Services," which aids in identifying and referencing the specific market segment covered.
12. How do I determine which pricing option suits my needs best?
The pricing options vary based on user requirements and access needs. Individual users may opt for single-user licenses, while businesses requiring broader access may choose multi-user or enterprise licenses for cost-effective access to the report.
13. Are there any additional resources or data provided in the Cash in Transit Services report?
While the report offers comprehensive insights, it's advisable to review the specific contents or supplementary materials provided to ascertain if additional resources or data are available.
14. How can I stay updated on further developments or reports in the Cash in Transit Services?
To stay informed about further developments, trends, and reports in the Cash in Transit Services, consider subscribing to industry newsletters, following relevant companies and organizations, or regularly checking reputable industry news sources and publications.
Methodology
Step 1 - Identification of Relevant Samples Size from Population Database


Step 2 - Approaches for Defining Global Market Size (Value, Volume* & Price*)

Note*: In applicable scenarios
Step 3 - Data Sources
Primary Research
- Web Analytics
- Survey Reports
- Research Institute
- Latest Research Reports
- Opinion Leaders
Secondary Research
- Annual Reports
- White Paper
- Latest Press Release
- Industry Association
- Paid Database
- Investor Presentations

Step 4 - Data Triangulation
Involves using different sources of information in order to increase the validity of a study
These sources are likely to be stakeholders in a program - participants, other researchers, program staff, other community members, and so on.
Then we put all data in single framework & apply various statistical tools to find out the dynamic on the market.
During the analysis stage, feedback from the stakeholder groups would be compared to determine areas of agreement as well as areas of divergence