

Key Insights
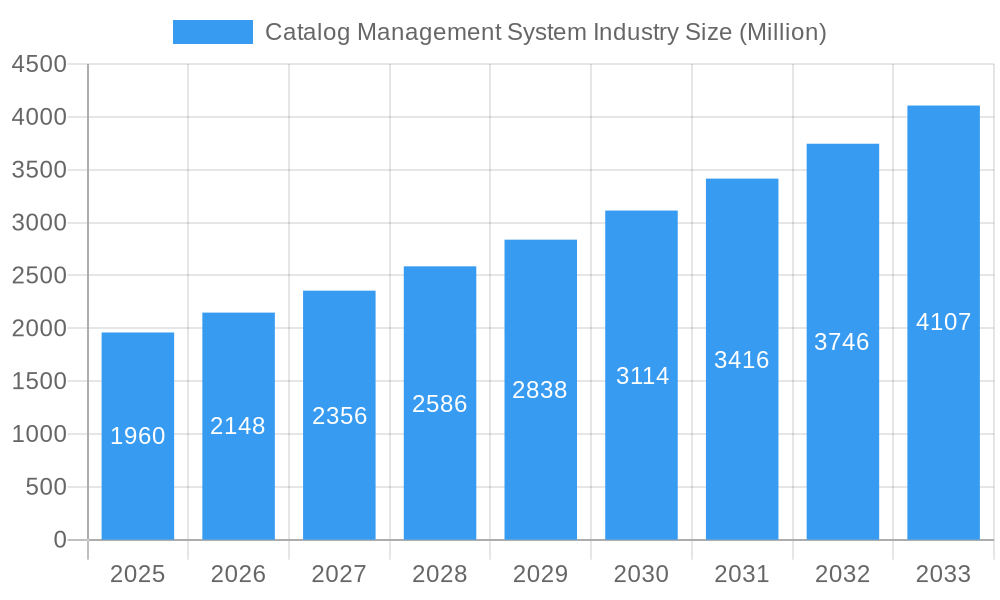
The Catalog Management System (CMS) market is experiencing robust growth, projected to reach \$1.96 billion in 2025 and maintain a Compound Annual Growth Rate (CAGR) of 9.68% from 2025 to 2033. This expansion is fueled by several key drivers. The increasing need for efficient inventory management across diverse industries, particularly in e-commerce and retail, is a significant factor. Businesses are adopting CMS solutions to streamline their operations, improve data accuracy, and enhance customer experiences through personalized catalogs and seamless online ordering processes. Furthermore, the rising adoption of cloud-based deployments offers scalability and cost-effectiveness, driving market growth. The integration of advanced technologies like AI and machine learning for catalog optimization and automation further contributes to the market's expansion. While some challenges exist, such as the initial investment costs associated with implementing new systems and the need for skilled personnel to manage these complex platforms, the overall market outlook remains overwhelmingly positive.
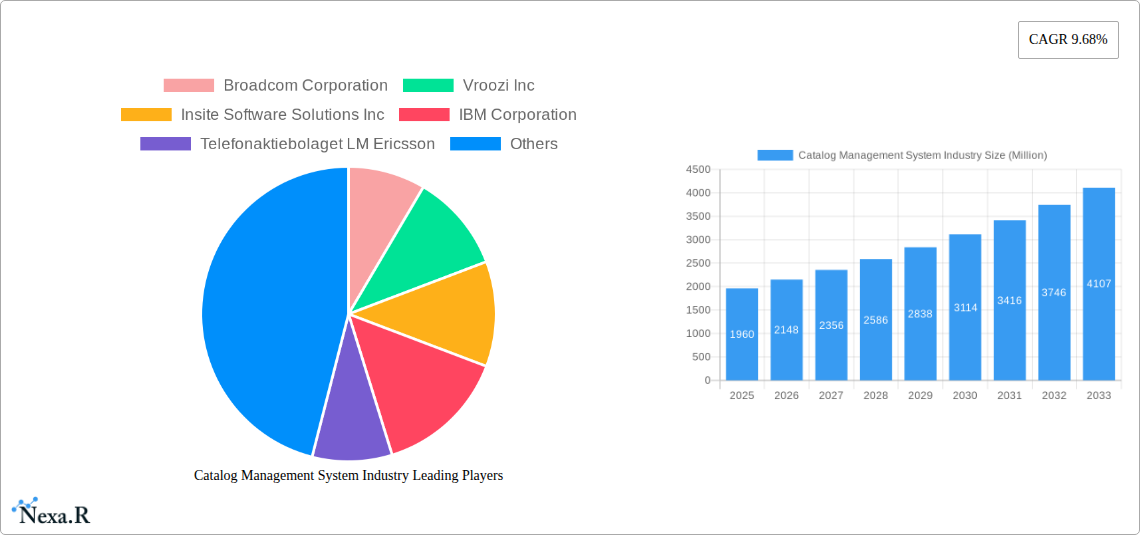
Catalog Management System Industry Market Size (In Billion)
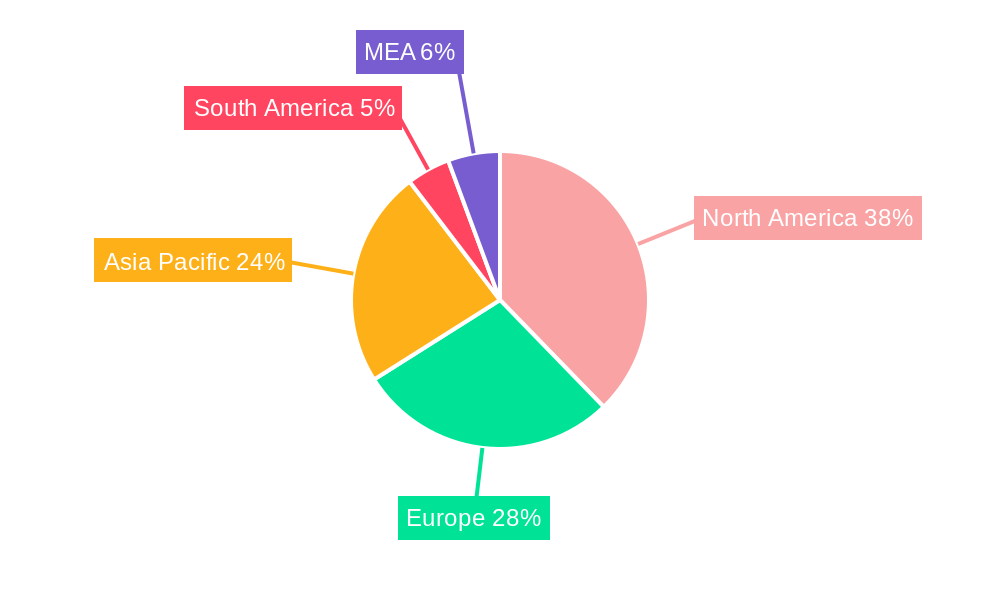
The market segmentation reveals substantial opportunities. Product catalogs currently dominate the "By Type" segment, reflecting the significant demand for efficient product information management in e-commerce. However, the service catalog segment is projected to witness rapid growth, driven by businesses seeking to improve the management of internal services and streamline IT operations. Geographically, North America currently holds the largest market share, owing to early adoption of CMS solutions and the presence of major technology companies. However, the Asia-Pacific region is poised for significant growth, driven by rapid e-commerce expansion and increasing digitalization across various sectors. The "By Deployment Type" segment shows a strong preference for cloud-based solutions due to their flexibility and cost advantages. The top players in the market, including Broadcom, IBM, and SAP, are continuously innovating to stay ahead of the competition, driving further market expansion through enhanced features and integrations.
Catalog Management System Industry Company Market Share
Catalog Management System Industry Market Report: 2019-2033
This comprehensive report provides an in-depth analysis of the Catalog Management System (CMS) industry, encompassing market dynamics, growth trends, regional dominance, product landscape, challenges, opportunities, and key players. The report covers the period from 2019 to 2033, with 2025 as the base and estimated year. The parent market is Enterprise Resource Planning (ERP) Software, and the child market is specifically Catalog Management Systems. Market values are presented in million units.
Catalog Management System Industry Market Dynamics & Structure
The Catalog Management System market, valued at xx million in 2025, exhibits a moderately consolidated structure. Key players, including Broadcom Corporation, IBM Corporation, and SAP SE, hold significant market share, but a number of smaller, specialized vendors are also active, leading to a dynamic competitive landscape. Technological innovation, particularly in AI-powered catalog optimization and automation, is a key driver, while regulatory compliance (e.g., data privacy regulations) poses a significant challenge. The market is witnessing increased M&A activity, with xx deals recorded in 2024. Product substitutes include manual catalog management processes and less sophisticated e-commerce platforms, although the increasing need for efficiency and scalability is driving CMS adoption. End-user demographics are broad, ranging from small businesses to large enterprises across various industry verticals.
- Market Concentration: Moderately consolidated, with top 5 players holding approximately xx% market share in 2025.
- Technological Innovation Drivers: AI-powered catalog optimization, automated catalog updates, integration with ERP systems.
- Regulatory Frameworks: GDPR, CCPA, and other data privacy regulations significantly impact CMS development and deployment.
- Competitive Product Substitutes: Manual catalog management, basic e-commerce platforms.
- End-User Demographics: Diverse, spanning SMEs and large enterprises across multiple industries.
- M&A Trends: xx M&A deals recorded in 2024, indicating consolidation and strategic expansion.
Catalog Management System Industry Growth Trends & Insights
The CMS market experienced significant growth during the historical period (2019-2024), driven by factors including the increasing adoption of e-commerce, the need for improved operational efficiency, and the rise of omnichannel commerce. The market size expanded from xx million in 2019 to xx million in 2024, registering a CAGR of xx%. This growth is expected to continue during the forecast period (2025-2033), with a projected CAGR of xx%, reaching xx million by 2033. This is largely attributed to the rising demand for cloud-based CMS solutions and the increasing penetration of e-commerce across various industries. Technological disruptions such as the integration of AI and machine learning for intelligent catalog management are further accelerating market growth. Shifts in consumer behavior towards personalized shopping experiences are also creating substantial opportunities. Market penetration increased from xx% in 2019 to xx% in 2024 and is projected to reach xx% by 2033.
Dominant Regions, Countries, or Segments in Catalog Management System Industry
North America currently dominates the global CMS market, driven by high e-commerce adoption rates, robust technological infrastructure, and the presence of major CMS vendors. The region holds an estimated xx% market share in 2025. Within segments, the Cloud deployment type is experiencing the fastest growth, projected at a CAGR of xx% during 2025-2033. The Retail and E-commerce industry vertical remains the largest segment, driven by intense competition and the need for efficient product catalog management.
Key Drivers (North America): Strong e-commerce infrastructure, high technological adoption rates, presence of major vendors.
Key Drivers (Cloud Deployment): Cost-effectiveness, scalability, ease of deployment.
Key Drivers (Retail and E-commerce): Intense competition, need for efficient product catalog management, omnichannel strategies.
Market Share (2025): North America (xx%), Europe (xx%), Asia Pacific (xx%), Rest of World (xx%).
Growth Potential: Cloud Deployment (highest), followed by Retail and E-commerce vertical.
Catalog Management System Industry Product Landscape
CMS solutions are evolving rapidly, incorporating features such as AI-powered catalog optimization, automated updates, advanced search capabilities, and seamless integration with ERP and CRM systems. Products are differentiated by features, pricing models, deployment options (cloud vs. on-premises), and industry-specific functionalities. Unique selling propositions often center around ease of use, scalability, data analytics, and integration capabilities.
Key Drivers, Barriers & Challenges in Catalog Management System Industry
Key Drivers: Increasing e-commerce adoption, need for efficient catalog management, rising demand for omnichannel capabilities, technological advancements like AI and ML. The expanding global e-commerce market is a significant driver, demanding efficient catalog management to handle increased product volumes and complexities.
Key Challenges: High initial investment costs, complexity of integration with existing systems, data security concerns, and the need for ongoing maintenance and updates. Competitor pricing pressures and the ongoing need for feature updates also pose significant hurdles.
Emerging Opportunities in Catalog Management System Industry
Untapped markets in developing economies with growing e-commerce sectors present significant growth opportunities. The integration of augmented reality/virtual reality (AR/VR) into catalog experiences offers an innovative avenue for engagement. Personalized product recommendations and AI-driven catalog optimization are emerging as key features driving future growth.
Growth Accelerators in the Catalog Management System Industry
Technological breakthroughs in AI/ML, strategic partnerships to expand market reach, and the development of industry-specific solutions will significantly accelerate market growth. Cloud-based solutions, which deliver scalability and reduced infrastructure costs, are particularly important. Expansion into new geographical markets also offers strong potential for growth.
Key Players Shaping the Catalog Management System Industry Market
Notable Milestones in Catalog Management System Industry Sector
- 2020: Increased adoption of cloud-based CMS solutions due to the pandemic-induced shift to remote work.
- 2021: Significant investments in AI and ML technologies to enhance catalog optimization and personalization.
- 2022: Several key mergers and acquisitions consolidate the market landscape.
- 2023: Launch of new CMS solutions with enhanced integrations and advanced analytics capabilities.
- 2024: Increased focus on improving user experience and mobile accessibility for catalog browsing.
In-Depth Catalog Management System Industry Market Outlook
The CMS market is poised for continued growth, driven by ongoing technological advancements, expanding e-commerce adoption, and the increasing demand for omnichannel capabilities. Strategic partnerships, expansion into new geographic markets, and the development of innovative features will be key to unlocking future market potential. The focus on AI-powered solutions and enhanced data analytics will further propel market expansion.
Catalog Management System Industry Segmentation
-
1. Type
- 1.1. Service Catalogs
- 1.2. Product Catalogs
-
2. Deployment Type
- 2.1. Cloud
- 2.2. On-Premises
-
3. Industry Vertical
- 3.1. IT and Telecom
- 3.2. Retail and E-commerce
- 3.3. BFSI
- 3.4. Media and Entertainment
- 3.5. Travel and Hospitality
- 3.6. Other Industry Verticals
Catalog Management System Industry Segmentation By Geography
- 1. North America
- 2. Europe
- 3. Asia
- 4. Australia and New Zealand
- 5. Latin America
- 6. Middle East and Africa
Catalog Management System Industry Regional Market Share
Geographic Coverage of Catalog Management System Industry
Catalog Management System Industry REPORT HIGHLIGHTS
| Aspects | Details |
|---|---|
| Study Period | 2020-2034 |
| Base Year | 2025 |
| Estimated Year | 2026 |
| Forecast Period | 2026-2034 |
| Historical Period | 2020-2025 |
| Growth Rate | CAGR of 9.68% from 2020-2034 |
| Segmentation |
|
Table of Contents
- 1. Introduction
- 1.1. Research Scope
- 1.2. Market Segmentation
- 1.3. Research Objective
- 1.4. Definitions and Assumptions
- 2. Executive Summary
- 2.1. Market Snapshot
- 3. Market Dynamics
- 3.1. Market Drivers
- 3.2. Market Restrains
- 3.3. Market Trends
- 3.4. Market Opportunities
- 4. Market Factor Analysis
- 4.1. Porters Five Forces
- 4.1.1. Bargaining Power of Suppliers
- 4.1.2. Bargaining Power of Buyers
- 4.1.3. Threat of New Entrants
- 4.1.4. Threat of Substitutes
- 4.1.5. Competitive Rivalry
- 4.2. PESTEL analysis
- 4.3. BCG Analysis
- 4.3.1. Stars (High Growth, High Market Share)
- 4.3.2. Cash Cows (Low Growth, High Market Share)
- 4.3.3. Question Mark (High Growth, Low Market Share)
- 4.3.4. Dogs (Low Growth, Low Market Share)
- 4.4. Ansoff Matrix Analysis
- 4.5. Supply Chain Analysis
- 4.6. Regulatory Landscape
- 4.7. Current Market Potential and Opportunity Assessment (TAM–SAM–SOM Framework)
- 4.8. NRP Analyst Note
- 4.1. Porters Five Forces
- 5. Market Analysis, Insights and Forecast 2021-2033
- 5.1. Market Analysis, Insights and Forecast - by Type
- 5.1.1. Service Catalogs
- 5.1.2. Product Catalogs
- 5.2. Market Analysis, Insights and Forecast - by Deployment Type
- 5.2.1. Cloud
- 5.2.2. On-Premises
- 5.3. Market Analysis, Insights and Forecast - by Industry Vertical
- 5.3.1. IT and Telecom
- 5.3.2. Retail and E-commerce
- 5.3.3. BFSI
- 5.3.4. Media and Entertainment
- 5.3.5. Travel and Hospitality
- 5.3.6. Other Industry Verticals
- 5.4. Market Analysis, Insights and Forecast - by Region
- 5.4.1. North America
- 5.4.2. Europe
- 5.4.3. Asia
- 5.4.4. Australia and New Zealand
- 5.4.5. Latin America
- 5.4.6. Middle East and Africa
- 5.1. Market Analysis, Insights and Forecast - by Type
- 6. Global Catalog Management System Industry Analysis, Insights and Forecast, 2021-2033
- 6.1. Market Analysis, Insights and Forecast - by Type
- 6.1.1. Service Catalogs
- 6.1.2. Product Catalogs
- 6.2. Market Analysis, Insights and Forecast - by Deployment Type
- 6.2.1. Cloud
- 6.2.2. On-Premises
- 6.3. Market Analysis, Insights and Forecast - by Industry Vertical
- 6.3.1. IT and Telecom
- 6.3.2. Retail and E-commerce
- 6.3.3. BFSI
- 6.3.4. Media and Entertainment
- 6.3.5. Travel and Hospitality
- 6.3.6. Other Industry Verticals
- 6.1. Market Analysis, Insights and Forecast - by Type
- 7. North America Catalog Management System Industry Analysis, Insights and Forecast, 2020-2032
- 7.1. Market Analysis, Insights and Forecast - by Type
- 7.1.1. Service Catalogs
- 7.1.2. Product Catalogs
- 7.2. Market Analysis, Insights and Forecast - by Deployment Type
- 7.2.1. Cloud
- 7.2.2. On-Premises
- 7.3. Market Analysis, Insights and Forecast - by Industry Vertical
- 7.3.1. IT and Telecom
- 7.3.2. Retail and E-commerce
- 7.3.3. BFSI
- 7.3.4. Media and Entertainment
- 7.3.5. Travel and Hospitality
- 7.3.6. Other Industry Verticals
- 7.1. Market Analysis, Insights and Forecast - by Type
- 8. Europe Catalog Management System Industry Analysis, Insights and Forecast, 2020-2032
- 8.1. Market Analysis, Insights and Forecast - by Type
- 8.1.1. Service Catalogs
- 8.1.2. Product Catalogs
- 8.2. Market Analysis, Insights and Forecast - by Deployment Type
- 8.2.1. Cloud
- 8.2.2. On-Premises
- 8.3. Market Analysis, Insights and Forecast - by Industry Vertical
- 8.3.1. IT and Telecom
- 8.3.2. Retail and E-commerce
- 8.3.3. BFSI
- 8.3.4. Media and Entertainment
- 8.3.5. Travel and Hospitality
- 8.3.6. Other Industry Verticals
- 8.1. Market Analysis, Insights and Forecast - by Type
- 9. Asia Catalog Management System Industry Analysis, Insights and Forecast, 2020-2032
- 9.1. Market Analysis, Insights and Forecast - by Type
- 9.1.1. Service Catalogs
- 9.1.2. Product Catalogs
- 9.2. Market Analysis, Insights and Forecast - by Deployment Type
- 9.2.1. Cloud
- 9.2.2. On-Premises
- 9.3. Market Analysis, Insights and Forecast - by Industry Vertical
- 9.3.1. IT and Telecom
- 9.3.2. Retail and E-commerce
- 9.3.3. BFSI
- 9.3.4. Media and Entertainment
- 9.3.5. Travel and Hospitality
- 9.3.6. Other Industry Verticals
- 9.1. Market Analysis, Insights and Forecast - by Type
- 10. Australia and New Zealand Catalog Management System Industry Analysis, Insights and Forecast, 2020-2032
- 10.1. Market Analysis, Insights and Forecast - by Type
- 10.1.1. Service Catalogs
- 10.1.2. Product Catalogs
- 10.2. Market Analysis, Insights and Forecast - by Deployment Type
- 10.2.1. Cloud
- 10.2.2. On-Premises
- 10.3. Market Analysis, Insights and Forecast - by Industry Vertical
- 10.3.1. IT and Telecom
- 10.3.2. Retail and E-commerce
- 10.3.3. BFSI
- 10.3.4. Media and Entertainment
- 10.3.5. Travel and Hospitality
- 10.3.6. Other Industry Verticals
- 10.1. Market Analysis, Insights and Forecast - by Type
- 11. Latin America Catalog Management System Industry Analysis, Insights and Forecast, 2020-2032
- 11.1. Market Analysis, Insights and Forecast - by Type
- 11.1.1. Service Catalogs
- 11.1.2. Product Catalogs
- 11.2. Market Analysis, Insights and Forecast - by Deployment Type
- 11.2.1. Cloud
- 11.2.2. On-Premises
- 11.3. Market Analysis, Insights and Forecast - by Industry Vertical
- 11.3.1. IT and Telecom
- 11.3.2. Retail and E-commerce
- 11.3.3. BFSI
- 11.3.4. Media and Entertainment
- 11.3.5. Travel and Hospitality
- 11.3.6. Other Industry Verticals
- 11.1. Market Analysis, Insights and Forecast - by Type
- 12. Middle East and Africa Catalog Management System Industry Analysis, Insights and Forecast, 2020-2032
- 12.1. Market Analysis, Insights and Forecast - by Type
- 12.1.1. Service Catalogs
- 12.1.2. Product Catalogs
- 12.2. Market Analysis, Insights and Forecast - by Deployment Type
- 12.2.1. Cloud
- 12.2.2. On-Premises
- 12.3. Market Analysis, Insights and Forecast - by Industry Vertical
- 12.3.1. IT and Telecom
- 12.3.2. Retail and E-commerce
- 12.3.3. BFSI
- 12.3.4. Media and Entertainment
- 12.3.5. Travel and Hospitality
- 12.3.6. Other Industry Verticals
- 12.1. Market Analysis, Insights and Forecast - by Type
- 13. Competitive Analysis
- 13.1. Company Profiles
- 13.1.1 Broadcom Corporation
- 13.1.1.1. Company Overview
- 13.1.1.2. Products
- 13.1.1.3. Company Financials
- 13.1.1.4. SWOT Analysis
- 13.1.2 Vroozi Inc
- 13.1.2.1. Company Overview
- 13.1.2.2. Products
- 13.1.2.3. Company Financials
- 13.1.2.4. SWOT Analysis
- 13.1.3 Insite Software Solutions Inc
- 13.1.3.1. Company Overview
- 13.1.3.2. Products
- 13.1.3.3. Company Financials
- 13.1.3.4. SWOT Analysis
- 13.1.4 IBM Corporation
- 13.1.4.1. Company Overview
- 13.1.4.2. Products
- 13.1.4.3. Company Financials
- 13.1.4.4. SWOT Analysis
- 13.1.5 Telefonaktiebolaget LM Ericsson
- 13.1.5.1. Company Overview
- 13.1.5.2. Products
- 13.1.5.3. Company Financials
- 13.1.5.4. SWOT Analysis
- 13.1.6 Coupa Software Inc
- 13.1.6.1. Company Overview
- 13.1.6.2. Products
- 13.1.6.3. Company Financials
- 13.1.6.4. SWOT Analysis
- 13.1.7 GEP Worldwide
- 13.1.7.1. Company Overview
- 13.1.7.2. Products
- 13.1.7.3. Company Financials
- 13.1.7.4. SWOT Analysis
- 13.1.8 Amdocs
- 13.1.8.1. Company Overview
- 13.1.8.2. Products
- 13.1.8.3. Company Financials
- 13.1.8.4. SWOT Analysis
- 13.1.9 Fujitsu Limited
- 13.1.9.1. Company Overview
- 13.1.9.2. Products
- 13.1.9.3. Company Financials
- 13.1.9.4. SWOT Analysis
- 13.1.10 Zycus Inc
- 13.1.10.1. Company Overview
- 13.1.10.2. Products
- 13.1.10.3. Company Financials
- 13.1.10.4. SWOT Analysis
- 13.1.11 Sellercloud Inc
- 13.1.11.1. Company Overview
- 13.1.11.2. Products
- 13.1.11.3. Company Financials
- 13.1.11.4. SWOT Analysis
- 13.1.12 ServiceNow Inc
- 13.1.12.1. Company Overview
- 13.1.12.2. Products
- 13.1.12.3. Company Financials
- 13.1.12.4. SWOT Analysis
- 13.1.13 Salsify Inc
- 13.1.13.1. Company Overview
- 13.1.13.2. Products
- 13.1.13.3. Company Financials
- 13.1.13.4. SWOT Analysis
- 13.1.14 Oracle Corporation
- 13.1.14.1. Company Overview
- 13.1.14.2. Products
- 13.1.14.3. Company Financials
- 13.1.14.4. SWOT Analysis
- 13.1.15 Comarch SA
- 13.1.15.1. Company Overview
- 13.1.15.2. Products
- 13.1.15.3. Company Financials
- 13.1.15.4. SWOT Analysis
- 13.1.16 Plytix com Ap
- 13.1.16.1. Company Overview
- 13.1.16.2. Products
- 13.1.16.3. Company Financials
- 13.1.16.4. SWOT Analysis
- 13.1.17 Proactis Holdings Plc
- 13.1.17.1. Company Overview
- 13.1.17.2. Products
- 13.1.17.3. Company Financials
- 13.1.17.4. SWOT Analysis
- 13.1.18 SAP SE
- 13.1.18.1. Company Overview
- 13.1.18.2. Products
- 13.1.18.3. Company Financials
- 13.1.18.4. SWOT Analysis
- 13.1.1 Broadcom Corporation
- 13.2. Market Entropy
- 13.2.1 Company's Key Areas Served
- 13.2.2 Recent Developments
- 13.3. Company Market Share Analysis 2025
- 13.3.1 Top 5 Companies Market Share Analysis
- 13.3.2 Top 3 Companies Market Share Analysis
- 13.4. List of Potential Customers
- 14. Research Methodology
List of Figures
- Figure 1: Global Catalog Management System Industry Revenue Breakdown (Million, %) by Region 2025 & 2033
- Figure 2: North America Catalog Management System Industry Revenue (Million), by Type 2025 & 2033
- Figure 3: North America Catalog Management System Industry Revenue Share (%), by Type 2025 & 2033
- Figure 4: North America Catalog Management System Industry Revenue (Million), by Deployment Type 2025 & 2033
- Figure 5: North America Catalog Management System Industry Revenue Share (%), by Deployment Type 2025 & 2033
- Figure 6: North America Catalog Management System Industry Revenue (Million), by Industry Vertical 2025 & 2033
- Figure 7: North America Catalog Management System Industry Revenue Share (%), by Industry Vertical 2025 & 2033
- Figure 8: North America Catalog Management System Industry Revenue (Million), by Country 2025 & 2033
- Figure 9: North America Catalog Management System Industry Revenue Share (%), by Country 2025 & 2033
- Figure 10: Europe Catalog Management System Industry Revenue (Million), by Type 2025 & 2033
- Figure 11: Europe Catalog Management System Industry Revenue Share (%), by Type 2025 & 2033
- Figure 12: Europe Catalog Management System Industry Revenue (Million), by Deployment Type 2025 & 2033
- Figure 13: Europe Catalog Management System Industry Revenue Share (%), by Deployment Type 2025 & 2033
- Figure 14: Europe Catalog Management System Industry Revenue (Million), by Industry Vertical 2025 & 2033
- Figure 15: Europe Catalog Management System Industry Revenue Share (%), by Industry Vertical 2025 & 2033
- Figure 16: Europe Catalog Management System Industry Revenue (Million), by Country 2025 & 2033
- Figure 17: Europe Catalog Management System Industry Revenue Share (%), by Country 2025 & 2033
- Figure 18: Asia Catalog Management System Industry Revenue (Million), by Type 2025 & 2033
- Figure 19: Asia Catalog Management System Industry Revenue Share (%), by Type 2025 & 2033
- Figure 20: Asia Catalog Management System Industry Revenue (Million), by Deployment Type 2025 & 2033
- Figure 21: Asia Catalog Management System Industry Revenue Share (%), by Deployment Type 2025 & 2033
- Figure 22: Asia Catalog Management System Industry Revenue (Million), by Industry Vertical 2025 & 2033
- Figure 23: Asia Catalog Management System Industry Revenue Share (%), by Industry Vertical 2025 & 2033
- Figure 24: Asia Catalog Management System Industry Revenue (Million), by Country 2025 & 2033
- Figure 25: Asia Catalog Management System Industry Revenue Share (%), by Country 2025 & 2033
- Figure 26: Australia and New Zealand Catalog Management System Industry Revenue (Million), by Type 2025 & 2033
- Figure 27: Australia and New Zealand Catalog Management System Industry Revenue Share (%), by Type 2025 & 2033
- Figure 28: Australia and New Zealand Catalog Management System Industry Revenue (Million), by Deployment Type 2025 & 2033
- Figure 29: Australia and New Zealand Catalog Management System Industry Revenue Share (%), by Deployment Type 2025 & 2033
- Figure 30: Australia and New Zealand Catalog Management System Industry Revenue (Million), by Industry Vertical 2025 & 2033
- Figure 31: Australia and New Zealand Catalog Management System Industry Revenue Share (%), by Industry Vertical 2025 & 2033
- Figure 32: Australia and New Zealand Catalog Management System Industry Revenue (Million), by Country 2025 & 2033
- Figure 33: Australia and New Zealand Catalog Management System Industry Revenue Share (%), by Country 2025 & 2033
- Figure 34: Latin America Catalog Management System Industry Revenue (Million), by Type 2025 & 2033
- Figure 35: Latin America Catalog Management System Industry Revenue Share (%), by Type 2025 & 2033
- Figure 36: Latin America Catalog Management System Industry Revenue (Million), by Deployment Type 2025 & 2033
- Figure 37: Latin America Catalog Management System Industry Revenue Share (%), by Deployment Type 2025 & 2033
- Figure 38: Latin America Catalog Management System Industry Revenue (Million), by Industry Vertical 2025 & 2033
- Figure 39: Latin America Catalog Management System Industry Revenue Share (%), by Industry Vertical 2025 & 2033
- Figure 40: Latin America Catalog Management System Industry Revenue (Million), by Country 2025 & 2033
- Figure 41: Latin America Catalog Management System Industry Revenue Share (%), by Country 2025 & 2033
- Figure 42: Middle East and Africa Catalog Management System Industry Revenue (Million), by Type 2025 & 2033
- Figure 43: Middle East and Africa Catalog Management System Industry Revenue Share (%), by Type 2025 & 2033
- Figure 44: Middle East and Africa Catalog Management System Industry Revenue (Million), by Deployment Type 2025 & 2033
- Figure 45: Middle East and Africa Catalog Management System Industry Revenue Share (%), by Deployment Type 2025 & 2033
- Figure 46: Middle East and Africa Catalog Management System Industry Revenue (Million), by Industry Vertical 2025 & 2033
- Figure 47: Middle East and Africa Catalog Management System Industry Revenue Share (%), by Industry Vertical 2025 & 2033
- Figure 48: Middle East and Africa Catalog Management System Industry Revenue (Million), by Country 2025 & 2033
- Figure 49: Middle East and Africa Catalog Management System Industry Revenue Share (%), by Country 2025 & 2033
List of Tables
- Table 1: Global Catalog Management System Industry Revenue Million Forecast, by Type 2020 & 2033
- Table 2: Global Catalog Management System Industry Revenue Million Forecast, by Deployment Type 2020 & 2033
- Table 3: Global Catalog Management System Industry Revenue Million Forecast, by Industry Vertical 2020 & 2033
- Table 4: Global Catalog Management System Industry Revenue Million Forecast, by Region 2020 & 2033
- Table 5: Global Catalog Management System Industry Revenue Million Forecast, by Type 2020 & 2033
- Table 6: Global Catalog Management System Industry Revenue Million Forecast, by Deployment Type 2020 & 2033
- Table 7: Global Catalog Management System Industry Revenue Million Forecast, by Industry Vertical 2020 & 2033
- Table 8: Global Catalog Management System Industry Revenue Million Forecast, by Country 2020 & 2033
- Table 9: Global Catalog Management System Industry Revenue Million Forecast, by Type 2020 & 2033
- Table 10: Global Catalog Management System Industry Revenue Million Forecast, by Deployment Type 2020 & 2033
- Table 11: Global Catalog Management System Industry Revenue Million Forecast, by Industry Vertical 2020 & 2033
- Table 12: Global Catalog Management System Industry Revenue Million Forecast, by Country 2020 & 2033
- Table 13: Global Catalog Management System Industry Revenue Million Forecast, by Type 2020 & 2033
- Table 14: Global Catalog Management System Industry Revenue Million Forecast, by Deployment Type 2020 & 2033
- Table 15: Global Catalog Management System Industry Revenue Million Forecast, by Industry Vertical 2020 & 2033
- Table 16: Global Catalog Management System Industry Revenue Million Forecast, by Country 2020 & 2033
- Table 17: Global Catalog Management System Industry Revenue Million Forecast, by Type 2020 & 2033
- Table 18: Global Catalog Management System Industry Revenue Million Forecast, by Deployment Type 2020 & 2033
- Table 19: Global Catalog Management System Industry Revenue Million Forecast, by Industry Vertical 2020 & 2033
- Table 20: Global Catalog Management System Industry Revenue Million Forecast, by Country 2020 & 2033
- Table 21: Global Catalog Management System Industry Revenue Million Forecast, by Type 2020 & 2033
- Table 22: Global Catalog Management System Industry Revenue Million Forecast, by Deployment Type 2020 & 2033
- Table 23: Global Catalog Management System Industry Revenue Million Forecast, by Industry Vertical 2020 & 2033
- Table 24: Global Catalog Management System Industry Revenue Million Forecast, by Country 2020 & 2033
- Table 25: Global Catalog Management System Industry Revenue Million Forecast, by Type 2020 & 2033
- Table 26: Global Catalog Management System Industry Revenue Million Forecast, by Deployment Type 2020 & 2033
- Table 27: Global Catalog Management System Industry Revenue Million Forecast, by Industry Vertical 2020 & 2033
- Table 28: Global Catalog Management System Industry Revenue Million Forecast, by Country 2020 & 2033
Frequently Asked Questions
1. What is the projected Compound Annual Growth Rate (CAGR) of the Catalog Management System Industry?
The projected CAGR is approximately 9.68%.
2. Which companies are prominent players in the Catalog Management System Industry?
Key companies in the market include Broadcom Corporation, Vroozi Inc, Insite Software Solutions Inc, IBM Corporation, Telefonaktiebolaget LM Ericsson, Coupa Software Inc, GEP Worldwide, Amdocs, Fujitsu Limited, Zycus Inc, Sellercloud Inc, ServiceNow Inc, Salsify Inc, Oracle Corporation, Comarch SA, Plytix com Ap, Proactis Holdings Plc, SAP SE.
3. What are the main segments of the Catalog Management System Industry?
The market segments include Type, Deployment Type, Industry Vertical.
4. Can you provide details about the market size?
The market size is estimated to be USD 1.96 Million as of 2022.
5. What are some drivers contributing to market growth?
Growing Digital Transformation Initiatives; Necessity of Centralized Systems for Improved Marketing and Selling.
6. What are the notable trends driving market growth?
Growing Digital Transformation Initiatives Drives the Market.
7. Are there any restraints impacting market growth?
Privacy and Security Concerns.
8. Can you provide examples of recent developments in the market?
N/A
9. What pricing options are available for accessing the report?
Pricing options include single-user, multi-user, and enterprise licenses priced at USD 4750, USD 5250, and USD 8750 respectively.
10. Is the market size provided in terms of value or volume?
The market size is provided in terms of value, measured in Million.
11. Are there any specific market keywords associated with the report?
Yes, the market keyword associated with the report is "Catalog Management System Industry," which aids in identifying and referencing the specific market segment covered.
12. How do I determine which pricing option suits my needs best?
The pricing options vary based on user requirements and access needs. Individual users may opt for single-user licenses, while businesses requiring broader access may choose multi-user or enterprise licenses for cost-effective access to the report.
13. Are there any additional resources or data provided in the Catalog Management System Industry report?
While the report offers comprehensive insights, it's advisable to review the specific contents or supplementary materials provided to ascertain if additional resources or data are available.
14. How can I stay updated on further developments or reports in the Catalog Management System Industry?
To stay informed about further developments, trends, and reports in the Catalog Management System Industry, consider subscribing to industry newsletters, following relevant companies and organizations, or regularly checking reputable industry news sources and publications.
Methodology
Step 1 - Identification of Relevant Samples Size from Population Database


Step 2 - Approaches for Defining Global Market Size (Value, Volume* & Price*)

Note*: In applicable scenarios
Step 3 - Data Sources
Primary Research
- Web Analytics
- Survey Reports
- Research Institute
- Latest Research Reports
- Opinion Leaders
Secondary Research
- Annual Reports
- White Paper
- Latest Press Release
- Industry Association
- Paid Database
- Investor Presentations

Step 4 - Data Triangulation
Involves using different sources of information in order to increase the validity of a study
These sources are likely to be stakeholders in a program - participants, other researchers, program staff, other community members, and so on.
Then we put all data in single framework & apply various statistical tools to find out the dynamic on the market.
During the analysis stage, feedback from the stakeholder groups would be compared to determine areas of agreement as well as areas of divergence