

Key Insights
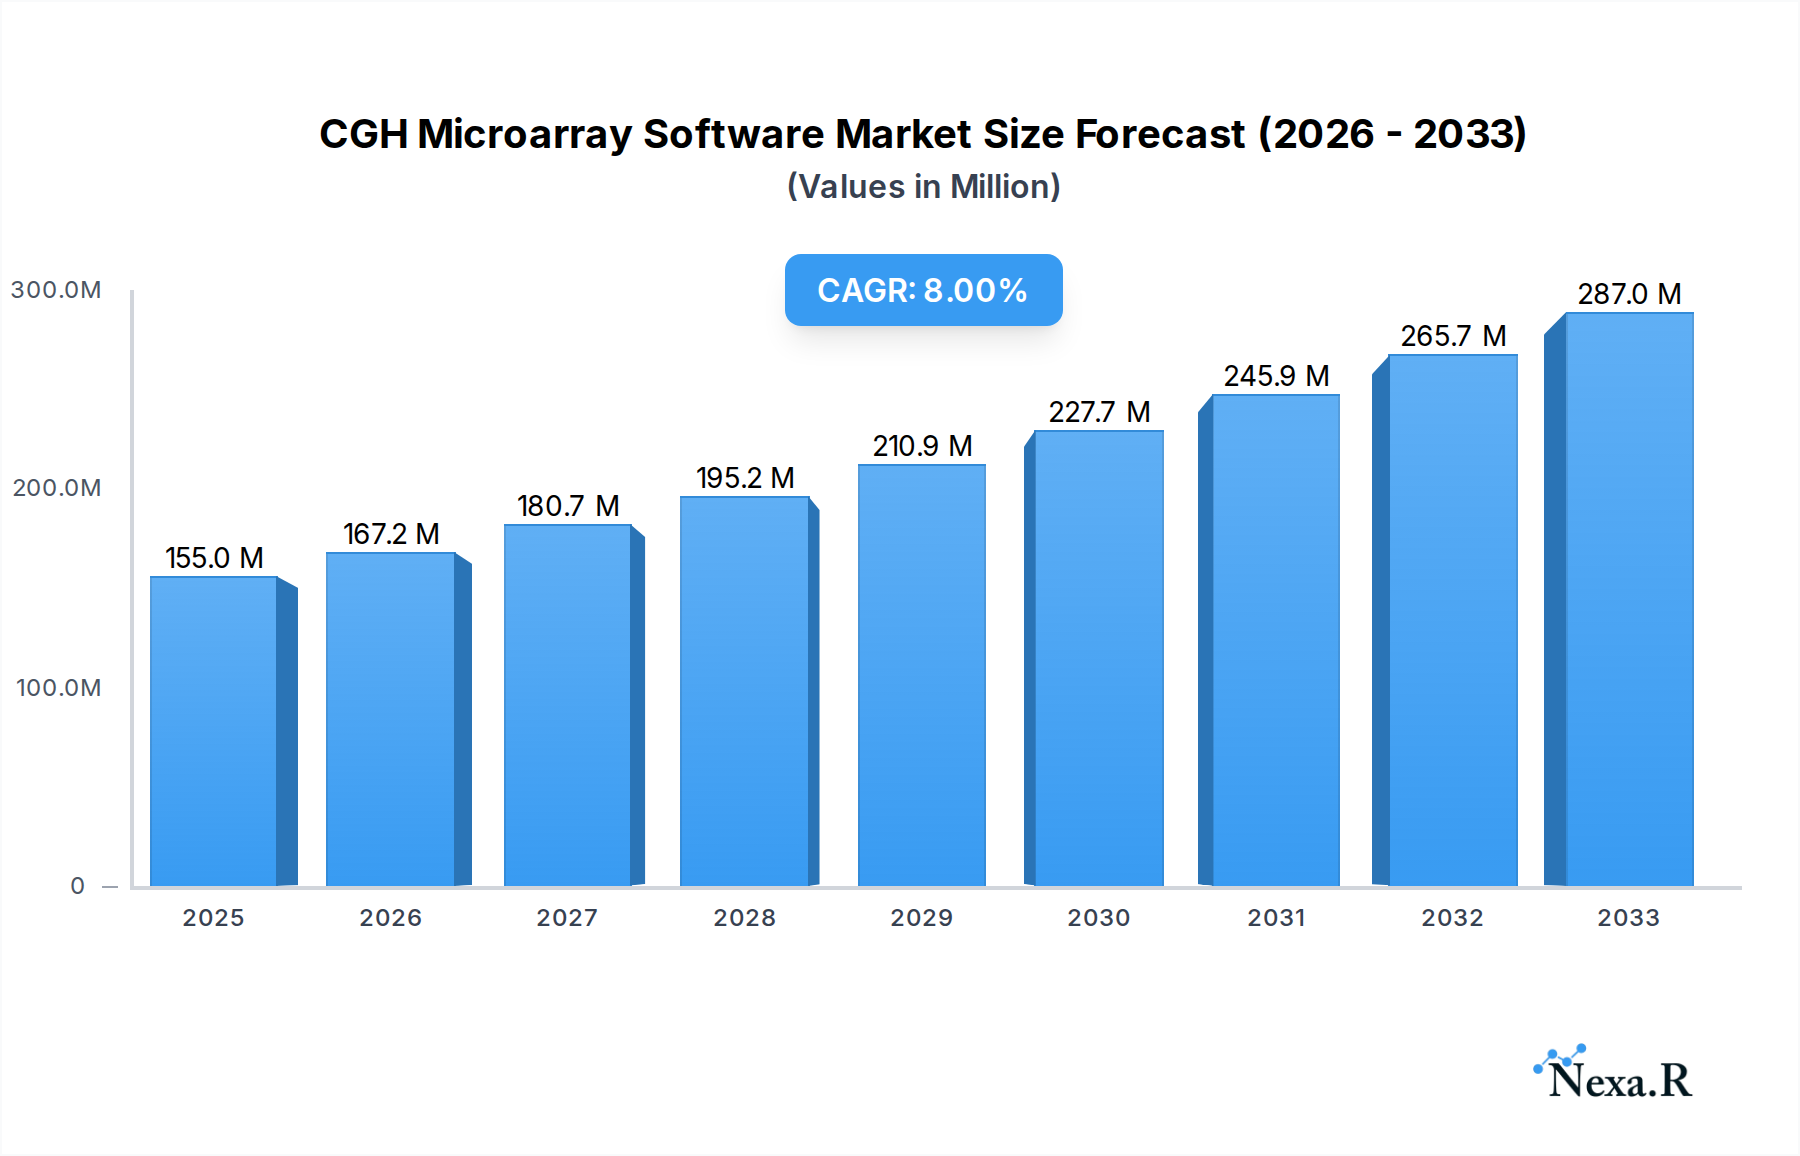
The global CGH Microarray Software market is projected to experience robust growth, reaching an estimated $155 million by 2025 and expanding at a compound annual growth rate (CAGR) of 8.7% through 2033. This expansion is primarily fueled by the increasing adoption of genomic technologies in diagnostics and research, particularly in identifying chromosomal abnormalities. Hospitals and health systems are emerging as key consumers, leveraging these advanced software solutions for more accurate and efficient analysis of comparative genomic hybridization (CGH) data. The growing complexity of genomic data generated by microarrays necessitates sophisticated software for interpretation, driving demand for web-based and cloud-based platforms that offer scalability, accessibility, and enhanced analytical capabilities. Furthermore, the rising prevalence of genetic disorders and the expanding applications of CGH in areas like oncology, developmental disorders, and reproductive health are significant growth drivers. Key industry players are investing in R&D to develop more intuitive and powerful software that can handle vast datasets and integrate seamlessly with existing laboratory workflows, further bolstering market expansion.

CGH Microarray Software Market Size (In Million)
While the market shows strong growth potential, certain factors may influence its trajectory. High implementation costs associated with advanced CGH microarray software and the need for specialized bioinformatics expertise can present adoption challenges, particularly for smaller research organizations or healthcare facilities. However, the clear benefits of improved diagnostic accuracy, faster turnaround times, and the potential for personalized medicine are expected to outweigh these restraints. The continuous evolution of microarray technology, coupled with advancements in computational biology and artificial intelligence, will likely lead to more integrated and user-friendly software solutions. Geographically, North America and Europe are anticipated to lead the market due to established healthcare infrastructure and significant investment in genomic research. Asia Pacific, with its rapidly growing healthcare sector and increasing focus on precision medicine, presents a substantial growth opportunity for CGH microarray software providers in the coming years.
CGH Microarray Software Company Market Share
CGH Microarray Software Market: Comprehensive Analysis & Future Outlook (2019-2033)
This in-depth report provides a definitive analysis of the global CGH Microarray Software market, offering critical insights for stakeholders in genomic research, diagnostics, and healthcare. Covering the period from 2019 to 2033, with a base and estimated year of 2025, this study delves into market dynamics, growth trends, regional dominance, product landscape, key drivers, barriers, opportunities, and the competitive arena. Understand the evolving needs of Hospitals and Health Systems, Research Organizations, and other critical segments, and navigate the landscape of Web-based and Cloud-based solutions.
CGH Microarray Software Market Dynamics & Structure
The CGH Microarray Software market is characterized by a moderately consolidated structure, driven by a strong emphasis on technological innovation and the increasing adoption of genomic technologies in clinical diagnostics and research. Key drivers include advancements in high-throughput sequencing, the growing demand for personalized medicine, and the expanding applications of Comparative Genomic Hybridization (CGH) in identifying genetic variations associated with various diseases. Regulatory frameworks, particularly those governing medical devices and diagnostic software, play a crucial role in shaping market entry and product development. Competitive product substitutes, such as Next-Generation Sequencing (NGS) data analysis platforms, present an ongoing challenge, necessitating continuous innovation in CGH software to maintain market relevance. End-user demographics are shifting towards a greater demand for user-friendly, cloud-based solutions capable of handling large genomic datasets efficiently. Merger and acquisition (M&A) activities are anticipated to increase as established players seek to expand their product portfolios and market reach, and smaller innovators aim for broader adoption.
- Market Concentration: Moderately consolidated with key players holding significant shares.
- Technological Innovation Drivers: Advancements in bioinformatics, AI in genomics, and cloud computing.
- Regulatory Frameworks: FDA, CE marking, and other regional regulatory approvals are critical.
- Competitive Product Substitutes: Growing competition from NGS analysis tools.
- End-User Demographics: Increasing demand from clinical diagnostic labs and large research institutions.
- M&A Trends: Expected to see increased consolidation for portfolio expansion and technology acquisition.
CGH Microarray Software Growth Trends & Insights
The CGH Microarray Software market is poised for robust growth, projected to expand significantly over the forecast period. The estimated market size in 2025 stands at approximately $550 million, with a projected Compound Annual Growth Rate (CAGR) of XX% from 2025 to 2033. This expansion is underpinned by a confluence of factors, including the escalating prevalence of genetic disorders, the increasing utility of CGH in prenatal screening, cancer diagnostics, and rare disease identification, and the growing adoption of cloud-based solutions for scalable data analysis. Technological disruptions, such as the integration of artificial intelligence and machine learning algorithms for automated variant interpretation and report generation, are poised to revolutionize the market. Furthermore, evolving consumer behavior, characterized by a greater awareness of genetic predispositions and a demand for more personalized healthcare, is directly fueling the need for advanced CGH analysis tools. The historical data from 2019-2024 shows a steady upward trajectory, driven by early research applications and increasing clinical validation of CGH technology. The market penetration of advanced CGH microarray software is expected to deepen within both research and clinical settings, moving beyond specialized labs to broader hospital integration. Adoption rates are predicted to accelerate as software becomes more intuitive, cost-effective, and capable of seamless integration with existing laboratory information systems (LIS). The shift towards cloud-based platforms will further democratize access to sophisticated CGH analysis, enabling smaller institutions and researchers to leverage powerful computational resources without significant upfront infrastructure investment. This transition is also driven by the increasing need for collaborative research and data sharing, facilitated by secure, accessible cloud environments.
Dominant Regions, Countries, or Segments in CGH Microarray Software
North America is expected to emerge as the dominant region in the CGH Microarray Software market, driven by a combination of factors including substantial investments in genomic research, a well-established healthcare infrastructure, and a high prevalence of genetic disorders. The United States, in particular, is a powerhouse, with a strong presence of leading research organizations and hospitals adopting advanced diagnostic technologies. The application segment of Hospitals and Health Systems is anticipated to witness the most significant growth and dominance, fueled by the increasing integration of CGH into routine clinical diagnostics for cancer, rare diseases, and prenatal testing. The demand for accurate and efficient interpretation of complex genomic data from these institutions is a primary growth driver.
Dominant Region: North America
- Key Drivers: High R&D spending, advanced healthcare infrastructure, strong regulatory support for novel diagnostics, and significant patient populations with genetic conditions.
- Market Share Potential: Expected to hold over 40% of the global market share by 2025.
Dominant Application Segment: Hospitals and Health Systems
- Key Drivers: Increasing use in oncology (e.g., tumor profiling), pediatrics (e.g., developmental delays), and prenatal diagnostics; demand for faster and more accurate genetic diagnoses.
- Growth Potential: CAGR of XX% projected for this segment during the forecast period.
Dominant Type: Cloud-based CGH Microarray Software
- Key Drivers: Scalability, cost-effectiveness, accessibility, and enhanced collaboration capabilities; growing comfort with cloud solutions in healthcare and research.
- Market Penetration: Expected to capture over 60% of the market by 2033.
The Research Organizations segment will also remain a significant contributor, albeit with a slightly slower growth rate compared to clinical applications, as academic institutions continue to push the boundaries of genomic discovery. The Others segment, encompassing specialized diagnostic labs and forensic science, will exhibit steady growth, driven by niche applications and evolving regulatory requirements. Within the types of software, Cloud-based solutions will increasingly overshadow Web-based alternatives due to their superior scalability, flexibility, and ability to handle the ever-growing volume of genomic data.
CGH Microarray Software Product Landscape
The CGH Microarray Software product landscape is characterized by a focus on enhanced analytical capabilities, improved user interfaces, and deeper integration with broader genomic data analysis pipelines. Innovations are centered around automating complex tasks such as variant calling, annotation, and report generation, thereby reducing the time to diagnosis and improving accuracy. Performance metrics emphasize processing speed, accuracy of variant detection, and the comprehensiveness of genomic databases integrated within the software. Unique selling propositions often revolve around specialized analytical modules for specific disease areas, such as cancer genomics or rare genetic disorders, and robust visualization tools that aid in the interpretation of complex chromosomal aberrations. Technological advancements include the incorporation of machine learning algorithms for predictive analytics and the development of more intuitive platforms that cater to a wider range of users, from bioinformaticians to clinical geneticists.
Key Drivers, Barriers & Challenges in CGH Microarray Software
Key Drivers: The CGH Microarray Software market is primarily propelled by the escalating global burden of genetic diseases, the continuous advancements in microarray technology leading to higher resolution and accuracy, and the growing demand for personalized medicine approaches in diagnostics and treatment. The increasing adoption of CGH in oncology for tumor profiling and the identification of actionable mutations is a significant growth accelerator. Furthermore, supportive government initiatives and funding for genomic research, particularly in developed economies, are playing a crucial role in market expansion. The development of user-friendly software interfaces and cloud-based platforms is also democratizing access to these technologies, further driving adoption.
Key Barriers & Challenges: Despite the positive outlook, the market faces several hurdles. High initial investment costs associated with CGH microarray hardware and sophisticated software can be a significant barrier, especially for smaller research institutions and healthcare providers in emerging economies. Stringent regulatory approvals for diagnostic software can lead to extended development timelines and increased costs. Data security and privacy concerns associated with handling sensitive patient genomic data in cloud environments pose a challenge, requiring robust cybersecurity measures. The limited availability of skilled bioinformaticians and geneticists capable of effectively utilizing complex CGH analysis software also presents a restraint. Moreover, the competitive landscape, with the rise of next-generation sequencing (NGS) as an alternative for genomic analysis, necessitates continuous innovation and demonstration of CGH's unique value proposition in specific applications. The global impact on supply chain disruptions for essential reagents and equipment, though potentially temporary, can also pose a challenge to consistent operational capacity.
Emerging Opportunities in CGH Microarray Software
Emerging opportunities in the CGH Microarray Software sector lie in the development of integrated platforms that seamlessly combine CGH data with other omics data (e.g., transcriptomics, proteomics) for a more holistic understanding of disease mechanisms. The expansion of CGH applications into areas like pharmacogenomics for personalized drug response prediction presents a significant untapped market. There is also a growing demand for AI-powered interpretation tools that can accelerate the identification of rare disease variants and complex genomic rearrangements, thereby improving diagnostic yield. Furthermore, the development of cost-effective, point-of-care CGH solutions for rapid genetic testing in resource-limited settings represents a substantial growth avenue. The increasing focus on rare disease diagnosis globally is also creating a demand for specialized CGH analysis software tailored to specific genetic conditions.
Growth Accelerators in the CGH Microarray Software Industry
Several catalysts are expected to accelerate long-term growth in the CGH Microarray Software industry. Foremost among these is the continued technological advancement in microarray probe design and manufacturing, leading to higher resolution and increased efficiency. The strategic partnerships between software developers, microarray manufacturers, and pharmaceutical companies are crucial for driving innovation and market penetration, particularly in the development of companion diagnostics. Market expansion strategies focused on emerging economies, where the adoption of genomic technologies is still in its nascent stages, offer significant growth potential. The increasing emphasis on preventative healthcare and early disease detection will further fuel the demand for robust diagnostic tools like CGH microarray analysis. Investments in research and development, particularly in areas such as rare disease diagnostics and cancer genomics, will continue to foster a dynamic and growing market.
Key Players Shaping the CGH Microarray Software Market
- Agilent Technologies
- QIAGEN Digital Insights
- Fabric Genomics
- Congenica
- BioDiscovery
- PierianDx
Notable Milestones in CGH Microarray Software Sector
- 2019: Release of advanced variant calling algorithms, enhancing accuracy in CGH data analysis.
- 2020: Increased adoption of cloud-based CGH analysis platforms by research institutions globally.
- 2021: Integration of AI and machine learning for automated interpretation of CGH results, reducing diagnostic turnaround time.
- 2022: Expansion of CGH applications into novel areas such as rare disease diagnosis and developmental disorders.
- 2023: Strategic collaborations between software providers and microarray manufacturers to offer integrated solutions.
- 2024: Introduction of enhanced data visualization tools for more intuitive interpretation of complex genomic data.
In-Depth CGH Microarray Software Market Outlook
The future outlook for the CGH Microarray Software market is exceptionally promising, driven by sustained technological innovation and an ever-increasing demand for advanced genomic analysis solutions. Growth accelerators, including breakthroughs in AI-driven interpretation and the expansion of CGH into new clinical applications like pharmacogenomics, will continue to fuel market expansion. Strategic partnerships and market expansion into emerging regions represent significant avenues for future growth. The market is expected to witness deeper integration of CGH software into mainstream clinical workflows, solidifying its role as a critical tool in precision medicine and the diagnosis of genetic disorders. The continuous evolution of microarray technology, coupled with advancements in bioinformatics, ensures a dynamic and expanding market landscape with substantial potential for stakeholders.
CGH Microarray Software Segmentation
-
1. Application
- 1.1. Hospitals and Health Systems
- 1.2. Research Organizations
- 1.3. Others
-
2. Types
- 2.1. Web-based
- 2.2. Cloud-based
CGH Microarray Software Segmentation By Geography
-
1. North America
- 1.1. United States
- 1.2. Canada
- 1.3. Mexico
-
2. South America
- 2.1. Brazil
- 2.2. Argentina
- 2.3. Rest of South America
-
3. Europe
- 3.1. United Kingdom
- 3.2. Germany
- 3.3. France
- 3.4. Italy
- 3.5. Spain
- 3.6. Russia
- 3.7. Benelux
- 3.8. Nordics
- 3.9. Rest of Europe
-
4. Middle East & Africa
- 4.1. Turkey
- 4.2. Israel
- 4.3. GCC
- 4.4. North Africa
- 4.5. South Africa
- 4.6. Rest of Middle East & Africa
-
5. Asia Pacific
- 5.1. China
- 5.2. India
- 5.3. Japan
- 5.4. South Korea
- 5.5. ASEAN
- 5.6. Oceania
- 5.7. Rest of Asia Pacific

CGH Microarray Software Regional Market Share
Geographic Coverage of CGH Microarray Software
CGH Microarray Software REPORT HIGHLIGHTS
| Aspects | Details |
|---|---|
| Study Period | 2020-2034 |
| Base Year | 2025 |
| Estimated Year | 2026 |
| Forecast Period | 2026-2034 |
| Historical Period | 2020-2025 |
| Growth Rate | CAGR of 10.1% from 2020-2034 |
| Segmentation |
|
Table of Contents
- 1. Introduction
- 1.1. Research Scope
- 1.2. Market Segmentation
- 1.3. Research Objective
- 1.4. Definitions and Assumptions
- 2. Executive Summary
- 2.1. Market Snapshot
- 3. Market Dynamics
- 3.1. Market Drivers
- 3.2. Market Restrains
- 3.3. Market Trends
- 3.4. Market Opportunities
- 4. Market Factor Analysis
- 4.1. Porters Five Forces
- 4.1.1. Bargaining Power of Suppliers
- 4.1.2. Bargaining Power of Buyers
- 4.1.3. Threat of New Entrants
- 4.1.4. Threat of Substitutes
- 4.1.5. Competitive Rivalry
- 4.2. PESTEL analysis
- 4.3. BCG Analysis
- 4.3.1. Stars (High Growth, High Market Share)
- 4.3.2. Cash Cows (Low Growth, High Market Share)
- 4.3.3. Question Mark (High Growth, Low Market Share)
- 4.3.4. Dogs (Low Growth, Low Market Share)
- 4.4. Ansoff Matrix Analysis
- 4.5. Supply Chain Analysis
- 4.6. Regulatory Landscape
- 4.7. Current Market Potential and Opportunity Assessment (TAM–SAM–SOM Framework)
- 4.8. NRP Analyst Note
- 4.1. Porters Five Forces
- 5. Market Analysis, Insights and Forecast 2021-2033
- 5.1. Market Analysis, Insights and Forecast - by Application
- 5.1.1. Hospitals and Health Systems
- 5.1.2. Research Organizations
- 5.1.3. Others
- 5.2. Market Analysis, Insights and Forecast - by Types
- 5.2.1. Web-based
- 5.2.2. Cloud-based
- 5.3. Market Analysis, Insights and Forecast - by Region
- 5.3.1. North America
- 5.3.2. South America
- 5.3.3. Europe
- 5.3.4. Middle East & Africa
- 5.3.5. Asia Pacific
- 5.1. Market Analysis, Insights and Forecast - by Application
- 6. Global CGH Microarray Software Analysis, Insights and Forecast, 2021-2033
- 6.1. Market Analysis, Insights and Forecast - by Application
- 6.1.1. Hospitals and Health Systems
- 6.1.2. Research Organizations
- 6.1.3. Others
- 6.2. Market Analysis, Insights and Forecast - by Types
- 6.2.1. Web-based
- 6.2.2. Cloud-based
- 6.1. Market Analysis, Insights and Forecast - by Application
- 7. North America CGH Microarray Software Analysis, Insights and Forecast, 2020-2032
- 7.1. Market Analysis, Insights and Forecast - by Application
- 7.1.1. Hospitals and Health Systems
- 7.1.2. Research Organizations
- 7.1.3. Others
- 7.2. Market Analysis, Insights and Forecast - by Types
- 7.2.1. Web-based
- 7.2.2. Cloud-based
- 7.1. Market Analysis, Insights and Forecast - by Application
- 8. South America CGH Microarray Software Analysis, Insights and Forecast, 2020-2032
- 8.1. Market Analysis, Insights and Forecast - by Application
- 8.1.1. Hospitals and Health Systems
- 8.1.2. Research Organizations
- 8.1.3. Others
- 8.2. Market Analysis, Insights and Forecast - by Types
- 8.2.1. Web-based
- 8.2.2. Cloud-based
- 8.1. Market Analysis, Insights and Forecast - by Application
- 9. Europe CGH Microarray Software Analysis, Insights and Forecast, 2020-2032
- 9.1. Market Analysis, Insights and Forecast - by Application
- 9.1.1. Hospitals and Health Systems
- 9.1.2. Research Organizations
- 9.1.3. Others
- 9.2. Market Analysis, Insights and Forecast - by Types
- 9.2.1. Web-based
- 9.2.2. Cloud-based
- 9.1. Market Analysis, Insights and Forecast - by Application
- 10. Middle East & Africa CGH Microarray Software Analysis, Insights and Forecast, 2020-2032
- 10.1. Market Analysis, Insights and Forecast - by Application
- 10.1.1. Hospitals and Health Systems
- 10.1.2. Research Organizations
- 10.1.3. Others
- 10.2. Market Analysis, Insights and Forecast - by Types
- 10.2.1. Web-based
- 10.2.2. Cloud-based
- 10.1. Market Analysis, Insights and Forecast - by Application
- 11. Asia Pacific CGH Microarray Software Analysis, Insights and Forecast, 2020-2032
- 11.1. Market Analysis, Insights and Forecast - by Application
- 11.1.1. Hospitals and Health Systems
- 11.1.2. Research Organizations
- 11.1.3. Others
- 11.2. Market Analysis, Insights and Forecast - by Types
- 11.2.1. Web-based
- 11.2.2. Cloud-based
- 11.1. Market Analysis, Insights and Forecast - by Application
- 12. Competitive Analysis
- 12.1. Company Profiles
- 12.1.1 Agilent Technologies
- 12.1.1.1. Company Overview
- 12.1.1.2. Products
- 12.1.1.3. Company Financials
- 12.1.1.4. SWOT Analysis
- 12.1.2 QIAGEN Digital Insights
- 12.1.2.1. Company Overview
- 12.1.2.2. Products
- 12.1.2.3. Company Financials
- 12.1.2.4. SWOT Analysis
- 12.1.3 Fabric Genomics
- 12.1.3.1. Company Overview
- 12.1.3.2. Products
- 12.1.3.3. Company Financials
- 12.1.3.4. SWOT Analysis
- 12.1.4 Congenica
- 12.1.4.1. Company Overview
- 12.1.4.2. Products
- 12.1.4.3. Company Financials
- 12.1.4.4. SWOT Analysis
- 12.1.5 BioDiscovery
- 12.1.5.1. Company Overview
- 12.1.5.2. Products
- 12.1.5.3. Company Financials
- 12.1.5.4. SWOT Analysis
- 12.1.6 PierianDx
- 12.1.6.1. Company Overview
- 12.1.6.2. Products
- 12.1.6.3. Company Financials
- 12.1.6.4. SWOT Analysis
- 12.1.1 Agilent Technologies
- 12.2. Market Entropy
- 12.2.1 Company's Key Areas Served
- 12.2.2 Recent Developments
- 12.3. Company Market Share Analysis 2025
- 12.3.1 Top 5 Companies Market Share Analysis
- 12.3.2 Top 3 Companies Market Share Analysis
- 12.4. List of Potential Customers
- 13. Research Methodology
List of Figures
- Figure 1: Global CGH Microarray Software Revenue Breakdown (undefined, %) by Region 2025 & 2033
- Figure 2: North America CGH Microarray Software Revenue (undefined), by Application 2025 & 2033
- Figure 3: North America CGH Microarray Software Revenue Share (%), by Application 2025 & 2033
- Figure 4: North America CGH Microarray Software Revenue (undefined), by Types 2025 & 2033
- Figure 5: North America CGH Microarray Software Revenue Share (%), by Types 2025 & 2033
- Figure 6: North America CGH Microarray Software Revenue (undefined), by Country 2025 & 2033
- Figure 7: North America CGH Microarray Software Revenue Share (%), by Country 2025 & 2033
- Figure 8: South America CGH Microarray Software Revenue (undefined), by Application 2025 & 2033
- Figure 9: South America CGH Microarray Software Revenue Share (%), by Application 2025 & 2033
- Figure 10: South America CGH Microarray Software Revenue (undefined), by Types 2025 & 2033
- Figure 11: South America CGH Microarray Software Revenue Share (%), by Types 2025 & 2033
- Figure 12: South America CGH Microarray Software Revenue (undefined), by Country 2025 & 2033
- Figure 13: South America CGH Microarray Software Revenue Share (%), by Country 2025 & 2033
- Figure 14: Europe CGH Microarray Software Revenue (undefined), by Application 2025 & 2033
- Figure 15: Europe CGH Microarray Software Revenue Share (%), by Application 2025 & 2033
- Figure 16: Europe CGH Microarray Software Revenue (undefined), by Types 2025 & 2033
- Figure 17: Europe CGH Microarray Software Revenue Share (%), by Types 2025 & 2033
- Figure 18: Europe CGH Microarray Software Revenue (undefined), by Country 2025 & 2033
- Figure 19: Europe CGH Microarray Software Revenue Share (%), by Country 2025 & 2033
- Figure 20: Middle East & Africa CGH Microarray Software Revenue (undefined), by Application 2025 & 2033
- Figure 21: Middle East & Africa CGH Microarray Software Revenue Share (%), by Application 2025 & 2033
- Figure 22: Middle East & Africa CGH Microarray Software Revenue (undefined), by Types 2025 & 2033
- Figure 23: Middle East & Africa CGH Microarray Software Revenue Share (%), by Types 2025 & 2033
- Figure 24: Middle East & Africa CGH Microarray Software Revenue (undefined), by Country 2025 & 2033
- Figure 25: Middle East & Africa CGH Microarray Software Revenue Share (%), by Country 2025 & 2033
- Figure 26: Asia Pacific CGH Microarray Software Revenue (undefined), by Application 2025 & 2033
- Figure 27: Asia Pacific CGH Microarray Software Revenue Share (%), by Application 2025 & 2033
- Figure 28: Asia Pacific CGH Microarray Software Revenue (undefined), by Types 2025 & 2033
- Figure 29: Asia Pacific CGH Microarray Software Revenue Share (%), by Types 2025 & 2033
- Figure 30: Asia Pacific CGH Microarray Software Revenue (undefined), by Country 2025 & 2033
- Figure 31: Asia Pacific CGH Microarray Software Revenue Share (%), by Country 2025 & 2033
List of Tables
- Table 1: Global CGH Microarray Software Revenue undefined Forecast, by Application 2020 & 2033
- Table 2: Global CGH Microarray Software Revenue undefined Forecast, by Types 2020 & 2033
- Table 3: Global CGH Microarray Software Revenue undefined Forecast, by Region 2020 & 2033
- Table 4: Global CGH Microarray Software Revenue undefined Forecast, by Application 2020 & 2033
- Table 5: Global CGH Microarray Software Revenue undefined Forecast, by Types 2020 & 2033
- Table 6: Global CGH Microarray Software Revenue undefined Forecast, by Country 2020 & 2033
- Table 7: United States CGH Microarray Software Revenue (undefined) Forecast, by Application 2020 & 2033
- Table 8: Canada CGH Microarray Software Revenue (undefined) Forecast, by Application 2020 & 2033
- Table 9: Mexico CGH Microarray Software Revenue (undefined) Forecast, by Application 2020 & 2033
- Table 10: Global CGH Microarray Software Revenue undefined Forecast, by Application 2020 & 2033
- Table 11: Global CGH Microarray Software Revenue undefined Forecast, by Types 2020 & 2033
- Table 12: Global CGH Microarray Software Revenue undefined Forecast, by Country 2020 & 2033
- Table 13: Brazil CGH Microarray Software Revenue (undefined) Forecast, by Application 2020 & 2033
- Table 14: Argentina CGH Microarray Software Revenue (undefined) Forecast, by Application 2020 & 2033
- Table 15: Rest of South America CGH Microarray Software Revenue (undefined) Forecast, by Application 2020 & 2033
- Table 16: Global CGH Microarray Software Revenue undefined Forecast, by Application 2020 & 2033
- Table 17: Global CGH Microarray Software Revenue undefined Forecast, by Types 2020 & 2033
- Table 18: Global CGH Microarray Software Revenue undefined Forecast, by Country 2020 & 2033
- Table 19: United Kingdom CGH Microarray Software Revenue (undefined) Forecast, by Application 2020 & 2033
- Table 20: Germany CGH Microarray Software Revenue (undefined) Forecast, by Application 2020 & 2033
- Table 21: France CGH Microarray Software Revenue (undefined) Forecast, by Application 2020 & 2033
- Table 22: Italy CGH Microarray Software Revenue (undefined) Forecast, by Application 2020 & 2033
- Table 23: Spain CGH Microarray Software Revenue (undefined) Forecast, by Application 2020 & 2033
- Table 24: Russia CGH Microarray Software Revenue (undefined) Forecast, by Application 2020 & 2033
- Table 25: Benelux CGH Microarray Software Revenue (undefined) Forecast, by Application 2020 & 2033
- Table 26: Nordics CGH Microarray Software Revenue (undefined) Forecast, by Application 2020 & 2033
- Table 27: Rest of Europe CGH Microarray Software Revenue (undefined) Forecast, by Application 2020 & 2033
- Table 28: Global CGH Microarray Software Revenue undefined Forecast, by Application 2020 & 2033
- Table 29: Global CGH Microarray Software Revenue undefined Forecast, by Types 2020 & 2033
- Table 30: Global CGH Microarray Software Revenue undefined Forecast, by Country 2020 & 2033
- Table 31: Turkey CGH Microarray Software Revenue (undefined) Forecast, by Application 2020 & 2033
- Table 32: Israel CGH Microarray Software Revenue (undefined) Forecast, by Application 2020 & 2033
- Table 33: GCC CGH Microarray Software Revenue (undefined) Forecast, by Application 2020 & 2033
- Table 34: North Africa CGH Microarray Software Revenue (undefined) Forecast, by Application 2020 & 2033
- Table 35: South Africa CGH Microarray Software Revenue (undefined) Forecast, by Application 2020 & 2033
- Table 36: Rest of Middle East & Africa CGH Microarray Software Revenue (undefined) Forecast, by Application 2020 & 2033
- Table 37: Global CGH Microarray Software Revenue undefined Forecast, by Application 2020 & 2033
- Table 38: Global CGH Microarray Software Revenue undefined Forecast, by Types 2020 & 2033
- Table 39: Global CGH Microarray Software Revenue undefined Forecast, by Country 2020 & 2033
- Table 40: China CGH Microarray Software Revenue (undefined) Forecast, by Application 2020 & 2033
- Table 41: India CGH Microarray Software Revenue (undefined) Forecast, by Application 2020 & 2033
- Table 42: Japan CGH Microarray Software Revenue (undefined) Forecast, by Application 2020 & 2033
- Table 43: South Korea CGH Microarray Software Revenue (undefined) Forecast, by Application 2020 & 2033
- Table 44: ASEAN CGH Microarray Software Revenue (undefined) Forecast, by Application 2020 & 2033
- Table 45: Oceania CGH Microarray Software Revenue (undefined) Forecast, by Application 2020 & 2033
- Table 46: Rest of Asia Pacific CGH Microarray Software Revenue (undefined) Forecast, by Application 2020 & 2033
Frequently Asked Questions
1. What is the projected Compound Annual Growth Rate (CAGR) of the CGH Microarray Software?
The projected CAGR is approximately 10.1%.
2. Which companies are prominent players in the CGH Microarray Software?
Key companies in the market include Agilent Technologies, QIAGEN Digital Insights, Fabric Genomics, Congenica, BioDiscovery, PierianDx.
3. What are the main segments of the CGH Microarray Software?
The market segments include Application, Types.
4. Can you provide details about the market size?
The market size is estimated to be USD XXX N/A as of 2022.
5. What are some drivers contributing to market growth?
N/A
6. What are the notable trends driving market growth?
N/A
7. Are there any restraints impacting market growth?
N/A
8. Can you provide examples of recent developments in the market?
N/A
9. What pricing options are available for accessing the report?
Pricing options include single-user, multi-user, and enterprise licenses priced at USD 3350.00, USD 5025.00, and USD 6700.00 respectively.
10. Is the market size provided in terms of value or volume?
The market size is provided in terms of value, measured in N/A.
11. Are there any specific market keywords associated with the report?
Yes, the market keyword associated with the report is "CGH Microarray Software," which aids in identifying and referencing the specific market segment covered.
12. How do I determine which pricing option suits my needs best?
The pricing options vary based on user requirements and access needs. Individual users may opt for single-user licenses, while businesses requiring broader access may choose multi-user or enterprise licenses for cost-effective access to the report.
13. Are there any additional resources or data provided in the CGH Microarray Software report?
While the report offers comprehensive insights, it's advisable to review the specific contents or supplementary materials provided to ascertain if additional resources or data are available.
14. How can I stay updated on further developments or reports in the CGH Microarray Software?
To stay informed about further developments, trends, and reports in the CGH Microarray Software, consider subscribing to industry newsletters, following relevant companies and organizations, or regularly checking reputable industry news sources and publications.
Methodology
Step 1 - Identification of Relevant Samples Size from Population Database


Step 2 - Approaches for Defining Global Market Size (Value, Volume* & Price*)

Note*: In applicable scenarios
Step 3 - Data Sources
Primary Research
- Web Analytics
- Survey Reports
- Research Institute
- Latest Research Reports
- Opinion Leaders
Secondary Research
- Annual Reports
- White Paper
- Latest Press Release
- Industry Association
- Paid Database
- Investor Presentations

Step 4 - Data Triangulation
Involves using different sources of information in order to increase the validity of a study
These sources are likely to be stakeholders in a program - participants, other researchers, program staff, other community members, and so on.
Then we put all data in single framework & apply various statistical tools to find out the dynamic on the market.
During the analysis stage, feedback from the stakeholder groups would be compared to determine areas of agreement as well as areas of divergence