

Key Insights
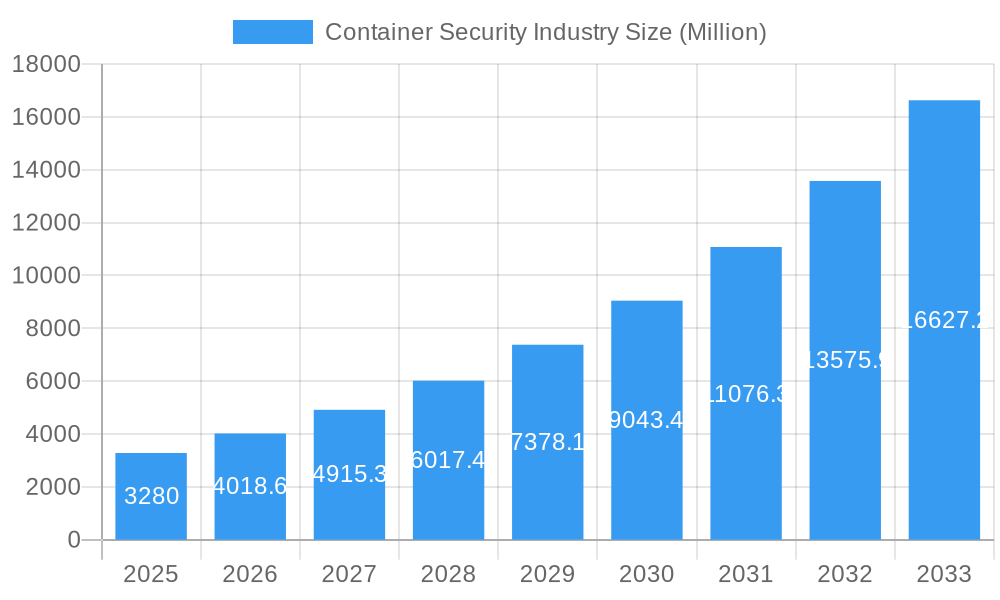
The Container Security Industry is poised for exceptional growth, with a projected market size of $3,280 million in the base year 2025, expanding at a remarkable Compound Annual Growth Rate (CAGR) of 22.54% through 2033. This robust expansion is primarily fueled by the escalating adoption of containerization across diverse industries, driven by its inherent benefits in agility, scalability, and efficient resource utilization. The increasing sophistication of cyber threats targeting containerized environments, coupled with stringent regulatory compliance requirements, further propels the demand for comprehensive container security solutions. Organizations are recognizing the critical need to secure their container lifecycles, from development and deployment to runtime, necessitating advanced tools for vulnerability scanning, runtime protection, and continuous monitoring.
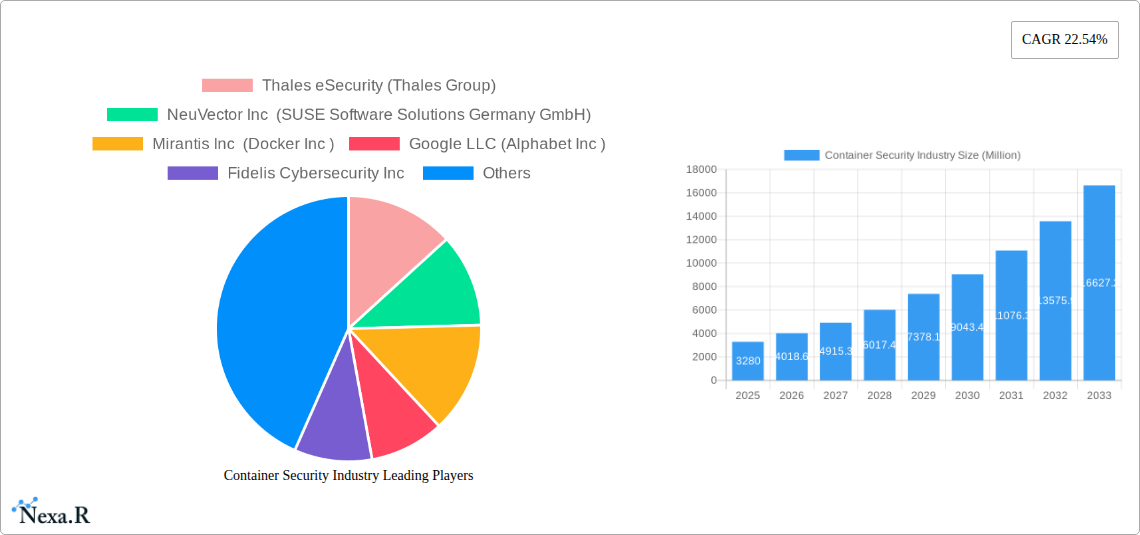
Container Security Industry Market Size (In Billion)
Key drivers of this market surge include the rapid digital transformation initiatives by businesses, the rise of microservices architecture, and the increasing prevalence of cloud-native applications. The market is segmented by organization size, with large enterprises leading adoption due to their extensive container deployments, while small and medium enterprises are increasingly investing to enhance their security posture. Deployment models are also diverse, with a strong shift towards cloud-based solutions owing to their scalability and managed services, though on-premise deployments remain relevant for organizations with specific data residency or control requirements. The IT & ITES, BFSI, and Retail sectors are at the forefront of container security adoption, followed by Healthcare and Industrial sectors, showcasing a broad-based market penetration. Emerging trends such as the integration of AI and machine learning for anomaly detection and automated threat response are expected to shape the future of container security.
Container Security Industry Company Market Share
Container Security Industry: Comprehensive Market Analysis and Forecast (2019-2033)
This in-depth report offers a meticulous analysis of the global Container Security Industry, providing strategic insights into its market dynamics, growth trajectories, and competitive landscape. With a study period spanning from 2019 to 2033, and a base year of 2025, this report delivers precise quantitative data and qualitative assessments critical for stakeholders. The report explores parent and child market segments, crucial for understanding the intricate web of opportunities and challenges within the broader cybersecurity ecosystem. Valued in millions of USD, this report is designed for immediate use, requiring no further modifications.
Container Security Industry Market Dynamics & Structure
The global Container Security Industry is characterized by a dynamic interplay of technological innovation, evolving regulatory frameworks, and increasing cybersecurity threats targeting containerized environments. Market concentration varies across specialized niches, with a growing trend towards integrated security platforms. Key drivers include the rapid adoption of DevOps practices, microservices architecture, and cloud-native technologies, which necessitate robust container security solutions for vulnerability management, runtime protection, and compliance. Competitive product substitutes, while present in point solutions, are increasingly being consolidated into comprehensive Cloud-Native Application Protection Platforms (CNAPP). End-user demographics are diverse, with Large Enterprises and Small & Medium Enterprises alike prioritizing container security to mitigate risks. M&A trends indicate a consolidation phase, with larger cybersecurity firms acquiring specialized container security startups to enhance their portfolios and expand market reach.
- Technological Innovation Drivers: Rise of Kubernetes, serverless computing, and CI/CD pipelines.
- Regulatory Frameworks: GDPR, CCPA, and industry-specific compliance mandates driving adoption.
- Competitive Landscape: Shift from standalone tools to integrated CNAPP solutions.
- End-User Focus: Growing demand for holistic security from build to runtime.
- M&A Activity: Strategic acquisitions to gain comprehensive container security capabilities.
Container Security Industry Growth Trends & Insights
The Container Security Industry is poised for substantial growth, driven by the pervasive adoption of containerization across all major end-user industries. The market size is projected to witness a significant expansion, fueled by increasing awareness of container-specific vulnerabilities and the rising sophistication of cyber threats. Adoption rates are accelerating as organizations realize the critical need to secure their containerized workloads throughout their lifecycle, from development to production. Technological disruptions, such as advancements in AI-powered threat detection and automated security policies, are further accelerating this trend. Consumer behavior shifts are evident in the demand for more integrated, user-friendly, and cloud-native security solutions that seamlessly fit into existing DevOps workflows.
The market is witnessing a robust Compound Annual Growth Rate (CAGR) of approximately 22.5% during the forecast period. This growth is underpinned by the increasing pervasiveness of container technologies, the rising volume and complexity of cyberattacks targeting these environments, and the growing imperative for regulatory compliance. By 2025, the market size is estimated to reach $12,450.7 million, with projections indicating a surge to $48,900.2 million by 2033. This expansion is directly correlated with the escalating adoption of microservices and cloud-native architectures, where containers form the fundamental building blocks. The penetration of container security solutions within enterprise IT infrastructure is also deepening, as organizations move beyond basic image scanning to comprehensive runtime protection and policy enforcement. This evolution reflects a mature understanding of the risks associated with unsecured container deployments, including data breaches, intellectual property theft, and service disruptions. Furthermore, the increasing integration of security testing earlier in the development lifecycle (Shift-Left Security) is driving demand for automated container scanning and vulnerability management tools.
Dominant Regions, Countries, or Segments in Container Security Industry
The IT & ITES sector stands out as the dominant end-user industry driving the growth of the Container Security Industry. This dominance stems from the sector's early and widespread adoption of cloud-native technologies, microservices, and DevOps practices, all of which heavily rely on containerization. Consequently, the need for robust container security solutions to protect critical applications and sensitive data within these environments is paramount. Cloud-based deployment models also lead the market, reflecting the migration of workloads to public, private, and hybrid cloud infrastructures.
- Dominant End-User Industry:
- IT & ITES: High adoption of cloud-native technologies, extensive use of containers in application development and deployment, and the critical need for securing sensitive data and intellectual property. This segment is projected to hold a market share of approximately 35% by 2025.
- Dominant Deployment Model:
- Cloud-based: Facilitates scalability, agility, and cost-effectiveness, aligning perfectly with the inherent benefits of containerization. The cloud segment is expected to capture around 65% of the market share by 2025, with a strong CAGR of 24.2%.
- Dominant Organization Size:
- Large Enterprises: Possess the resources and the critical need to invest in comprehensive container security solutions to protect their extensive digital assets and maintain business continuity. They are expected to contribute significantly to market revenue, estimated at $7,500.5 million in 2025.
- Key Regional Drivers:
- North America: Leading the market due to early adoption of advanced technologies, presence of major tech companies, and stringent regulatory compliance requirements. Expected market share of 38% by 2025.
- Europe: Growing adoption of cloud and container technologies, coupled with increasing data privacy regulations (e.g., GDPR), fuels demand. Projected market share of 28% by 2025.
Container Security Industry Product Landscape
The product landscape of the Container Security Industry is rapidly evolving, with a focus on comprehensive solutions that address the entire container lifecycle. Innovations include advanced vulnerability scanning for container images, runtime threat detection and prevention, network security for containerized applications, and secrets management. Unique selling propositions often revolve around seamless integration with existing CI/CD pipelines, support for multi-cloud environments, and AI-driven anomaly detection. Technological advancements are enabling more granular policy enforcement, automated compliance checks, and proactive risk mitigation strategies, offering enhanced performance and security posture for organizations leveraging containerized applications.
Key Drivers, Barriers & Challenges in Container Security Industry
The Container Security Industry is propelled by several key drivers, including the widespread adoption of DevOps and cloud-native architectures, the escalating complexity of cyber threats targeting containerized environments, and the increasing demand for regulatory compliance. The inherent scalability and agility offered by containers necessitate robust security measures to prevent breaches and ensure data integrity.
Conversely, barriers and challenges exist, such as the shortage of skilled cybersecurity professionals with expertise in container security, the complexity of integrating disparate security tools, and the potential for misconfigurations leading to vulnerabilities. The rapid pace of technological change can also make it challenging for organizations to keep pace with the latest security best practices.
Emerging Opportunities in Container Security Industry
Emerging opportunities in the Container Security Industry lie in the development of more sophisticated AI and machine learning-powered threat detection systems that can identify subtle anomalies in container behavior. There is also significant potential in providing integrated security solutions for edge computing environments and the burgeoning Internet of Things (IoT) ecosystem, which increasingly leverage containerization. Furthermore, tailored security solutions for specific industry verticals, addressing unique compliance and threat landscapes, represent a growing area of opportunity. The demand for DevSecOps enablement tools that seamlessly integrate security into the development pipeline will also continue to drive innovation.
Growth Accelerators in the Container Security Industry Industry
Growth accelerators in the Container Security Industry are primarily fueled by technological breakthroughs in areas like Kubernetes security, serverless security, and API security for microservices. Strategic partnerships between cloud providers and cybersecurity vendors are further expanding market reach and enhancing the integrated security offerings. Moreover, the increasing globalization of businesses and the rise of remote work models are driving the need for consistent and secure containerized application deployments across distributed environments, acting as significant growth catalysts. The expansion of cloud infrastructure and the continuous innovation in container orchestration platforms will also continue to drive adoption.
Key Players Shaping the Container Security Industry Market
- Thales eSecurity (Thales Group)
- NeuVector Inc (SUSE Software Solutions Germany GmbH)
- Mirantis Inc (Docker Inc)
- Google LLC (Alphabet Inc)
- Fidelis Cybersecurity Inc
- Red Hat Inc
- Trend Micro Incorporated
- Rapid7 Inc
- Qualys Inc
- Aqua Security Software Ltd
- Palo Alto Networks Inc
Notable Milestones in Container Security Industry Sector
- October 2022: Veracode announced the addition of container security to its Continuous Software Security Platform, including vulnerability scanning, secure configuration, and secrets management for container images.
- August 2022: Tigera announced the General Availability (GA) of new container security features for Calico Cloud, including runtime malware protection, image assurance with scanning, runtime visibility of vulnerable workloads, and admission control policies.
In-Depth Container Security Industry Market Outlook
The In-Depth Container Security Industry Market Outlook indicates a robust future driven by the sustained digital transformation initiatives across global enterprises. The increasing complexity of IT infrastructures, coupled with the growing sophistication of cyber threats, will continue to necessitate advanced container security solutions. Opportunities for market players will emerge from providing comprehensive, integrated platforms that offer end-to-end security from code to cloud. Strategic investments in research and development, focusing on AI-driven threat intelligence and automated security orchestration, will be critical for sustained growth. The expansion into emerging markets and the development of specialized solutions for niche industries will also unlock significant potential in the coming years.
Container Security Industry Segmentation
-
1. Organisation Size
- 1.1. Large Enterprises
- 1.2. Small & Medium Enterprises
-
2. Deployment
- 2.1. Cloud-based
- 2.2. On-premise
-
3. End-user Industry
- 3.1. IT & ITES
- 3.2. BFSI
- 3.3. Retail
- 3.4. Healthcare
- 3.5. Industrial
- 3.6. Other End-user Industries
Container Security Industry Segmentation By Geography
-
1. North America
- 1.1. United States
- 1.2. Canada
-
2. Europe
- 2.1. United Kingdom
- 2.2. Germany
- 2.3. Rest of Europe
-
3. Asia Pacific
- 3.1. China
- 3.2. Japan
- 3.3. Rest of Asia Pacific
-
4. Rest of the World
- 4.1. Latin America
- 4.2. Middle East
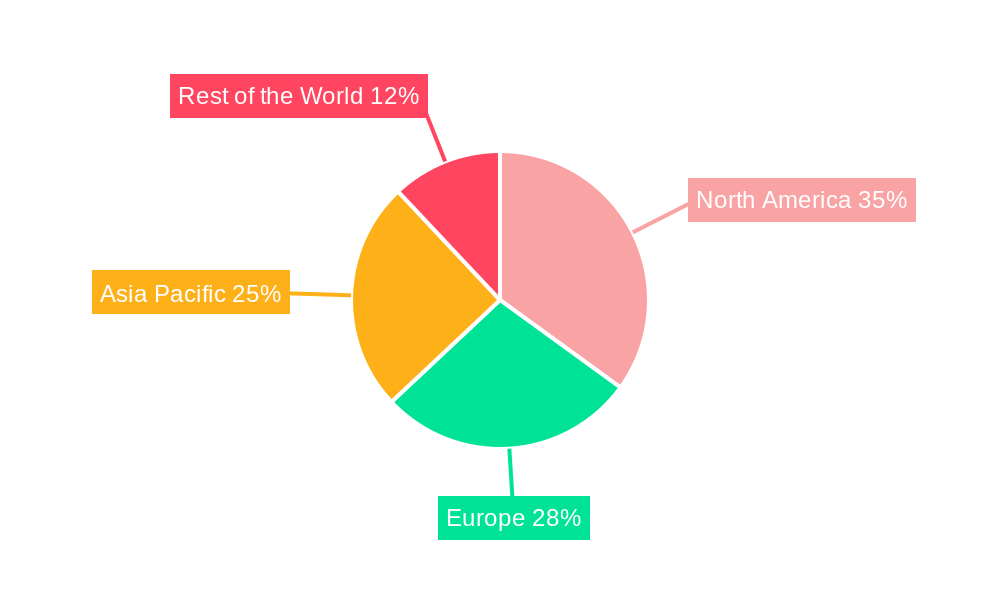
Container Security Industry Regional Market Share
Geographic Coverage of Container Security Industry
Container Security Industry REPORT HIGHLIGHTS
| Aspects | Details |
|---|---|
| Study Period | 2020-2034 |
| Base Year | 2025 |
| Estimated Year | 2026 |
| Forecast Period | 2026-2034 |
| Historical Period | 2020-2025 |
| Growth Rate | CAGR of 22.54% from 2020-2034 |
| Segmentation |
|
Table of Contents
- 1. Introduction
- 1.1. Research Scope
- 1.2. Market Segmentation
- 1.3. Research Objective
- 1.4. Definitions and Assumptions
- 2. Executive Summary
- 2.1. Market Snapshot
- 3. Market Dynamics
- 3.1. Market Drivers
- 3.2. Market Restrains
- 3.3. Market Trends
- 3.4. Market Opportunities
- 4. Market Factor Analysis
- 4.1. Porters Five Forces
- 4.1.1. Bargaining Power of Suppliers
- 4.1.2. Bargaining Power of Buyers
- 4.1.3. Threat of New Entrants
- 4.1.4. Threat of Substitutes
- 4.1.5. Competitive Rivalry
- 4.2. PESTEL analysis
- 4.3. BCG Analysis
- 4.3.1. Stars (High Growth, High Market Share)
- 4.3.2. Cash Cows (Low Growth, High Market Share)
- 4.3.3. Question Mark (High Growth, Low Market Share)
- 4.3.4. Dogs (Low Growth, Low Market Share)
- 4.4. Ansoff Matrix Analysis
- 4.5. Supply Chain Analysis
- 4.6. Regulatory Landscape
- 4.7. Current Market Potential and Opportunity Assessment (TAM–SAM–SOM Framework)
- 4.8. NRP Analyst Note
- 4.1. Porters Five Forces
- 5. Market Analysis, Insights and Forecast 2021-2033
- 5.1. Market Analysis, Insights and Forecast - by Organisation Size
- 5.1.1. Large Enterprises
- 5.1.2. Small & Medium Enterprises
- 5.2. Market Analysis, Insights and Forecast - by Deployment
- 5.2.1. Cloud-based
- 5.2.2. On-premise
- 5.3. Market Analysis, Insights and Forecast - by End-user Industry
- 5.3.1. IT & ITES
- 5.3.2. BFSI
- 5.3.3. Retail
- 5.3.4. Healthcare
- 5.3.5. Industrial
- 5.3.6. Other End-user Industries
- 5.4. Market Analysis, Insights and Forecast - by Region
- 5.4.1. North America
- 5.4.2. Europe
- 5.4.3. Asia Pacific
- 5.4.4. Rest of the World
- 5.1. Market Analysis, Insights and Forecast - by Organisation Size
- 6. Global Container Security Industry Analysis, Insights and Forecast, 2021-2033
- 6.1. Market Analysis, Insights and Forecast - by Organisation Size
- 6.1.1. Large Enterprises
- 6.1.2. Small & Medium Enterprises
- 6.2. Market Analysis, Insights and Forecast - by Deployment
- 6.2.1. Cloud-based
- 6.2.2. On-premise
- 6.3. Market Analysis, Insights and Forecast - by End-user Industry
- 6.3.1. IT & ITES
- 6.3.2. BFSI
- 6.3.3. Retail
- 6.3.4. Healthcare
- 6.3.5. Industrial
- 6.3.6. Other End-user Industries
- 6.1. Market Analysis, Insights and Forecast - by Organisation Size
- 7. North America Container Security Industry Analysis, Insights and Forecast, 2020-2032
- 7.1. Market Analysis, Insights and Forecast - by Organisation Size
- 7.1.1. Large Enterprises
- 7.1.2. Small & Medium Enterprises
- 7.2. Market Analysis, Insights and Forecast - by Deployment
- 7.2.1. Cloud-based
- 7.2.2. On-premise
- 7.3. Market Analysis, Insights and Forecast - by End-user Industry
- 7.3.1. IT & ITES
- 7.3.2. BFSI
- 7.3.3. Retail
- 7.3.4. Healthcare
- 7.3.5. Industrial
- 7.3.6. Other End-user Industries
- 7.1. Market Analysis, Insights and Forecast - by Organisation Size
- 8. Europe Container Security Industry Analysis, Insights and Forecast, 2020-2032
- 8.1. Market Analysis, Insights and Forecast - by Organisation Size
- 8.1.1. Large Enterprises
- 8.1.2. Small & Medium Enterprises
- 8.2. Market Analysis, Insights and Forecast - by Deployment
- 8.2.1. Cloud-based
- 8.2.2. On-premise
- 8.3. Market Analysis, Insights and Forecast - by End-user Industry
- 8.3.1. IT & ITES
- 8.3.2. BFSI
- 8.3.3. Retail
- 8.3.4. Healthcare
- 8.3.5. Industrial
- 8.3.6. Other End-user Industries
- 8.1. Market Analysis, Insights and Forecast - by Organisation Size
- 9. Asia Pacific Container Security Industry Analysis, Insights and Forecast, 2020-2032
- 9.1. Market Analysis, Insights and Forecast - by Organisation Size
- 9.1.1. Large Enterprises
- 9.1.2. Small & Medium Enterprises
- 9.2. Market Analysis, Insights and Forecast - by Deployment
- 9.2.1. Cloud-based
- 9.2.2. On-premise
- 9.3. Market Analysis, Insights and Forecast - by End-user Industry
- 9.3.1. IT & ITES
- 9.3.2. BFSI
- 9.3.3. Retail
- 9.3.4. Healthcare
- 9.3.5. Industrial
- 9.3.6. Other End-user Industries
- 9.1. Market Analysis, Insights and Forecast - by Organisation Size
- 10. Rest of the World Container Security Industry Analysis, Insights and Forecast, 2020-2032
- 10.1. Market Analysis, Insights and Forecast - by Organisation Size
- 10.1.1. Large Enterprises
- 10.1.2. Small & Medium Enterprises
- 10.2. Market Analysis, Insights and Forecast - by Deployment
- 10.2.1. Cloud-based
- 10.2.2. On-premise
- 10.3. Market Analysis, Insights and Forecast - by End-user Industry
- 10.3.1. IT & ITES
- 10.3.2. BFSI
- 10.3.3. Retail
- 10.3.4. Healthcare
- 10.3.5. Industrial
- 10.3.6. Other End-user Industries
- 10.1. Market Analysis, Insights and Forecast - by Organisation Size
- 11. Competitive Analysis
- 11.1. Company Profiles
- 11.1.1 Thales eSecurity (Thales Group)
- 11.1.1.1. Company Overview
- 11.1.1.2. Products
- 11.1.1.3. Company Financials
- 11.1.1.4. SWOT Analysis
- 11.1.2 NeuVector Inc (SUSE Software Solutions Germany GmbH)
- 11.1.2.1. Company Overview
- 11.1.2.2. Products
- 11.1.2.3. Company Financials
- 11.1.2.4. SWOT Analysis
- 11.1.3 Mirantis Inc (Docker Inc )
- 11.1.3.1. Company Overview
- 11.1.3.2. Products
- 11.1.3.3. Company Financials
- 11.1.3.4. SWOT Analysis
- 11.1.4 Google LLC (Alphabet Inc )
- 11.1.4.1. Company Overview
- 11.1.4.2. Products
- 11.1.4.3. Company Financials
- 11.1.4.4. SWOT Analysis
- 11.1.5 Fidelis Cybersecurity Inc
- 11.1.5.1. Company Overview
- 11.1.5.2. Products
- 11.1.5.3. Company Financials
- 11.1.5.4. SWOT Analysis
- 11.1.6 Red Hat Inc
- 11.1.6.1. Company Overview
- 11.1.6.2. Products
- 11.1.6.3. Company Financials
- 11.1.6.4. SWOT Analysis
- 11.1.7 Trend Micro Incorporated
- 11.1.7.1. Company Overview
- 11.1.7.2. Products
- 11.1.7.3. Company Financials
- 11.1.7.4. SWOT Analysis
- 11.1.8 Rapid7 Inc
- 11.1.8.1. Company Overview
- 11.1.8.2. Products
- 11.1.8.3. Company Financials
- 11.1.8.4. SWOT Analysis
- 11.1.9 Qualys Inc
- 11.1.9.1. Company Overview
- 11.1.9.2. Products
- 11.1.9.3. Company Financials
- 11.1.9.4. SWOT Analysis
- 11.1.10 Aqua Security Software Ltd
- 11.1.10.1. Company Overview
- 11.1.10.2. Products
- 11.1.10.3. Company Financials
- 11.1.10.4. SWOT Analysis
- 11.1.11 Palo Alto Networks Inc
- 11.1.11.1. Company Overview
- 11.1.11.2. Products
- 11.1.11.3. Company Financials
- 11.1.11.4. SWOT Analysis
- 11.1.1 Thales eSecurity (Thales Group)
- 11.2. Market Entropy
- 11.2.1 Company's Key Areas Served
- 11.2.2 Recent Developments
- 11.3. Company Market Share Analysis 2025
- 11.3.1 Top 5 Companies Market Share Analysis
- 11.3.2 Top 3 Companies Market Share Analysis
- 11.4. List of Potential Customers
- 12. Research Methodology
List of Figures
- Figure 1: Global Container Security Industry Revenue Breakdown (Million, %) by Region 2025 & 2033
- Figure 2: Global Container Security Industry Volume Breakdown (K Unit, %) by Region 2025 & 2033
- Figure 3: North America Container Security Industry Revenue (Million), by Organisation Size 2025 & 2033
- Figure 4: North America Container Security Industry Volume (K Unit), by Organisation Size 2025 & 2033
- Figure 5: North America Container Security Industry Revenue Share (%), by Organisation Size 2025 & 2033
- Figure 6: North America Container Security Industry Volume Share (%), by Organisation Size 2025 & 2033
- Figure 7: North America Container Security Industry Revenue (Million), by Deployment 2025 & 2033
- Figure 8: North America Container Security Industry Volume (K Unit), by Deployment 2025 & 2033
- Figure 9: North America Container Security Industry Revenue Share (%), by Deployment 2025 & 2033
- Figure 10: North America Container Security Industry Volume Share (%), by Deployment 2025 & 2033
- Figure 11: North America Container Security Industry Revenue (Million), by End-user Industry 2025 & 2033
- Figure 12: North America Container Security Industry Volume (K Unit), by End-user Industry 2025 & 2033
- Figure 13: North America Container Security Industry Revenue Share (%), by End-user Industry 2025 & 2033
- Figure 14: North America Container Security Industry Volume Share (%), by End-user Industry 2025 & 2033
- Figure 15: North America Container Security Industry Revenue (Million), by Country 2025 & 2033
- Figure 16: North America Container Security Industry Volume (K Unit), by Country 2025 & 2033
- Figure 17: North America Container Security Industry Revenue Share (%), by Country 2025 & 2033
- Figure 18: North America Container Security Industry Volume Share (%), by Country 2025 & 2033
- Figure 19: Europe Container Security Industry Revenue (Million), by Organisation Size 2025 & 2033
- Figure 20: Europe Container Security Industry Volume (K Unit), by Organisation Size 2025 & 2033
- Figure 21: Europe Container Security Industry Revenue Share (%), by Organisation Size 2025 & 2033
- Figure 22: Europe Container Security Industry Volume Share (%), by Organisation Size 2025 & 2033
- Figure 23: Europe Container Security Industry Revenue (Million), by Deployment 2025 & 2033
- Figure 24: Europe Container Security Industry Volume (K Unit), by Deployment 2025 & 2033
- Figure 25: Europe Container Security Industry Revenue Share (%), by Deployment 2025 & 2033
- Figure 26: Europe Container Security Industry Volume Share (%), by Deployment 2025 & 2033
- Figure 27: Europe Container Security Industry Revenue (Million), by End-user Industry 2025 & 2033
- Figure 28: Europe Container Security Industry Volume (K Unit), by End-user Industry 2025 & 2033
- Figure 29: Europe Container Security Industry Revenue Share (%), by End-user Industry 2025 & 2033
- Figure 30: Europe Container Security Industry Volume Share (%), by End-user Industry 2025 & 2033
- Figure 31: Europe Container Security Industry Revenue (Million), by Country 2025 & 2033
- Figure 32: Europe Container Security Industry Volume (K Unit), by Country 2025 & 2033
- Figure 33: Europe Container Security Industry Revenue Share (%), by Country 2025 & 2033
- Figure 34: Europe Container Security Industry Volume Share (%), by Country 2025 & 2033
- Figure 35: Asia Pacific Container Security Industry Revenue (Million), by Organisation Size 2025 & 2033
- Figure 36: Asia Pacific Container Security Industry Volume (K Unit), by Organisation Size 2025 & 2033
- Figure 37: Asia Pacific Container Security Industry Revenue Share (%), by Organisation Size 2025 & 2033
- Figure 38: Asia Pacific Container Security Industry Volume Share (%), by Organisation Size 2025 & 2033
- Figure 39: Asia Pacific Container Security Industry Revenue (Million), by Deployment 2025 & 2033
- Figure 40: Asia Pacific Container Security Industry Volume (K Unit), by Deployment 2025 & 2033
- Figure 41: Asia Pacific Container Security Industry Revenue Share (%), by Deployment 2025 & 2033
- Figure 42: Asia Pacific Container Security Industry Volume Share (%), by Deployment 2025 & 2033
- Figure 43: Asia Pacific Container Security Industry Revenue (Million), by End-user Industry 2025 & 2033
- Figure 44: Asia Pacific Container Security Industry Volume (K Unit), by End-user Industry 2025 & 2033
- Figure 45: Asia Pacific Container Security Industry Revenue Share (%), by End-user Industry 2025 & 2033
- Figure 46: Asia Pacific Container Security Industry Volume Share (%), by End-user Industry 2025 & 2033
- Figure 47: Asia Pacific Container Security Industry Revenue (Million), by Country 2025 & 2033
- Figure 48: Asia Pacific Container Security Industry Volume (K Unit), by Country 2025 & 2033
- Figure 49: Asia Pacific Container Security Industry Revenue Share (%), by Country 2025 & 2033
- Figure 50: Asia Pacific Container Security Industry Volume Share (%), by Country 2025 & 2033
- Figure 51: Rest of the World Container Security Industry Revenue (Million), by Organisation Size 2025 & 2033
- Figure 52: Rest of the World Container Security Industry Volume (K Unit), by Organisation Size 2025 & 2033
- Figure 53: Rest of the World Container Security Industry Revenue Share (%), by Organisation Size 2025 & 2033
- Figure 54: Rest of the World Container Security Industry Volume Share (%), by Organisation Size 2025 & 2033
- Figure 55: Rest of the World Container Security Industry Revenue (Million), by Deployment 2025 & 2033
- Figure 56: Rest of the World Container Security Industry Volume (K Unit), by Deployment 2025 & 2033
- Figure 57: Rest of the World Container Security Industry Revenue Share (%), by Deployment 2025 & 2033
- Figure 58: Rest of the World Container Security Industry Volume Share (%), by Deployment 2025 & 2033
- Figure 59: Rest of the World Container Security Industry Revenue (Million), by End-user Industry 2025 & 2033
- Figure 60: Rest of the World Container Security Industry Volume (K Unit), by End-user Industry 2025 & 2033
- Figure 61: Rest of the World Container Security Industry Revenue Share (%), by End-user Industry 2025 & 2033
- Figure 62: Rest of the World Container Security Industry Volume Share (%), by End-user Industry 2025 & 2033
- Figure 63: Rest of the World Container Security Industry Revenue (Million), by Country 2025 & 2033
- Figure 64: Rest of the World Container Security Industry Volume (K Unit), by Country 2025 & 2033
- Figure 65: Rest of the World Container Security Industry Revenue Share (%), by Country 2025 & 2033
- Figure 66: Rest of the World Container Security Industry Volume Share (%), by Country 2025 & 2033
List of Tables
- Table 1: Global Container Security Industry Revenue Million Forecast, by Organisation Size 2020 & 2033
- Table 2: Global Container Security Industry Volume K Unit Forecast, by Organisation Size 2020 & 2033
- Table 3: Global Container Security Industry Revenue Million Forecast, by Deployment 2020 & 2033
- Table 4: Global Container Security Industry Volume K Unit Forecast, by Deployment 2020 & 2033
- Table 5: Global Container Security Industry Revenue Million Forecast, by End-user Industry 2020 & 2033
- Table 6: Global Container Security Industry Volume K Unit Forecast, by End-user Industry 2020 & 2033
- Table 7: Global Container Security Industry Revenue Million Forecast, by Region 2020 & 2033
- Table 8: Global Container Security Industry Volume K Unit Forecast, by Region 2020 & 2033
- Table 9: Global Container Security Industry Revenue Million Forecast, by Organisation Size 2020 & 2033
- Table 10: Global Container Security Industry Volume K Unit Forecast, by Organisation Size 2020 & 2033
- Table 11: Global Container Security Industry Revenue Million Forecast, by Deployment 2020 & 2033
- Table 12: Global Container Security Industry Volume K Unit Forecast, by Deployment 2020 & 2033
- Table 13: Global Container Security Industry Revenue Million Forecast, by End-user Industry 2020 & 2033
- Table 14: Global Container Security Industry Volume K Unit Forecast, by End-user Industry 2020 & 2033
- Table 15: Global Container Security Industry Revenue Million Forecast, by Country 2020 & 2033
- Table 16: Global Container Security Industry Volume K Unit Forecast, by Country 2020 & 2033
- Table 17: United States Container Security Industry Revenue (Million) Forecast, by Application 2020 & 2033
- Table 18: United States Container Security Industry Volume (K Unit) Forecast, by Application 2020 & 2033
- Table 19: Canada Container Security Industry Revenue (Million) Forecast, by Application 2020 & 2033
- Table 20: Canada Container Security Industry Volume (K Unit) Forecast, by Application 2020 & 2033
- Table 21: Global Container Security Industry Revenue Million Forecast, by Organisation Size 2020 & 2033
- Table 22: Global Container Security Industry Volume K Unit Forecast, by Organisation Size 2020 & 2033
- Table 23: Global Container Security Industry Revenue Million Forecast, by Deployment 2020 & 2033
- Table 24: Global Container Security Industry Volume K Unit Forecast, by Deployment 2020 & 2033
- Table 25: Global Container Security Industry Revenue Million Forecast, by End-user Industry 2020 & 2033
- Table 26: Global Container Security Industry Volume K Unit Forecast, by End-user Industry 2020 & 2033
- Table 27: Global Container Security Industry Revenue Million Forecast, by Country 2020 & 2033
- Table 28: Global Container Security Industry Volume K Unit Forecast, by Country 2020 & 2033
- Table 29: United Kingdom Container Security Industry Revenue (Million) Forecast, by Application 2020 & 2033
- Table 30: United Kingdom Container Security Industry Volume (K Unit) Forecast, by Application 2020 & 2033
- Table 31: Germany Container Security Industry Revenue (Million) Forecast, by Application 2020 & 2033
- Table 32: Germany Container Security Industry Volume (K Unit) Forecast, by Application 2020 & 2033
- Table 33: Rest of Europe Container Security Industry Revenue (Million) Forecast, by Application 2020 & 2033
- Table 34: Rest of Europe Container Security Industry Volume (K Unit) Forecast, by Application 2020 & 2033
- Table 35: Global Container Security Industry Revenue Million Forecast, by Organisation Size 2020 & 2033
- Table 36: Global Container Security Industry Volume K Unit Forecast, by Organisation Size 2020 & 2033
- Table 37: Global Container Security Industry Revenue Million Forecast, by Deployment 2020 & 2033
- Table 38: Global Container Security Industry Volume K Unit Forecast, by Deployment 2020 & 2033
- Table 39: Global Container Security Industry Revenue Million Forecast, by End-user Industry 2020 & 2033
- Table 40: Global Container Security Industry Volume K Unit Forecast, by End-user Industry 2020 & 2033
- Table 41: Global Container Security Industry Revenue Million Forecast, by Country 2020 & 2033
- Table 42: Global Container Security Industry Volume K Unit Forecast, by Country 2020 & 2033
- Table 43: China Container Security Industry Revenue (Million) Forecast, by Application 2020 & 2033
- Table 44: China Container Security Industry Volume (K Unit) Forecast, by Application 2020 & 2033
- Table 45: Japan Container Security Industry Revenue (Million) Forecast, by Application 2020 & 2033
- Table 46: Japan Container Security Industry Volume (K Unit) Forecast, by Application 2020 & 2033
- Table 47: Rest of Asia Pacific Container Security Industry Revenue (Million) Forecast, by Application 2020 & 2033
- Table 48: Rest of Asia Pacific Container Security Industry Volume (K Unit) Forecast, by Application 2020 & 2033
- Table 49: Global Container Security Industry Revenue Million Forecast, by Organisation Size 2020 & 2033
- Table 50: Global Container Security Industry Volume K Unit Forecast, by Organisation Size 2020 & 2033
- Table 51: Global Container Security Industry Revenue Million Forecast, by Deployment 2020 & 2033
- Table 52: Global Container Security Industry Volume K Unit Forecast, by Deployment 2020 & 2033
- Table 53: Global Container Security Industry Revenue Million Forecast, by End-user Industry 2020 & 2033
- Table 54: Global Container Security Industry Volume K Unit Forecast, by End-user Industry 2020 & 2033
- Table 55: Global Container Security Industry Revenue Million Forecast, by Country 2020 & 2033
- Table 56: Global Container Security Industry Volume K Unit Forecast, by Country 2020 & 2033
- Table 57: Latin America Container Security Industry Revenue (Million) Forecast, by Application 2020 & 2033
- Table 58: Latin America Container Security Industry Volume (K Unit) Forecast, by Application 2020 & 2033
- Table 59: Middle East Container Security Industry Revenue (Million) Forecast, by Application 2020 & 2033
- Table 60: Middle East Container Security Industry Volume (K Unit) Forecast, by Application 2020 & 2033
Frequently Asked Questions
1. What is the projected Compound Annual Growth Rate (CAGR) of the Container Security Industry?
The projected CAGR is approximately 22.54%.
2. Which companies are prominent players in the Container Security Industry?
Key companies in the market include Thales eSecurity (Thales Group), NeuVector Inc (SUSE Software Solutions Germany GmbH), Mirantis Inc (Docker Inc ), Google LLC (Alphabet Inc ), Fidelis Cybersecurity Inc , Red Hat Inc, Trend Micro Incorporated, Rapid7 Inc, Qualys Inc, Aqua Security Software Ltd, Palo Alto Networks Inc.
3. What are the main segments of the Container Security Industry?
The market segments include Organisation Size, Deployment, End-user Industry.
4. Can you provide details about the market size?
The market size is estimated to be USD 3.28 Million as of 2022.
5. What are some drivers contributing to market growth?
Rising Adoption of the Hybrid Cloud Technology Applications; Growing Vulnerability Concern across the Container Architecture.
6. What are the notable trends driving market growth?
Rising Adoption of the Hybrid Cloud Technology Applications may Drive the Market Growth.
7. Are there any restraints impacting market growth?
Complexity in Managing the Cloud Environments; Inadequate Budgets in SMEs and Lack of Technical Expertise.
8. Can you provide examples of recent developments in the market?
October 2022: Veracode, a prominent global supplier of application security testing solutions, announced the addition of container security to its Continuous Software Security Platform. Existing clients can now participate in the Veracode Container Security early access program. The new Veracode Container Security service addresses the need for vulnerability scanning, secure configuration, and secrets management for container images.
9. What pricing options are available for accessing the report?
Pricing options include single-user, multi-user, and enterprise licenses priced at USD 4750, USD 5250, and USD 8750 respectively.
10. Is the market size provided in terms of value or volume?
The market size is provided in terms of value, measured in Million and volume, measured in K Unit.
11. Are there any specific market keywords associated with the report?
Yes, the market keyword associated with the report is "Container Security Industry," which aids in identifying and referencing the specific market segment covered.
12. How do I determine which pricing option suits my needs best?
The pricing options vary based on user requirements and access needs. Individual users may opt for single-user licenses, while businesses requiring broader access may choose multi-user or enterprise licenses for cost-effective access to the report.
13. Are there any additional resources or data provided in the Container Security Industry report?
While the report offers comprehensive insights, it's advisable to review the specific contents or supplementary materials provided to ascertain if additional resources or data are available.
14. How can I stay updated on further developments or reports in the Container Security Industry?
To stay informed about further developments, trends, and reports in the Container Security Industry, consider subscribing to industry newsletters, following relevant companies and organizations, or regularly checking reputable industry news sources and publications.
Methodology
Step 1 - Identification of Relevant Samples Size from Population Database


Step 2 - Approaches for Defining Global Market Size (Value, Volume* & Price*)

Note*: In applicable scenarios
Step 3 - Data Sources
Primary Research
- Web Analytics
- Survey Reports
- Research Institute
- Latest Research Reports
- Opinion Leaders
Secondary Research
- Annual Reports
- White Paper
- Latest Press Release
- Industry Association
- Paid Database
- Investor Presentations

Step 4 - Data Triangulation
Involves using different sources of information in order to increase the validity of a study
These sources are likely to be stakeholders in a program - participants, other researchers, program staff, other community members, and so on.
Then we put all data in single framework & apply various statistical tools to find out the dynamic on the market.
During the analysis stage, feedback from the stakeholder groups would be compared to determine areas of agreement as well as areas of divergence