

Key Insights
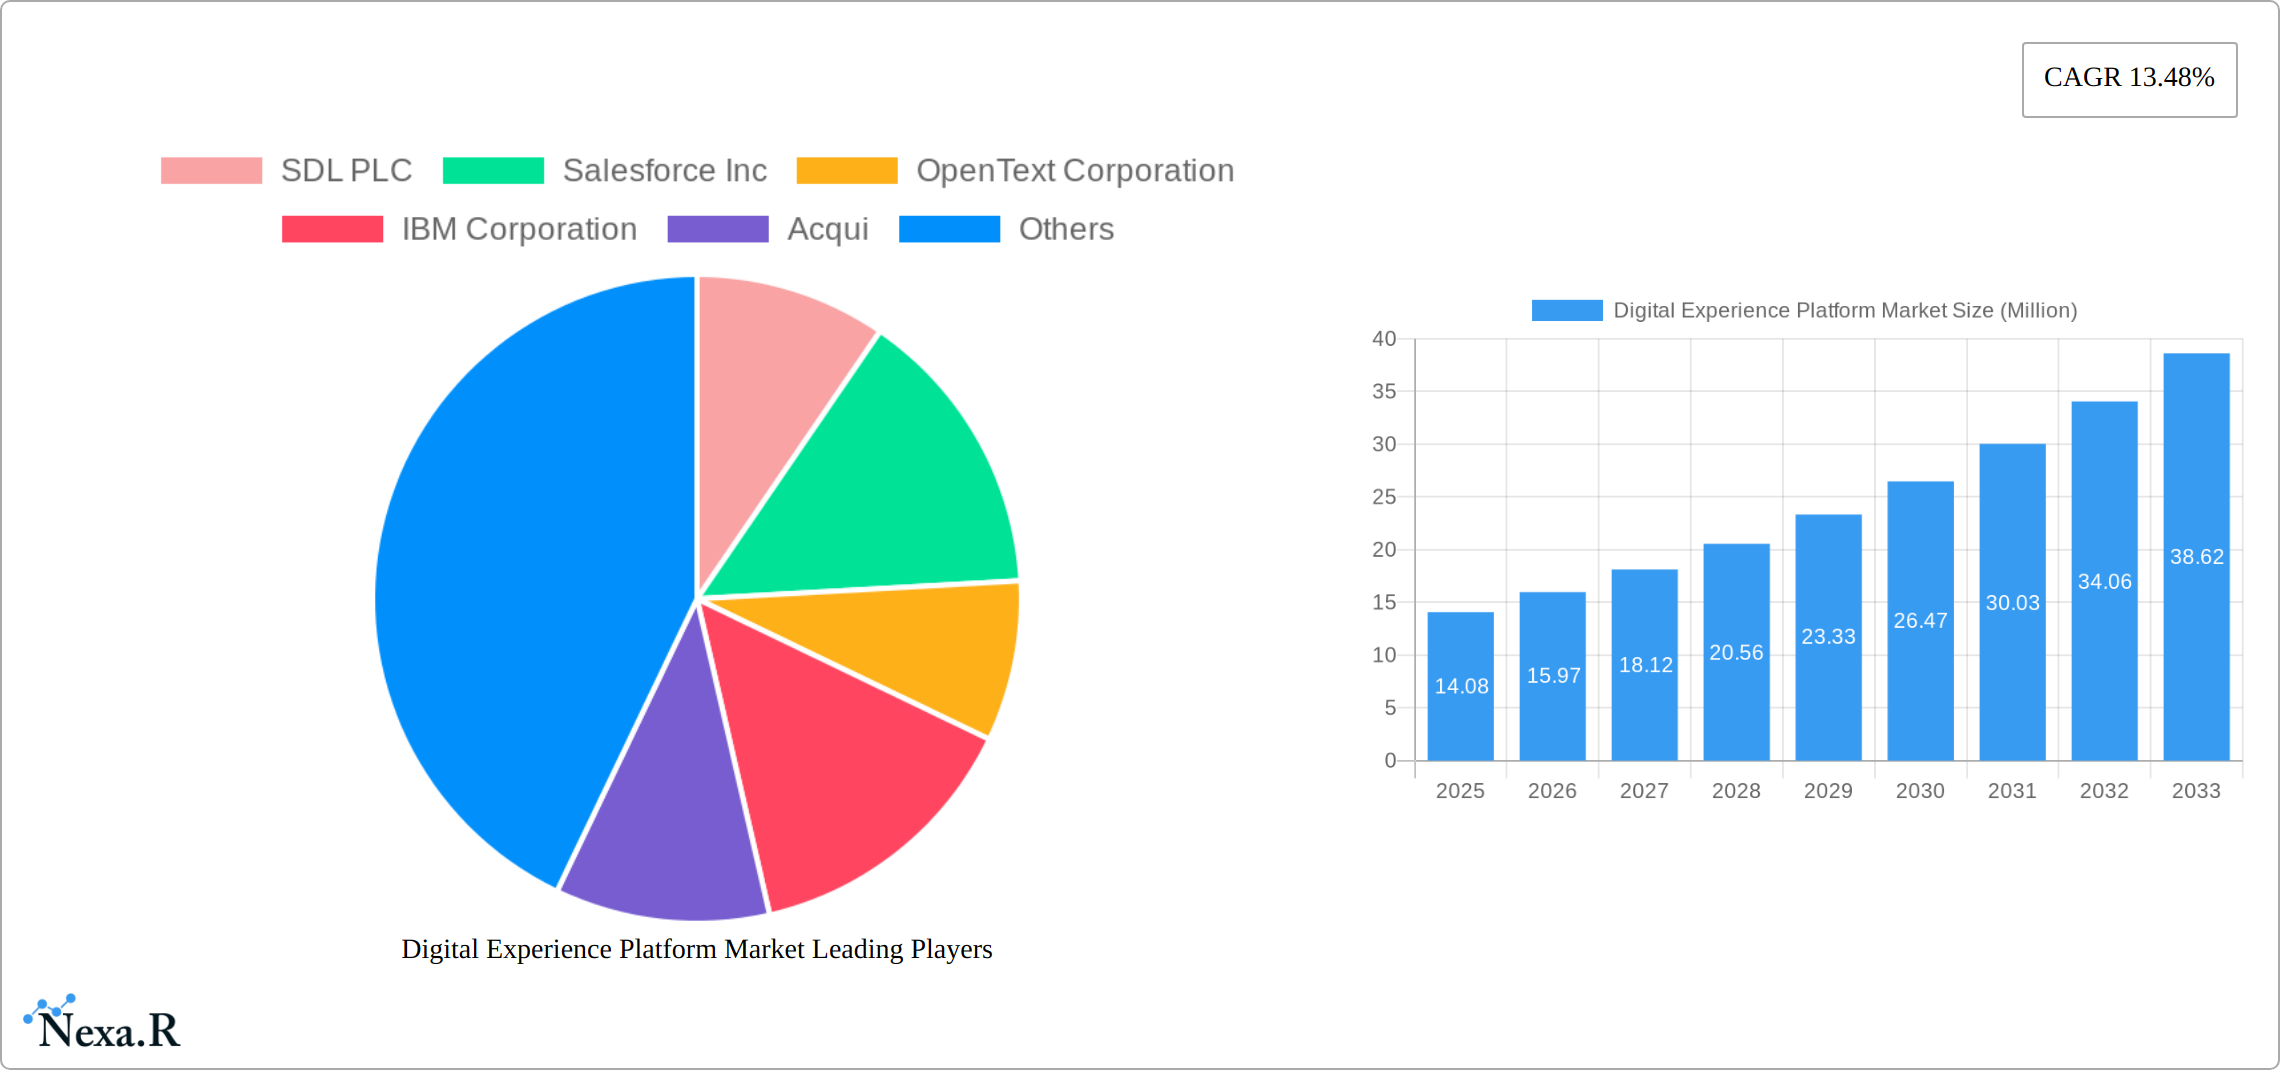
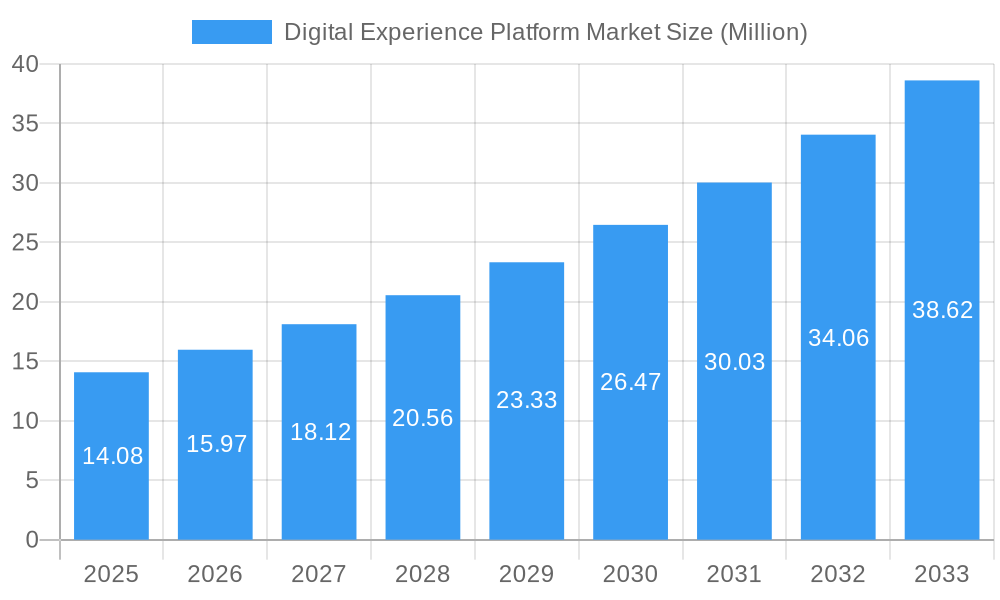
The Digital Experience Platform Market is poised for significant growth, with a projected market size of $14.08 million by 2025 and a robust CAGR of 13.48% from 2025 to 2033. Key drivers of this market include the increasing demand for personalized customer experiences and the integration of advanced technologies such as AI and machine learning into digital platforms. Major trends shaping the market include the shift towards cloud-based solutions and the growing importance of omnichannel strategies. These trends are fueled by the need for businesses to enhance customer engagement across various touchpoints. Restraints include high initial costs and concerns over data security, which could hinder market expansion. The market is segmented by component into platforms and services, by deployment type into on-premise and cloud, and by end users including retail, IT and telecom, BFSI, healthcare, and others. Leading companies such as SDL PLC, Salesforce Inc, OpenText Corporation, IBM Corporation, Microsoft Corporation, Adobe Inc, Oracle Corporation, Sitecore, and SAP SE are at the forefront of innovation and market penetration.
Digital Experience Platform Market Market Size (In Million)
Regionally, North America holds the largest market share, driven by the presence of major technology companies and early adoption of digital experience platforms. Europe follows closely, with countries like Germany, the United Kingdom, and France showing significant growth due to the emphasis on digital transformation across various industries. The Asia Pacific region is expected to witness the highest growth rate, propelled by rapid digitalization in countries such as China, Japan, and India. South America and the Middle East and Africa are also anticipated to see steady growth, supported by increasing investments in digital infrastructure. The study period spans from 2019 to 2033, with the base year and estimated year both set for 2025, and the forecast period extending from 2025 to 2033. The historical period from 2019 to 2024 provides a comprehensive backdrop for understanding market evolution and future projections.
Digital Experience Platform Market Company Market Share
Digital Experience Platform (DXP) Market: A Comprehensive Report (2019-2033)
This in-depth report provides a comprehensive analysis of the Digital Experience Platform (DXP) market, encompassing market dynamics, growth trends, regional dominance, product landscape, key players, and future outlook. The study period covers 2019-2033, with 2025 as the base and estimated year. The report segments the market by component (Platform, Services), deployment type (On-Premise, Cloud), and end-user (Retail, IT & Telecom, BFSI, Healthcare, Other). Projected market values are presented in millions of units.
Digital Experience Platform Market Dynamics & Structure
The DXP market is characterized by moderate concentration, with several major players holding significant market share. However, the emergence of niche players and innovative solutions is fostering a dynamic competitive landscape. Technological advancements, particularly in AI, machine learning, and cloud computing, are key innovation drivers. Regulatory frameworks related to data privacy and security significantly impact market dynamics. The market also witnesses substantial M&A activity, as larger players strategically acquire smaller companies to expand their capabilities and market reach. Competitive product substitutes include custom-built solutions and legacy systems, posing a challenge to DXP providers. End-user demographics are shifting towards digitally savvy consumers demanding seamless and personalized experiences.
- Market Concentration: Moderately concentrated, with top 5 players holding xx% market share (2024).
- M&A Activity: xx deals recorded between 2019-2024, with an average deal value of xx million.
- Innovation Barriers: High initial investment costs, integration complexities, and skill gap in DXP implementation.
- Regulatory Landscape: Compliance with GDPR, CCPA, and other data privacy regulations influence DXP adoption.
Digital Experience Platform Market Growth Trends & Insights
The DXP market experienced robust growth during the historical period (2019-2024), driven by increasing digital transformation initiatives across various industries. The market size expanded from xx million in 2019 to xx million in 2024, exhibiting a CAGR of xx%. Cloud-based DXP solutions are witnessing significant adoption due to their scalability, flexibility, and cost-effectiveness. Technological disruptions, such as the rise of headless commerce and the increasing importance of personalization, are reshaping the DXP landscape. Consumer behavior shifts towards omnichannel engagement and personalized experiences further fuel market growth. The forecast period (2025-2033) projects continued growth, with a projected market size of xx million in 2033 and a CAGR of xx%. Market penetration is expected to reach xx% by 2033.
Dominant Regions, Countries, or Segments in Digital Experience Platform Market
North America currently holds a leading position in the Digital Experience Platform (DXP) market, fueled by its robust digital infrastructure, high technological adoption rates, and a significant number of early adopters. However, the Asia-Pacific region is poised for the most rapid growth throughout the forecast period, driven by accelerating digital transformation initiatives and substantial investments in technological infrastructure. Within market segments, cloud-based DXPs are experiencing the most significant growth, surpassing on-premise solutions in market share. The Banking, Financial Services, and Insurance (BFSI) sector, along with the Retail industry, represent key end-user segments demanding sophisticated DXP solutions to enhance customer engagement and streamline operational efficiency. This demand is further fueled by the increasing need for personalized experiences and seamless omnichannel interactions.
- Key Drivers (North America): Advanced digital infrastructure, high rate of technology adoption, early DXP adoption, and a mature market for digital solutions.
- Key Drivers (Asia-Pacific): Rapid digitalization, substantial increases in technology infrastructure investment, expanding internet penetration, and a growing population of digitally engaged consumers.
- Segment Dominance: Cloud deployment models and the BFSI and Retail end-user segments exhibit the strongest growth potential, signifying a preference for scalable and flexible solutions.
- Market Share (Illustrative, 2024): While precise figures require proprietary market research data, North America holds a substantial market share, followed by Europe and then Asia-Pacific. The exact percentages are unavailable at this time but are expected to be significantly different based on the research firm and metrics used.
Digital Experience Platform Market Product Landscape
DXP solutions are increasingly incorporating advanced features like AI-powered personalization, headless architecture, and omnichannel integration. These innovations enhance user experience, improve operational efficiency, and provide valuable customer insights. Key performance indicators (KPIs) include customer satisfaction, conversion rates, website traffic, and engagement metrics. Unique selling propositions (USPs) often revolve around ease of use, seamless integrations, and robust security features. Continuous technological advancements are driving the evolution of DXP solutions, offering enhanced capabilities and improved user experiences.
Key Drivers, Barriers & Challenges in Digital Experience Platform Market
Key Drivers: The increasing need for personalized customer experiences, digital transformation initiatives across various sectors, and the rise of omnichannel strategies are driving DXP adoption. Furthermore, technological advancements in AI, machine learning, and cloud computing are fueling innovation in the DXP market.
Key Challenges: High implementation costs, integration complexities, security concerns, and the need for skilled professionals are significant barriers to DXP adoption. The competitive landscape, with the presence of both large established players and agile startups, creates challenges for market penetration and retention. Supply chain disruptions can impact the availability of DXP components.
Emerging Opportunities in Digital Experience Platform Market
Significant opportunities exist in expanding into underserved markets, such as small and medium-sized enterprises (SMEs) in developing economies. The development of specialized DXP solutions tailored to the unique needs of niche industries presents another promising avenue for growth. Leveraging emerging technologies like Web3 and the metaverse to create immersive and engaging digital experiences is rapidly becoming a key differentiator. The increasing demand for highly personalized experiences and AI-powered functionalities creates substantial avenues for growth. Furthermore, companies offering seamless integration with existing enterprise systems will maintain a competitive edge.
Growth Accelerators in the Digital Experience Platform Market Industry
Strategic collaborations between DXP vendors and technology providers are crucial for accelerating market expansion by facilitating seamless integration and broadening reach. Technological advancements, particularly in artificial intelligence (AI) and machine learning (ML), are enhancing DXP capabilities, thus driving increased adoption rates. Expansion strategies focused on untapped markets and emerging economies will unlock significant growth potential. Prioritizing exceptional customer support and comprehensive training programs will enhance customer satisfaction and build brand loyalty.
Key Players Shaping the Digital Experience Platform Market Market
Notable Milestones in Digital Experience Platform Market Sector
- September 2022: KeyBank partnered with Oracle to modernize its consumer lending process, demonstrating the transformative impact of DXPs within the BFSI sector.
- December 2022: The Bank of Thailand adopted Oracle Fusion Cloud HCM, highlighting the growing adoption of DXPs for Human Resource Management (HRM).
- December 2022: Oracle launched a new cloud region in Chicago, expanding its cloud infrastructure and bolstering its DXP offerings.
In-Depth Digital Experience Platform Market Market Outlook
The DXP market is poised for continued growth, driven by ongoing digital transformation efforts and the increasing demand for personalized and seamless digital experiences. Strategic partnerships, technological advancements, and expansion into new markets will be key factors shaping the future of the DXP market. Companies that successfully adapt to evolving consumer preferences and leverage emerging technologies will gain a competitive edge and capture significant market share. The long-term outlook remains positive, with substantial growth potential in the coming years.
Digital Experience Platform Market Segmentation
-
1. Component
- 1.1. Platform
- 1.2. Services
-
2. Deployment Type
- 2.1. On-Premise
- 2.2. Cloud
-
3. End Users
- 3.1. Retail
- 3.2. IT and Telecom
- 3.3. BFSI
- 3.4. Healthcare
- 3.5. Other End Users
Digital Experience Platform Market Segmentation By Geography
- 1. North America
- 2. Europe
- 3. Asia
- 4. Australia and New Zealand
- 5. Latin America
- 6. Middle East and Africa
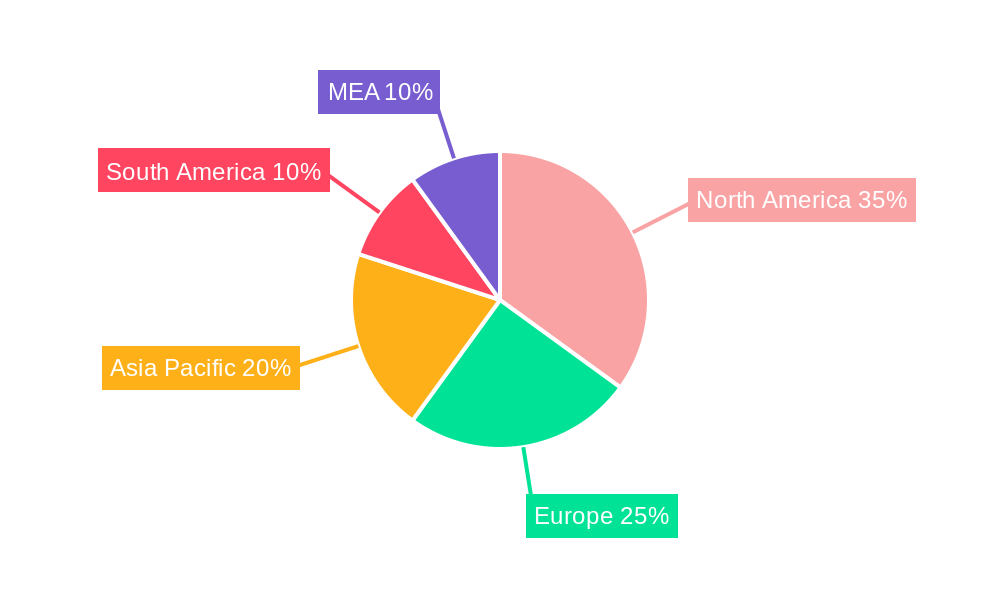
Digital Experience Platform Market Regional Market Share
Geographic Coverage of Digital Experience Platform Market
Digital Experience Platform Market REPORT HIGHLIGHTS
| Aspects | Details |
|---|---|
| Study Period | 2020-2034 |
| Base Year | 2025 |
| Estimated Year | 2026 |
| Forecast Period | 2026-2034 |
| Historical Period | 2020-2025 |
| Growth Rate | CAGR of 13.48% from 2020-2034 |
| Segmentation |
|
Table of Contents
- 1. Introduction
- 1.1. Research Scope
- 1.2. Market Segmentation
- 1.3. Research Objective
- 1.4. Definitions and Assumptions
- 2. Executive Summary
- 2.1. Market Snapshot
- 3. Market Dynamics
- 3.1. Market Drivers
- 3.2. Market Restrains
- 3.3. Market Trends
- 3.4. Market Opportunities
- 4. Market Factor Analysis
- 4.1. Porters Five Forces
- 4.1.1. Bargaining Power of Suppliers
- 4.1.2. Bargaining Power of Buyers
- 4.1.3. Threat of New Entrants
- 4.1.4. Threat of Substitutes
- 4.1.5. Competitive Rivalry
- 4.2. PESTEL analysis
- 4.3. BCG Analysis
- 4.3.1. Stars (High Growth, High Market Share)
- 4.3.2. Cash Cows (Low Growth, High Market Share)
- 4.3.3. Question Mark (High Growth, Low Market Share)
- 4.3.4. Dogs (Low Growth, Low Market Share)
- 4.4. Ansoff Matrix Analysis
- 4.5. Supply Chain Analysis
- 4.6. Regulatory Landscape
- 4.7. Current Market Potential and Opportunity Assessment (TAM–SAM–SOM Framework)
- 4.8. NRP Analyst Note
- 4.1. Porters Five Forces
- 5. Market Analysis, Insights and Forecast 2021-2033
- 5.1. Market Analysis, Insights and Forecast - by Component
- 5.1.1. Platform
- 5.1.2. Services
- 5.2. Market Analysis, Insights and Forecast - by Deployment Type
- 5.2.1. On-Premise
- 5.2.2. Cloud
- 5.3. Market Analysis, Insights and Forecast - by End Users
- 5.3.1. Retail
- 5.3.2. IT and Telecom
- 5.3.3. BFSI
- 5.3.4. Healthcare
- 5.3.5. Other End Users
- 5.4. Market Analysis, Insights and Forecast - by Region
- 5.4.1. North America
- 5.4.2. Europe
- 5.4.3. Asia
- 5.4.4. Australia and New Zealand
- 5.4.5. Latin America
- 5.4.6. Middle East and Africa
- 5.1. Market Analysis, Insights and Forecast - by Component
- 6. Global Digital Experience Platform Market Analysis, Insights and Forecast, 2021-2033
- 6.1. Market Analysis, Insights and Forecast - by Component
- 6.1.1. Platform
- 6.1.2. Services
- 6.2. Market Analysis, Insights and Forecast - by Deployment Type
- 6.2.1. On-Premise
- 6.2.2. Cloud
- 6.3. Market Analysis, Insights and Forecast - by End Users
- 6.3.1. Retail
- 6.3.2. IT and Telecom
- 6.3.3. BFSI
- 6.3.4. Healthcare
- 6.3.5. Other End Users
- 6.1. Market Analysis, Insights and Forecast - by Component
- 7. North America Digital Experience Platform Market Analysis, Insights and Forecast, 2020-2032
- 7.1. Market Analysis, Insights and Forecast - by Component
- 7.1.1. Platform
- 7.1.2. Services
- 7.2. Market Analysis, Insights and Forecast - by Deployment Type
- 7.2.1. On-Premise
- 7.2.2. Cloud
- 7.3. Market Analysis, Insights and Forecast - by End Users
- 7.3.1. Retail
- 7.3.2. IT and Telecom
- 7.3.3. BFSI
- 7.3.4. Healthcare
- 7.3.5. Other End Users
- 7.1. Market Analysis, Insights and Forecast - by Component
- 8. Europe Digital Experience Platform Market Analysis, Insights and Forecast, 2020-2032
- 8.1. Market Analysis, Insights and Forecast - by Component
- 8.1.1. Platform
- 8.1.2. Services
- 8.2. Market Analysis, Insights and Forecast - by Deployment Type
- 8.2.1. On-Premise
- 8.2.2. Cloud
- 8.3. Market Analysis, Insights and Forecast - by End Users
- 8.3.1. Retail
- 8.3.2. IT and Telecom
- 8.3.3. BFSI
- 8.3.4. Healthcare
- 8.3.5. Other End Users
- 8.1. Market Analysis, Insights and Forecast - by Component
- 9. Asia Digital Experience Platform Market Analysis, Insights and Forecast, 2020-2032
- 9.1. Market Analysis, Insights and Forecast - by Component
- 9.1.1. Platform
- 9.1.2. Services
- 9.2. Market Analysis, Insights and Forecast - by Deployment Type
- 9.2.1. On-Premise
- 9.2.2. Cloud
- 9.3. Market Analysis, Insights and Forecast - by End Users
- 9.3.1. Retail
- 9.3.2. IT and Telecom
- 9.3.3. BFSI
- 9.3.4. Healthcare
- 9.3.5. Other End Users
- 9.1. Market Analysis, Insights and Forecast - by Component
- 10. Australia and New Zealand Digital Experience Platform Market Analysis, Insights and Forecast, 2020-2032
- 10.1. Market Analysis, Insights and Forecast - by Component
- 10.1.1. Platform
- 10.1.2. Services
- 10.2. Market Analysis, Insights and Forecast - by Deployment Type
- 10.2.1. On-Premise
- 10.2.2. Cloud
- 10.3. Market Analysis, Insights and Forecast - by End Users
- 10.3.1. Retail
- 10.3.2. IT and Telecom
- 10.3.3. BFSI
- 10.3.4. Healthcare
- 10.3.5. Other End Users
- 10.1. Market Analysis, Insights and Forecast - by Component
- 11. Latin America Digital Experience Platform Market Analysis, Insights and Forecast, 2020-2032
- 11.1. Market Analysis, Insights and Forecast - by Component
- 11.1.1. Platform
- 11.1.2. Services
- 11.2. Market Analysis, Insights and Forecast - by Deployment Type
- 11.2.1. On-Premise
- 11.2.2. Cloud
- 11.3. Market Analysis, Insights and Forecast - by End Users
- 11.3.1. Retail
- 11.3.2. IT and Telecom
- 11.3.3. BFSI
- 11.3.4. Healthcare
- 11.3.5. Other End Users
- 11.1. Market Analysis, Insights and Forecast - by Component
- 12. Middle East and Africa Digital Experience Platform Market Analysis, Insights and Forecast, 2020-2032
- 12.1. Market Analysis, Insights and Forecast - by Component
- 12.1.1. Platform
- 12.1.2. Services
- 12.2. Market Analysis, Insights and Forecast - by Deployment Type
- 12.2.1. On-Premise
- 12.2.2. Cloud
- 12.3. Market Analysis, Insights and Forecast - by End Users
- 12.3.1. Retail
- 12.3.2. IT and Telecom
- 12.3.3. BFSI
- 12.3.4. Healthcare
- 12.3.5. Other End Users
- 12.1. Market Analysis, Insights and Forecast - by Component
- 13. Competitive Analysis
- 13.1. Company Profiles
- 13.1.1 SDL PLC
- 13.1.1.1. Company Overview
- 13.1.1.2. Products
- 13.1.1.3. Company Financials
- 13.1.1.4. SWOT Analysis
- 13.1.2 Salesforce Inc
- 13.1.2.1. Company Overview
- 13.1.2.2. Products
- 13.1.2.3. Company Financials
- 13.1.2.4. SWOT Analysis
- 13.1.3 OpenText Corporation
- 13.1.3.1. Company Overview
- 13.1.3.2. Products
- 13.1.3.3. Company Financials
- 13.1.3.4. SWOT Analysis
- 13.1.4 IBM Corporation
- 13.1.4.1. Company Overview
- 13.1.4.2. Products
- 13.1.4.3. Company Financials
- 13.1.4.4. SWOT Analysis
- 13.1.5 Acqui
- 13.1.5.1. Company Overview
- 13.1.5.2. Products
- 13.1.5.3. Company Financials
- 13.1.5.4. SWOT Analysis
- 13.1.6 Microsoft Corporation
- 13.1.6.1. Company Overview
- 13.1.6.2. Products
- 13.1.6.3. Company Financials
- 13.1.6.4. SWOT Analysis
- 13.1.7 Adobe Inc
- 13.1.7.1. Company Overview
- 13.1.7.2. Products
- 13.1.7.3. Company Financials
- 13.1.7.4. SWOT Analysis
- 13.1.8 Oracle Corporation
- 13.1.8.1. Company Overview
- 13.1.8.2. Products
- 13.1.8.3. Company Financials
- 13.1.8.4. SWOT Analysis
- 13.1.9 Sitecore
- 13.1.9.1. Company Overview
- 13.1.9.2. Products
- 13.1.9.3. Company Financials
- 13.1.9.4. SWOT Analysis
- 13.1.10 SAP SE
- 13.1.10.1. Company Overview
- 13.1.10.2. Products
- 13.1.10.3. Company Financials
- 13.1.10.4. SWOT Analysis
- 13.1.1 SDL PLC
- 13.2. Market Entropy
- 13.2.1 Company's Key Areas Served
- 13.2.2 Recent Developments
- 13.3. Company Market Share Analysis 2025
- 13.3.1 Top 5 Companies Market Share Analysis
- 13.3.2 Top 3 Companies Market Share Analysis
- 13.4. List of Potential Customers
- 14. Research Methodology
List of Figures
- Figure 1: Global Digital Experience Platform Market Revenue Breakdown (Million, %) by Region 2025 & 2033
- Figure 2: Global Digital Experience Platform Market Volume Breakdown (K Unit, %) by Region 2025 & 2033
- Figure 3: North America Digital Experience Platform Market Revenue (Million), by Component 2025 & 2033
- Figure 4: North America Digital Experience Platform Market Volume (K Unit), by Component 2025 & 2033
- Figure 5: North America Digital Experience Platform Market Revenue Share (%), by Component 2025 & 2033
- Figure 6: North America Digital Experience Platform Market Volume Share (%), by Component 2025 & 2033
- Figure 7: North America Digital Experience Platform Market Revenue (Million), by Deployment Type 2025 & 2033
- Figure 8: North America Digital Experience Platform Market Volume (K Unit), by Deployment Type 2025 & 2033
- Figure 9: North America Digital Experience Platform Market Revenue Share (%), by Deployment Type 2025 & 2033
- Figure 10: North America Digital Experience Platform Market Volume Share (%), by Deployment Type 2025 & 2033
- Figure 11: North America Digital Experience Platform Market Revenue (Million), by End Users 2025 & 2033
- Figure 12: North America Digital Experience Platform Market Volume (K Unit), by End Users 2025 & 2033
- Figure 13: North America Digital Experience Platform Market Revenue Share (%), by End Users 2025 & 2033
- Figure 14: North America Digital Experience Platform Market Volume Share (%), by End Users 2025 & 2033
- Figure 15: North America Digital Experience Platform Market Revenue (Million), by Country 2025 & 2033
- Figure 16: North America Digital Experience Platform Market Volume (K Unit), by Country 2025 & 2033
- Figure 17: North America Digital Experience Platform Market Revenue Share (%), by Country 2025 & 2033
- Figure 18: North America Digital Experience Platform Market Volume Share (%), by Country 2025 & 2033
- Figure 19: Europe Digital Experience Platform Market Revenue (Million), by Component 2025 & 2033
- Figure 20: Europe Digital Experience Platform Market Volume (K Unit), by Component 2025 & 2033
- Figure 21: Europe Digital Experience Platform Market Revenue Share (%), by Component 2025 & 2033
- Figure 22: Europe Digital Experience Platform Market Volume Share (%), by Component 2025 & 2033
- Figure 23: Europe Digital Experience Platform Market Revenue (Million), by Deployment Type 2025 & 2033
- Figure 24: Europe Digital Experience Platform Market Volume (K Unit), by Deployment Type 2025 & 2033
- Figure 25: Europe Digital Experience Platform Market Revenue Share (%), by Deployment Type 2025 & 2033
- Figure 26: Europe Digital Experience Platform Market Volume Share (%), by Deployment Type 2025 & 2033
- Figure 27: Europe Digital Experience Platform Market Revenue (Million), by End Users 2025 & 2033
- Figure 28: Europe Digital Experience Platform Market Volume (K Unit), by End Users 2025 & 2033
- Figure 29: Europe Digital Experience Platform Market Revenue Share (%), by End Users 2025 & 2033
- Figure 30: Europe Digital Experience Platform Market Volume Share (%), by End Users 2025 & 2033
- Figure 31: Europe Digital Experience Platform Market Revenue (Million), by Country 2025 & 2033
- Figure 32: Europe Digital Experience Platform Market Volume (K Unit), by Country 2025 & 2033
- Figure 33: Europe Digital Experience Platform Market Revenue Share (%), by Country 2025 & 2033
- Figure 34: Europe Digital Experience Platform Market Volume Share (%), by Country 2025 & 2033
- Figure 35: Asia Digital Experience Platform Market Revenue (Million), by Component 2025 & 2033
- Figure 36: Asia Digital Experience Platform Market Volume (K Unit), by Component 2025 & 2033
- Figure 37: Asia Digital Experience Platform Market Revenue Share (%), by Component 2025 & 2033
- Figure 38: Asia Digital Experience Platform Market Volume Share (%), by Component 2025 & 2033
- Figure 39: Asia Digital Experience Platform Market Revenue (Million), by Deployment Type 2025 & 2033
- Figure 40: Asia Digital Experience Platform Market Volume (K Unit), by Deployment Type 2025 & 2033
- Figure 41: Asia Digital Experience Platform Market Revenue Share (%), by Deployment Type 2025 & 2033
- Figure 42: Asia Digital Experience Platform Market Volume Share (%), by Deployment Type 2025 & 2033
- Figure 43: Asia Digital Experience Platform Market Revenue (Million), by End Users 2025 & 2033
- Figure 44: Asia Digital Experience Platform Market Volume (K Unit), by End Users 2025 & 2033
- Figure 45: Asia Digital Experience Platform Market Revenue Share (%), by End Users 2025 & 2033
- Figure 46: Asia Digital Experience Platform Market Volume Share (%), by End Users 2025 & 2033
- Figure 47: Asia Digital Experience Platform Market Revenue (Million), by Country 2025 & 2033
- Figure 48: Asia Digital Experience Platform Market Volume (K Unit), by Country 2025 & 2033
- Figure 49: Asia Digital Experience Platform Market Revenue Share (%), by Country 2025 & 2033
- Figure 50: Asia Digital Experience Platform Market Volume Share (%), by Country 2025 & 2033
- Figure 51: Australia and New Zealand Digital Experience Platform Market Revenue (Million), by Component 2025 & 2033
- Figure 52: Australia and New Zealand Digital Experience Platform Market Volume (K Unit), by Component 2025 & 2033
- Figure 53: Australia and New Zealand Digital Experience Platform Market Revenue Share (%), by Component 2025 & 2033
- Figure 54: Australia and New Zealand Digital Experience Platform Market Volume Share (%), by Component 2025 & 2033
- Figure 55: Australia and New Zealand Digital Experience Platform Market Revenue (Million), by Deployment Type 2025 & 2033
- Figure 56: Australia and New Zealand Digital Experience Platform Market Volume (K Unit), by Deployment Type 2025 & 2033
- Figure 57: Australia and New Zealand Digital Experience Platform Market Revenue Share (%), by Deployment Type 2025 & 2033
- Figure 58: Australia and New Zealand Digital Experience Platform Market Volume Share (%), by Deployment Type 2025 & 2033
- Figure 59: Australia and New Zealand Digital Experience Platform Market Revenue (Million), by End Users 2025 & 2033
- Figure 60: Australia and New Zealand Digital Experience Platform Market Volume (K Unit), by End Users 2025 & 2033
- Figure 61: Australia and New Zealand Digital Experience Platform Market Revenue Share (%), by End Users 2025 & 2033
- Figure 62: Australia and New Zealand Digital Experience Platform Market Volume Share (%), by End Users 2025 & 2033
- Figure 63: Australia and New Zealand Digital Experience Platform Market Revenue (Million), by Country 2025 & 2033
- Figure 64: Australia and New Zealand Digital Experience Platform Market Volume (K Unit), by Country 2025 & 2033
- Figure 65: Australia and New Zealand Digital Experience Platform Market Revenue Share (%), by Country 2025 & 2033
- Figure 66: Australia and New Zealand Digital Experience Platform Market Volume Share (%), by Country 2025 & 2033
- Figure 67: Latin America Digital Experience Platform Market Revenue (Million), by Component 2025 & 2033
- Figure 68: Latin America Digital Experience Platform Market Volume (K Unit), by Component 2025 & 2033
- Figure 69: Latin America Digital Experience Platform Market Revenue Share (%), by Component 2025 & 2033
- Figure 70: Latin America Digital Experience Platform Market Volume Share (%), by Component 2025 & 2033
- Figure 71: Latin America Digital Experience Platform Market Revenue (Million), by Deployment Type 2025 & 2033
- Figure 72: Latin America Digital Experience Platform Market Volume (K Unit), by Deployment Type 2025 & 2033
- Figure 73: Latin America Digital Experience Platform Market Revenue Share (%), by Deployment Type 2025 & 2033
- Figure 74: Latin America Digital Experience Platform Market Volume Share (%), by Deployment Type 2025 & 2033
- Figure 75: Latin America Digital Experience Platform Market Revenue (Million), by End Users 2025 & 2033
- Figure 76: Latin America Digital Experience Platform Market Volume (K Unit), by End Users 2025 & 2033
- Figure 77: Latin America Digital Experience Platform Market Revenue Share (%), by End Users 2025 & 2033
- Figure 78: Latin America Digital Experience Platform Market Volume Share (%), by End Users 2025 & 2033
- Figure 79: Latin America Digital Experience Platform Market Revenue (Million), by Country 2025 & 2033
- Figure 80: Latin America Digital Experience Platform Market Volume (K Unit), by Country 2025 & 2033
- Figure 81: Latin America Digital Experience Platform Market Revenue Share (%), by Country 2025 & 2033
- Figure 82: Latin America Digital Experience Platform Market Volume Share (%), by Country 2025 & 2033
- Figure 83: Middle East and Africa Digital Experience Platform Market Revenue (Million), by Component 2025 & 2033
- Figure 84: Middle East and Africa Digital Experience Platform Market Volume (K Unit), by Component 2025 & 2033
- Figure 85: Middle East and Africa Digital Experience Platform Market Revenue Share (%), by Component 2025 & 2033
- Figure 86: Middle East and Africa Digital Experience Platform Market Volume Share (%), by Component 2025 & 2033
- Figure 87: Middle East and Africa Digital Experience Platform Market Revenue (Million), by Deployment Type 2025 & 2033
- Figure 88: Middle East and Africa Digital Experience Platform Market Volume (K Unit), by Deployment Type 2025 & 2033
- Figure 89: Middle East and Africa Digital Experience Platform Market Revenue Share (%), by Deployment Type 2025 & 2033
- Figure 90: Middle East and Africa Digital Experience Platform Market Volume Share (%), by Deployment Type 2025 & 2033
- Figure 91: Middle East and Africa Digital Experience Platform Market Revenue (Million), by End Users 2025 & 2033
- Figure 92: Middle East and Africa Digital Experience Platform Market Volume (K Unit), by End Users 2025 & 2033
- Figure 93: Middle East and Africa Digital Experience Platform Market Revenue Share (%), by End Users 2025 & 2033
- Figure 94: Middle East and Africa Digital Experience Platform Market Volume Share (%), by End Users 2025 & 2033
- Figure 95: Middle East and Africa Digital Experience Platform Market Revenue (Million), by Country 2025 & 2033
- Figure 96: Middle East and Africa Digital Experience Platform Market Volume (K Unit), by Country 2025 & 2033
- Figure 97: Middle East and Africa Digital Experience Platform Market Revenue Share (%), by Country 2025 & 2033
- Figure 98: Middle East and Africa Digital Experience Platform Market Volume Share (%), by Country 2025 & 2033
List of Tables
- Table 1: Global Digital Experience Platform Market Revenue Million Forecast, by Component 2020 & 2033
- Table 2: Global Digital Experience Platform Market Volume K Unit Forecast, by Component 2020 & 2033
- Table 3: Global Digital Experience Platform Market Revenue Million Forecast, by Deployment Type 2020 & 2033
- Table 4: Global Digital Experience Platform Market Volume K Unit Forecast, by Deployment Type 2020 & 2033
- Table 5: Global Digital Experience Platform Market Revenue Million Forecast, by End Users 2020 & 2033
- Table 6: Global Digital Experience Platform Market Volume K Unit Forecast, by End Users 2020 & 2033
- Table 7: Global Digital Experience Platform Market Revenue Million Forecast, by Region 2020 & 2033
- Table 8: Global Digital Experience Platform Market Volume K Unit Forecast, by Region 2020 & 2033
- Table 9: Global Digital Experience Platform Market Revenue Million Forecast, by Component 2020 & 2033
- Table 10: Global Digital Experience Platform Market Volume K Unit Forecast, by Component 2020 & 2033
- Table 11: Global Digital Experience Platform Market Revenue Million Forecast, by Deployment Type 2020 & 2033
- Table 12: Global Digital Experience Platform Market Volume K Unit Forecast, by Deployment Type 2020 & 2033
- Table 13: Global Digital Experience Platform Market Revenue Million Forecast, by End Users 2020 & 2033
- Table 14: Global Digital Experience Platform Market Volume K Unit Forecast, by End Users 2020 & 2033
- Table 15: Global Digital Experience Platform Market Revenue Million Forecast, by Country 2020 & 2033
- Table 16: Global Digital Experience Platform Market Volume K Unit Forecast, by Country 2020 & 2033
- Table 17: Global Digital Experience Platform Market Revenue Million Forecast, by Component 2020 & 2033
- Table 18: Global Digital Experience Platform Market Volume K Unit Forecast, by Component 2020 & 2033
- Table 19: Global Digital Experience Platform Market Revenue Million Forecast, by Deployment Type 2020 & 2033
- Table 20: Global Digital Experience Platform Market Volume K Unit Forecast, by Deployment Type 2020 & 2033
- Table 21: Global Digital Experience Platform Market Revenue Million Forecast, by End Users 2020 & 2033
- Table 22: Global Digital Experience Platform Market Volume K Unit Forecast, by End Users 2020 & 2033
- Table 23: Global Digital Experience Platform Market Revenue Million Forecast, by Country 2020 & 2033
- Table 24: Global Digital Experience Platform Market Volume K Unit Forecast, by Country 2020 & 2033
- Table 25: Global Digital Experience Platform Market Revenue Million Forecast, by Component 2020 & 2033
- Table 26: Global Digital Experience Platform Market Volume K Unit Forecast, by Component 2020 & 2033
- Table 27: Global Digital Experience Platform Market Revenue Million Forecast, by Deployment Type 2020 & 2033
- Table 28: Global Digital Experience Platform Market Volume K Unit Forecast, by Deployment Type 2020 & 2033
- Table 29: Global Digital Experience Platform Market Revenue Million Forecast, by End Users 2020 & 2033
- Table 30: Global Digital Experience Platform Market Volume K Unit Forecast, by End Users 2020 & 2033
- Table 31: Global Digital Experience Platform Market Revenue Million Forecast, by Country 2020 & 2033
- Table 32: Global Digital Experience Platform Market Volume K Unit Forecast, by Country 2020 & 2033
- Table 33: Global Digital Experience Platform Market Revenue Million Forecast, by Component 2020 & 2033
- Table 34: Global Digital Experience Platform Market Volume K Unit Forecast, by Component 2020 & 2033
- Table 35: Global Digital Experience Platform Market Revenue Million Forecast, by Deployment Type 2020 & 2033
- Table 36: Global Digital Experience Platform Market Volume K Unit Forecast, by Deployment Type 2020 & 2033
- Table 37: Global Digital Experience Platform Market Revenue Million Forecast, by End Users 2020 & 2033
- Table 38: Global Digital Experience Platform Market Volume K Unit Forecast, by End Users 2020 & 2033
- Table 39: Global Digital Experience Platform Market Revenue Million Forecast, by Country 2020 & 2033
- Table 40: Global Digital Experience Platform Market Volume K Unit Forecast, by Country 2020 & 2033
- Table 41: Global Digital Experience Platform Market Revenue Million Forecast, by Component 2020 & 2033
- Table 42: Global Digital Experience Platform Market Volume K Unit Forecast, by Component 2020 & 2033
- Table 43: Global Digital Experience Platform Market Revenue Million Forecast, by Deployment Type 2020 & 2033
- Table 44: Global Digital Experience Platform Market Volume K Unit Forecast, by Deployment Type 2020 & 2033
- Table 45: Global Digital Experience Platform Market Revenue Million Forecast, by End Users 2020 & 2033
- Table 46: Global Digital Experience Platform Market Volume K Unit Forecast, by End Users 2020 & 2033
- Table 47: Global Digital Experience Platform Market Revenue Million Forecast, by Country 2020 & 2033
- Table 48: Global Digital Experience Platform Market Volume K Unit Forecast, by Country 2020 & 2033
- Table 49: Global Digital Experience Platform Market Revenue Million Forecast, by Component 2020 & 2033
- Table 50: Global Digital Experience Platform Market Volume K Unit Forecast, by Component 2020 & 2033
- Table 51: Global Digital Experience Platform Market Revenue Million Forecast, by Deployment Type 2020 & 2033
- Table 52: Global Digital Experience Platform Market Volume K Unit Forecast, by Deployment Type 2020 & 2033
- Table 53: Global Digital Experience Platform Market Revenue Million Forecast, by End Users 2020 & 2033
- Table 54: Global Digital Experience Platform Market Volume K Unit Forecast, by End Users 2020 & 2033
- Table 55: Global Digital Experience Platform Market Revenue Million Forecast, by Country 2020 & 2033
- Table 56: Global Digital Experience Platform Market Volume K Unit Forecast, by Country 2020 & 2033
Frequently Asked Questions
1. What is the projected Compound Annual Growth Rate (CAGR) of the Digital Experience Platform Market?
The projected CAGR is approximately 13.48%.
2. Which companies are prominent players in the Digital Experience Platform Market?
Key companies in the market include SDL PLC, Salesforce Inc, OpenText Corporation, IBM Corporation, Acqui, Microsoft Corporation, Adobe Inc, Oracle Corporation, Sitecore, SAP SE.
3. What are the main segments of the Digital Experience Platform Market?
The market segments include Component, Deployment Type, End Users.
4. Can you provide details about the market size?
The market size is estimated to be USD 14.08 Million as of 2022.
5. What are some drivers contributing to market growth?
Growing Deployment of Cloud-Based Solutions; Rising Demand for big Data Analytics.
6. What are the notable trends driving market growth?
On Cloud Deployment to Drive the Market Growth.
7. Are there any restraints impacting market growth?
Privacy and Data Security Issues.
8. Can you provide examples of recent developments in the market?
December 2022- The Bank of Thailand (BOT) has chosen Oracle Fusion Cloud Human Capital Management (HCM), a comprehensive HR system, to promote a digital workforce with a better employee experience. The BOT can reduce manual processes and improve workflows with Oracle Cloud HCM.
9. What pricing options are available for accessing the report?
Pricing options include single-user, multi-user, and enterprise licenses priced at USD 4750, USD 5250, and USD 8750 respectively.
10. Is the market size provided in terms of value or volume?
The market size is provided in terms of value, measured in Million and volume, measured in K Unit.
11. Are there any specific market keywords associated with the report?
Yes, the market keyword associated with the report is "Digital Experience Platform Market," which aids in identifying and referencing the specific market segment covered.
12. How do I determine which pricing option suits my needs best?
The pricing options vary based on user requirements and access needs. Individual users may opt for single-user licenses, while businesses requiring broader access may choose multi-user or enterprise licenses for cost-effective access to the report.
13. Are there any additional resources or data provided in the Digital Experience Platform Market report?
While the report offers comprehensive insights, it's advisable to review the specific contents or supplementary materials provided to ascertain if additional resources or data are available.
14. How can I stay updated on further developments or reports in the Digital Experience Platform Market?
To stay informed about further developments, trends, and reports in the Digital Experience Platform Market, consider subscribing to industry newsletters, following relevant companies and organizations, or regularly checking reputable industry news sources and publications.
Methodology
Step 1 - Identification of Relevant Samples Size from Population Database


Step 2 - Approaches for Defining Global Market Size (Value, Volume* & Price*)

Note*: In applicable scenarios
Step 3 - Data Sources
Primary Research
- Web Analytics
- Survey Reports
- Research Institute
- Latest Research Reports
- Opinion Leaders
Secondary Research
- Annual Reports
- White Paper
- Latest Press Release
- Industry Association
- Paid Database
- Investor Presentations

Step 4 - Data Triangulation
Involves using different sources of information in order to increase the validity of a study
These sources are likely to be stakeholders in a program - participants, other researchers, program staff, other community members, and so on.
Then we put all data in single framework & apply various statistical tools to find out the dynamic on the market.
During the analysis stage, feedback from the stakeholder groups would be compared to determine areas of agreement as well as areas of divergence