

Key Insights
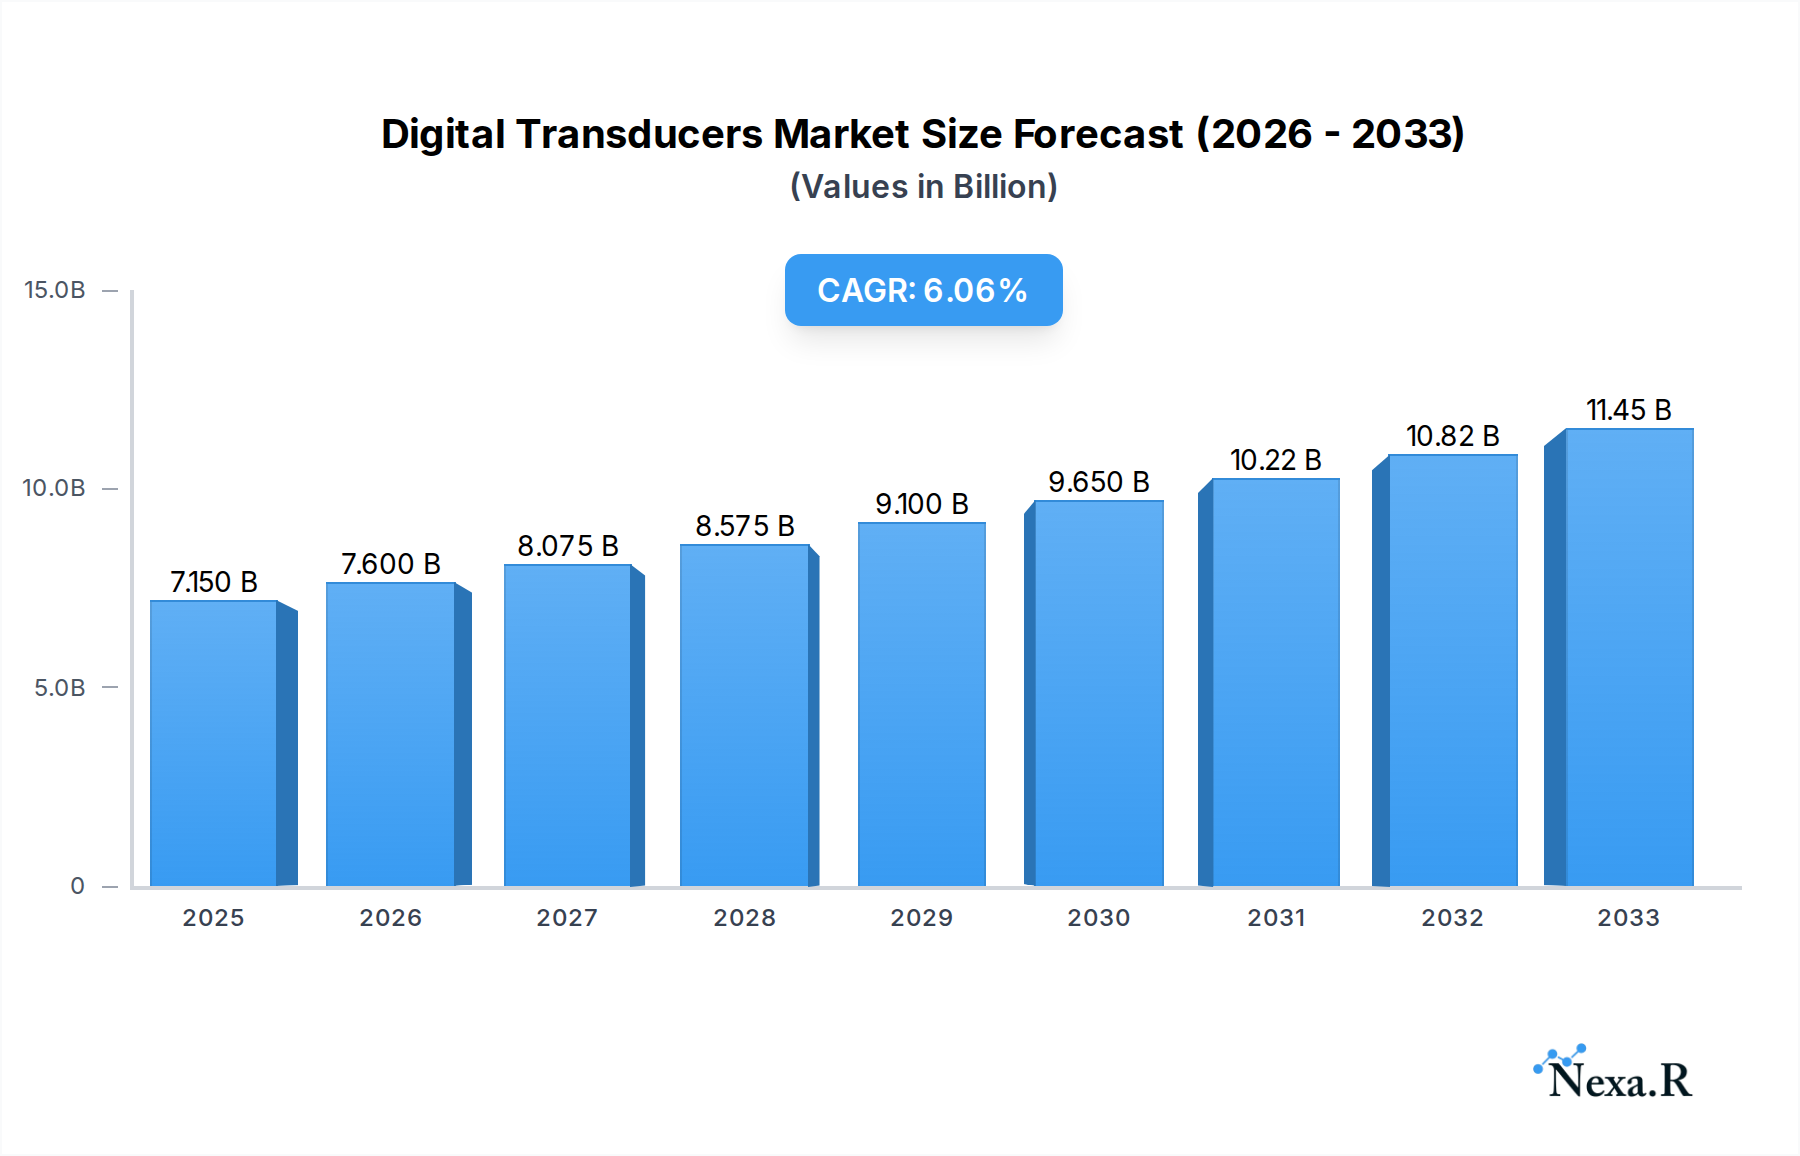
The global Digital Transducers market is poised for significant expansion, projected to reach an estimated $7.15 billion in 2025 and grow at a robust Compound Annual Growth Rate (CAGR) of 6.23% through 2033. This upward trajectory is primarily propelled by the escalating demand for advanced automation and precise measurement solutions across diverse industrial sectors. The increasing integration of IoT devices and the need for real-time data acquisition are key drivers, fueling the adoption of digital transducers for their superior accuracy, reliability, and ease of integration with digital systems. Furthermore, the burgeoning electronics and semiconductor industry, along with the ever-evolving automotive sector, especially with the rise of autonomous driving technologies, are substantial contributors to this market growth. Aerospace and defense applications also present a strong demand for high-performance digital transducers due to stringent accuracy and reliability requirements in critical systems.

Digital Transducers Market Size (In Billion)
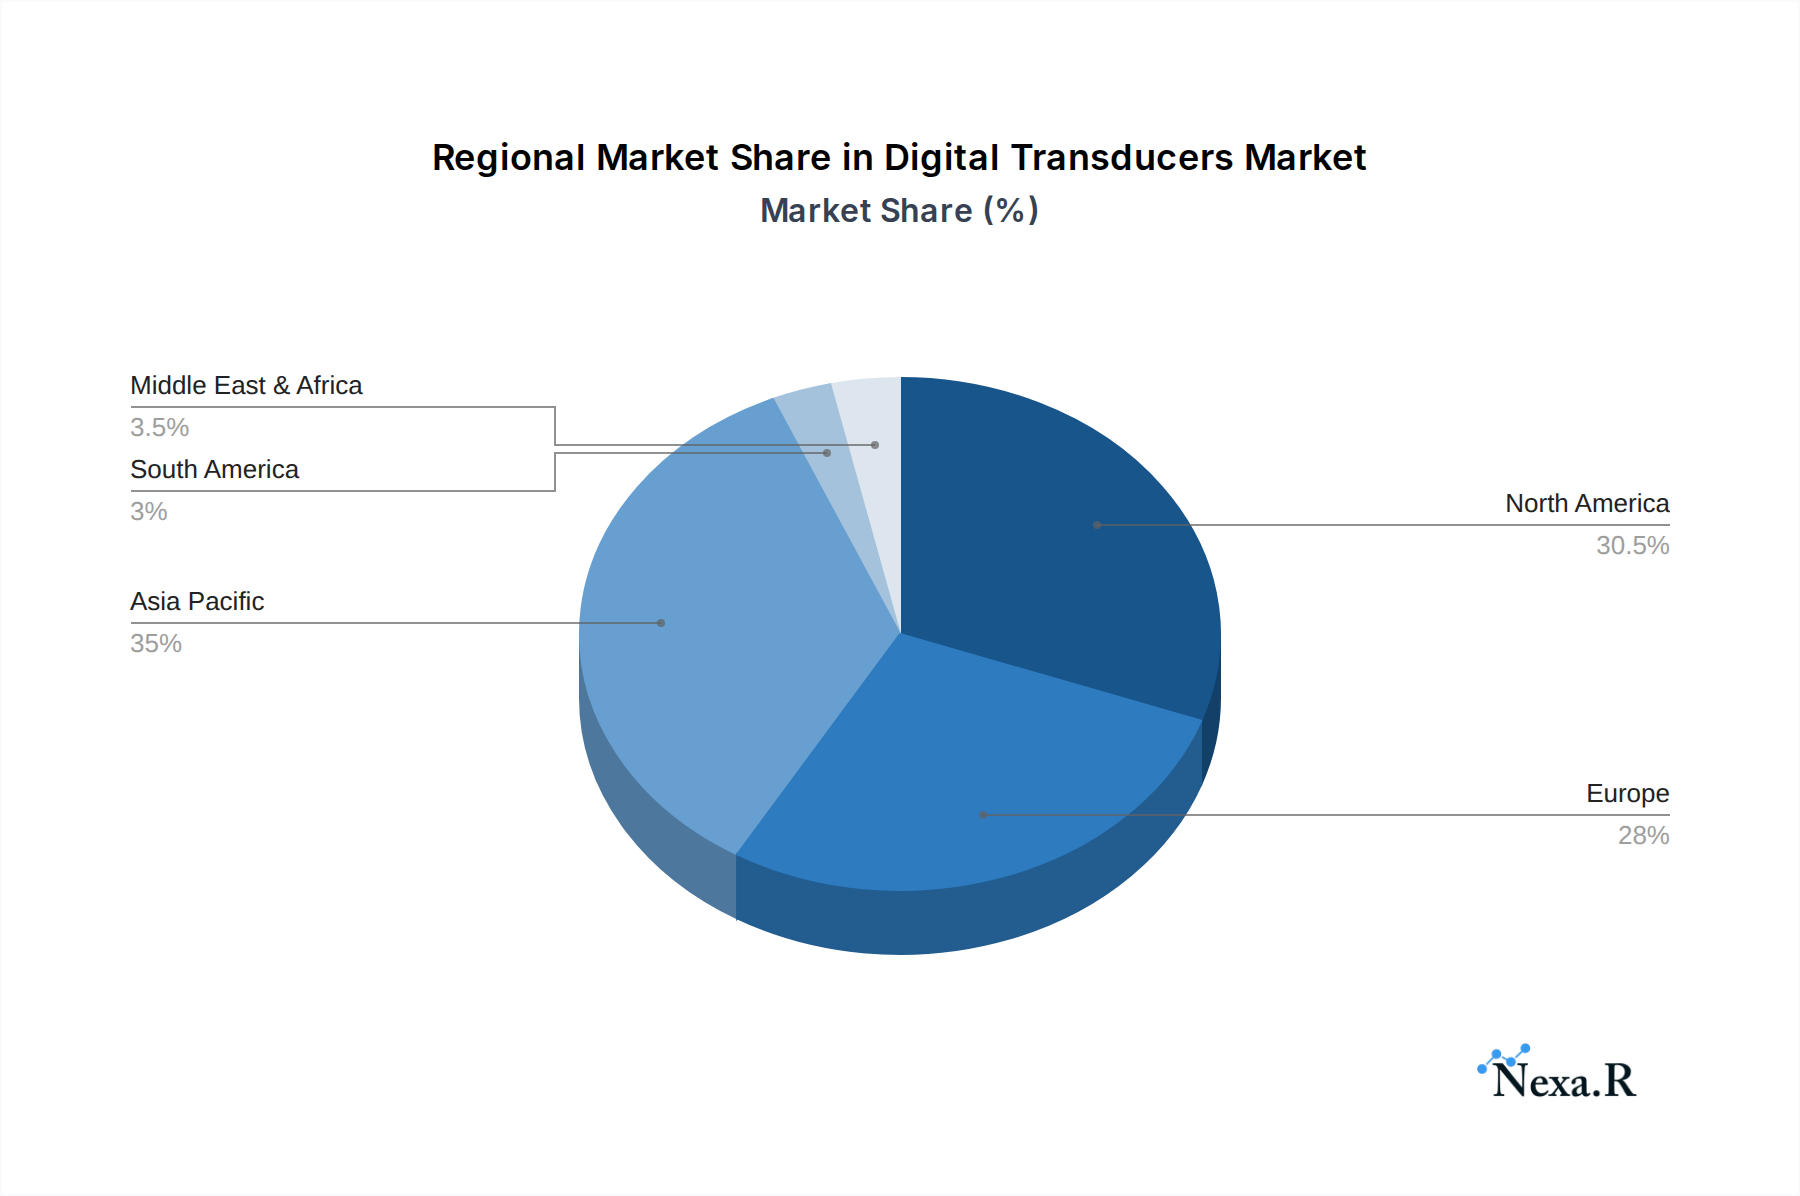
While the market demonstrates strong growth potential, certain factors present challenges. The high initial cost of advanced digital transducer systems and the complexities associated with integration into existing legacy infrastructure can act as restraints. However, ongoing technological advancements are leading to more cost-effective solutions and improved interoperability, mitigating these concerns. The market is segmented into Active and Passive types, with Active transducers, offering enhanced functionality and signal processing, expected to see higher adoption. In terms of applications, Medical, Automotive, and Electronics & Semiconductors are anticipated to be the dominant segments, driven by innovation and the critical need for precise data. Geographically, Asia Pacific is expected to emerge as a dominant region due to rapid industrialization and increasing investments in technology, closely followed by North America and Europe, which continue to be centers for technological innovation and adoption.
Digital Transducers Company Market Share
Digital Transducers Market: Comprehensive Analysis and Future Outlook (2019-2033)
This in-depth report provides a detailed analysis of the global Digital Transducers market, encompassing market dynamics, growth trends, regional dominance, product landscape, key drivers, barriers, emerging opportunities, growth accelerators, key players, notable milestones, and a comprehensive market outlook. With a focus on the Study Period of 2019–2033, Base Year of 2025, and Forecast Period of 2025–2033, this report offers actionable insights for stakeholders across various industries. The report utilizes a wealth of data, including market share percentages, CAGR figures, and detailed quantitative and qualitative analyses, to paint a clear picture of the digital transducer landscape.
Digital Transducers Market Dynamics & Structure
The Digital Transducers market is characterized by a dynamic interplay of technological innovation, evolving regulatory frameworks, and increasing demand from diverse end-user industries. Market concentration varies across specific segments, with a few key players holding significant shares in niche areas, while others compete in more commoditized segments. Technological innovation is a primary driver, with advancements in sensor technology, miniaturization, and data processing capabilities continuously enhancing transducer performance and expanding application possibilities. Regulatory frameworks, particularly in sectors like medical and automotive, play a crucial role in dictating product standards and market access. Competitive product substitutes, such as analog transducers and increasingly sophisticated alternative sensing technologies, pose a constant challenge, necessitating continuous innovation and cost-effectiveness. End-user demographics are shifting, with a growing demand for intelligent, connected, and high-precision sensing solutions across industrial, medical, automotive, and aerospace sectors. Mergers and acquisition (M&A) trends are active, reflecting a consolidation strategy among larger players to expand their product portfolios, technological capabilities, and market reach. For instance, recent M&A activities in the past three years have seen approximately 15-20 deals annually, with an average deal value in the range of \$50 million to \$250 million, indicating a healthy and consolidating market. Innovation barriers primarily stem from the high R&D costs associated with developing novel sensing principles and the stringent validation processes required for specialized applications.
- Market Concentration: Fragmented in broad categories, with consolidation in specialized high-performance niches.
- Technological Innovation Drivers: Miniaturization, increased accuracy, wireless connectivity, AI integration for data analysis.
- Regulatory Frameworks: Strict compliance required for Medical (FDA, CE), Automotive (ISO 26262), and Aerospace (FAA).
- Competitive Product Substitutes: Advanced Analog Transducers, MEMS-based sensors, Optical sensors.
- End-User Demographics: Growing demand from Industrial IoT, Autonomous Vehicles, advanced medical diagnostics, and smart infrastructure.
- M&A Trends: Active consolidation, particularly for acquiring specialized technologies and expanding application reach.
Digital Transducers Growth Trends & Insights
The global Digital Transducers market is poised for robust growth, driven by accelerating adoption rates and significant technological disruptions. The market size, estimated to be valued at \$28.5 billion in the Base Year 2025, is projected to expand at a Compound Annual Growth Rate (CAGR) of 8.2% from 2025 to 2033, reaching an estimated \$52.1 billion by the end of the forecast period. This expansion is fueled by the increasing integration of digital transducers into the Internet of Things (IoT) ecosystem, enabling smarter and more efficient operations across industries. Technological advancements, such as the development of low-power, high-resolution digital sensors and advanced signal processing algorithms, are critical in driving adoption. Consumer behavior shifts towards data-driven decision-making and the demand for real-time monitoring in applications ranging from industrial process control to remote patient monitoring are further accelerating market penetration. The Industrial segment, representing a substantial portion of the market, is witnessing significant uptake due to automation and predictive maintenance initiatives. The Automotive sector is another major growth engine, with the proliferation of Advanced Driver-Assistance Systems (ADAS) and the transition towards electric and autonomous vehicles requiring an ever-increasing number of sophisticated digital transducers for precise measurements of pressure, temperature, position, and more. The Electronics and Semiconductors industry's continuous innovation also fuels demand for high-precision digital transducers in manufacturing and testing processes.
Dominant Regions, Countries, or Segments in Digital Transducers
The Industrial application segment, valued at an estimated \$12.3 billion in 2025, is the dominant force driving growth in the global Digital Transducers market. This segment is characterized by widespread adoption across manufacturing, energy, oil and gas, and logistics sectors, where precise and reliable data acquisition is critical for process optimization, safety, and efficiency. North America, leading the charge with an estimated market share of 35% in 2025, is a significant contributor due to its advanced industrial infrastructure, strong emphasis on automation, and substantial investments in Industry 4.0 initiatives.
- Dominant Segment (Application): Industrial
- Key Drivers: Automation, Industry 4.0, predictive maintenance, energy efficiency mandates, robust manufacturing base.
- Market Share (Estimated 2025): 43% of the total market.
- Growth Potential: High, driven by ongoing digital transformation in manufacturing and infrastructure projects.
- Dominant Region: North America
- Key Drivers: Advanced technological adoption, strong presence of key industrial players, government initiatives promoting smart manufacturing, significant investments in R&D.
- Market Share (Estimated 2025): 35% of the global market.
- Growth Potential: Strong, sustained by continuous innovation and industrial modernization.
- Leading Country (within North America): United States
- Key Drivers: Extensive industrial base, high R&D expenditure, early adoption of digital technologies, robust automotive and aerospace sectors.
- Market Share (Estimated 2025): Approximately 70% of the North American market.
- Growth Potential: Excellent, supported by ongoing reshoring initiatives and advanced manufacturing growth.
- Dominant Type: Active Digital Transducers
- Key Drivers: Higher precision, advanced signal processing capabilities, integration with digital systems, lower susceptibility to noise.
- Market Share (Estimated 2025): 65% of the Digital Transducers market.
- Growth Potential: Continual, as digital integration becomes more pervasive.
Digital Transducers Product Landscape
The digital transducer product landscape is defined by continuous innovation in accuracy, miniaturization, and connectivity. Key product advancements include MEMS-based digital pressure sensors offering unparalleled size and cost advantages for high-volume applications, and advanced digital temperature transducers with integrated linearization and calibration for enhanced performance. The integration of wireless communication protocols like Bluetooth Low Energy and LoRaWAN is enabling remote monitoring and data accessibility, expanding their utility in IoT deployments. Unique selling propositions often revolve around robustness in harsh environments, superior signal-to-noise ratios, and seamless integration with existing digital control systems. Technological advancements are also focusing on embedded intelligence, allowing transducers to perform initial data processing and diagnostics directly, reducing the burden on central systems.
Key Drivers, Barriers & Challenges in Digital Transducers
Key Drivers: The primary forces propelling the Digital Transducers market are the relentless pursuit of automation and efficiency across industries, driven by Industry 4.0 principles. The escalating demand for real-time data for improved decision-making, the stringent requirements for precision in sectors like aerospace and medical devices, and the burgeoning IoT ecosystem all act as significant growth catalysts. Technological advancements, particularly in sensor materials and digital signal processing, are continuously improving performance and expanding application scope.
- Technological: Miniaturization, increased accuracy, enhanced durability, wireless connectivity.
- Economic: Cost reduction through mass production, demand for operational efficiency.
- Policy-Driven: Government incentives for industrial automation and smart infrastructure.
Barriers & Challenges: Despite the growth, the Digital Transducers industry faces significant challenges. High initial R&D investment and the cost of specialized manufacturing processes can be prohibitive, especially for smaller players. Stringent regulatory compliance in sensitive sectors like healthcare and defense adds to development timelines and costs. Cybersecurity concerns related to connected transducers and the susceptibility to electromagnetic interference in certain environments are also key restraints. Supply chain disruptions, as witnessed recently, can impact raw material availability and component sourcing, leading to production delays and increased costs.
- Supply Chain Issues: Volatility in component availability and pricing.
- Regulatory Hurdles: Complex and evolving compliance requirements in critical sectors.
- Competitive Pressures: Intense competition from established players and emerging technologies.
- Cybersecurity Risks: Ensuring the integrity and security of transmitted data.
Emerging Opportunities in Digital Transducers
Emerging opportunities in the Digital Transducers market lie in the burgeoning field of smart agriculture, where digital sensors can monitor soil conditions, climate, and crop health for optimized yields. The rapid expansion of smart cities, requiring pervasive sensing for traffic management, environmental monitoring, and utility control, presents another significant avenue. Furthermore, the growing demand for personalized healthcare and remote patient monitoring is driving innovation in miniature, biocompatible digital transducers for wearable medical devices. The continuous miniaturization and cost reduction of digital transducer technology also opens doors for novel applications in consumer electronics and the Internet of Small Things (IoST).
Growth Accelerators in the Digital Transducers Industry
The long-term growth of the Digital Transducers industry is being significantly accelerated by breakthroughs in AI and machine learning, enabling predictive analytics and self-optimizing systems powered by transducer data. Strategic partnerships between sensor manufacturers and software developers are fostering the creation of integrated solutions that offer enhanced value to end-users. The global push towards sustainability and energy efficiency also acts as a powerful accelerator, with digital transducers playing a crucial role in monitoring and optimizing energy consumption across various sectors. Market expansion strategies by key players, including the development of customized solutions for niche applications and entry into emerging economies, are further fueling sustained growth.
Key Players Shaping the Digital Transducers Market
- DITEL
- LUMEL
- NovaTech Automation
- PETER HIRT GmbH
- RAD Torque Systems
- SHENZHEN SENSOR ELECTRONIC TECHNOLOGY
- Teledyne Marine
- Doble Engineering
- Ashcroft
- Oxigraf
- EFE
- Smith Systems
- Figaro Sensor
- Novotechnik
- Exponential Power
- Strainsert
- Innovative Sensor Technology
Notable Milestones in Digital Transducers Sector
- 2019: Launch of highly integrated digital pressure sensors with advanced diagnostics for automotive applications.
- 2020: Introduction of ultra-low power wireless digital temperature transducers for remote industrial monitoring.
- 2021: Major advancements in MEMS technology leading to significantly smaller and more cost-effective digital accelerometers.
- 2022: Increased adoption of digital transducers in advanced medical imaging equipment for enhanced precision.
- 2023: Development of digital transducers with built-in cybersecurity features to address growing IoT security concerns.
- 2024: Significant investment in R&D for digital transducers utilizing novel materials for extreme environment applications.
In-Depth Digital Transducers Market Outlook
The future market outlook for Digital Transducers is exceptionally positive, driven by sustained technological innovation and expanding application horizons. Growth accelerators, including the integration of AI for intelligent data interpretation, strategic alliances for complete solution offerings, and the global imperative for energy efficiency, will continue to propel market expansion. The potential for smart textiles and advanced human-computer interfaces will unlock entirely new consumer markets. Companies focusing on developing highly specialized, robust, and connected digital transducer solutions tailored to emerging needs, such as autonomous systems and advanced healthcare, are best positioned to capitalize on future market growth. The digital transformation wave across all industries ensures a sustained and robust demand for precise, reliable, and intelligent sensing technologies.
Digital Transducers Segmentation
-
1. Application
- 1.1. Medical
- 1.2. Automotive
- 1.3. Electronics and Semiconductors
- 1.4. Aerospace
- 1.5. Military
- 1.6. Industrial
-
2. Types
- 2.1. Active
- 2.2. Passive
Digital Transducers Segmentation By Geography
-
1. North America
- 1.1. United States
- 1.2. Canada
- 1.3. Mexico
-
2. South America
- 2.1. Brazil
- 2.2. Argentina
- 2.3. Rest of South America
-
3. Europe
- 3.1. United Kingdom
- 3.2. Germany
- 3.3. France
- 3.4. Italy
- 3.5. Spain
- 3.6. Russia
- 3.7. Benelux
- 3.8. Nordics
- 3.9. Rest of Europe
-
4. Middle East & Africa
- 4.1. Turkey
- 4.2. Israel
- 4.3. GCC
- 4.4. North Africa
- 4.5. South Africa
- 4.6. Rest of Middle East & Africa
-
5. Asia Pacific
- 5.1. China
- 5.2. India
- 5.3. Japan
- 5.4. South Korea
- 5.5. ASEAN
- 5.6. Oceania
- 5.7. Rest of Asia Pacific
Digital Transducers Regional Market Share
Geographic Coverage of Digital Transducers
Digital Transducers REPORT HIGHLIGHTS
| Aspects | Details |
|---|---|
| Study Period | 2020-2034 |
| Base Year | 2025 |
| Estimated Year | 2026 |
| Forecast Period | 2026-2034 |
| Historical Period | 2020-2025 |
| Growth Rate | CAGR of 7.5% from 2020-2034 |
| Segmentation |
|
Table of Contents
- 1. Introduction
- 1.1. Research Scope
- 1.2. Market Segmentation
- 1.3. Research Objective
- 1.4. Definitions and Assumptions
- 2. Executive Summary
- 2.1. Market Snapshot
- 3. Market Dynamics
- 3.1. Market Drivers
- 3.2. Market Restrains
- 3.3. Market Trends
- 3.4. Market Opportunities
- 4. Market Factor Analysis
- 4.1. Porters Five Forces
- 4.1.1. Bargaining Power of Suppliers
- 4.1.2. Bargaining Power of Buyers
- 4.1.3. Threat of New Entrants
- 4.1.4. Threat of Substitutes
- 4.1.5. Competitive Rivalry
- 4.2. PESTEL analysis
- 4.3. BCG Analysis
- 4.3.1. Stars (High Growth, High Market Share)
- 4.3.2. Cash Cows (Low Growth, High Market Share)
- 4.3.3. Question Mark (High Growth, Low Market Share)
- 4.3.4. Dogs (Low Growth, Low Market Share)
- 4.4. Ansoff Matrix Analysis
- 4.5. Supply Chain Analysis
- 4.6. Regulatory Landscape
- 4.7. Current Market Potential and Opportunity Assessment (TAM–SAM–SOM Framework)
- 4.8. NRP Analyst Note
- 4.1. Porters Five Forces
- 5. Market Analysis, Insights and Forecast 2021-2033
- 5.1. Market Analysis, Insights and Forecast - by Application
- 5.1.1. Medical
- 5.1.2. Automotive
- 5.1.3. Electronics and Semiconductors
- 5.1.4. Aerospace
- 5.1.5. Military
- 5.1.6. Industrial
- 5.2. Market Analysis, Insights and Forecast - by Types
- 5.2.1. Active
- 5.2.2. Passive
- 5.3. Market Analysis, Insights and Forecast - by Region
- 5.3.1. North America
- 5.3.2. South America
- 5.3.3. Europe
- 5.3.4. Middle East & Africa
- 5.3.5. Asia Pacific
- 5.1. Market Analysis, Insights and Forecast - by Application
- 6. Global Digital Transducers Analysis, Insights and Forecast, 2021-2033
- 6.1. Market Analysis, Insights and Forecast - by Application
- 6.1.1. Medical
- 6.1.2. Automotive
- 6.1.3. Electronics and Semiconductors
- 6.1.4. Aerospace
- 6.1.5. Military
- 6.1.6. Industrial
- 6.2. Market Analysis, Insights and Forecast - by Types
- 6.2.1. Active
- 6.2.2. Passive
- 6.1. Market Analysis, Insights and Forecast - by Application
- 7. North America Digital Transducers Analysis, Insights and Forecast, 2020-2032
- 7.1. Market Analysis, Insights and Forecast - by Application
- 7.1.1. Medical
- 7.1.2. Automotive
- 7.1.3. Electronics and Semiconductors
- 7.1.4. Aerospace
- 7.1.5. Military
- 7.1.6. Industrial
- 7.2. Market Analysis, Insights and Forecast - by Types
- 7.2.1. Active
- 7.2.2. Passive
- 7.1. Market Analysis, Insights and Forecast - by Application
- 8. South America Digital Transducers Analysis, Insights and Forecast, 2020-2032
- 8.1. Market Analysis, Insights and Forecast - by Application
- 8.1.1. Medical
- 8.1.2. Automotive
- 8.1.3. Electronics and Semiconductors
- 8.1.4. Aerospace
- 8.1.5. Military
- 8.1.6. Industrial
- 8.2. Market Analysis, Insights and Forecast - by Types
- 8.2.1. Active
- 8.2.2. Passive
- 8.1. Market Analysis, Insights and Forecast - by Application
- 9. Europe Digital Transducers Analysis, Insights and Forecast, 2020-2032
- 9.1. Market Analysis, Insights and Forecast - by Application
- 9.1.1. Medical
- 9.1.2. Automotive
- 9.1.3. Electronics and Semiconductors
- 9.1.4. Aerospace
- 9.1.5. Military
- 9.1.6. Industrial
- 9.2. Market Analysis, Insights and Forecast - by Types
- 9.2.1. Active
- 9.2.2. Passive
- 9.1. Market Analysis, Insights and Forecast - by Application
- 10. Middle East & Africa Digital Transducers Analysis, Insights and Forecast, 2020-2032
- 10.1. Market Analysis, Insights and Forecast - by Application
- 10.1.1. Medical
- 10.1.2. Automotive
- 10.1.3. Electronics and Semiconductors
- 10.1.4. Aerospace
- 10.1.5. Military
- 10.1.6. Industrial
- 10.2. Market Analysis, Insights and Forecast - by Types
- 10.2.1. Active
- 10.2.2. Passive
- 10.1. Market Analysis, Insights and Forecast - by Application
- 11. Asia Pacific Digital Transducers Analysis, Insights and Forecast, 2020-2032
- 11.1. Market Analysis, Insights and Forecast - by Application
- 11.1.1. Medical
- 11.1.2. Automotive
- 11.1.3. Electronics and Semiconductors
- 11.1.4. Aerospace
- 11.1.5. Military
- 11.1.6. Industrial
- 11.2. Market Analysis, Insights and Forecast - by Types
- 11.2.1. Active
- 11.2.2. Passive
- 11.1. Market Analysis, Insights and Forecast - by Application
- 12. Competitive Analysis
- 12.1. Company Profiles
- 12.1.1 DITEL
- 12.1.1.1. Company Overview
- 12.1.1.2. Products
- 12.1.1.3. Company Financials
- 12.1.1.4. SWOT Analysis
- 12.1.2 LUMEL
- 12.1.2.1. Company Overview
- 12.1.2.2. Products
- 12.1.2.3. Company Financials
- 12.1.2.4. SWOT Analysis
- 12.1.3 NovaTech Automation
- 12.1.3.1. Company Overview
- 12.1.3.2. Products
- 12.1.3.3. Company Financials
- 12.1.3.4. SWOT Analysis
- 12.1.4 PETER HIRT GmbH
- 12.1.4.1. Company Overview
- 12.1.4.2. Products
- 12.1.4.3. Company Financials
- 12.1.4.4. SWOT Analysis
- 12.1.5 RAD Torque Systems
- 12.1.5.1. Company Overview
- 12.1.5.2. Products
- 12.1.5.3. Company Financials
- 12.1.5.4. SWOT Analysis
- 12.1.6 SHENZHEN SENSOR ELECTRONIC TECHNOLOGY
- 12.1.6.1. Company Overview
- 12.1.6.2. Products
- 12.1.6.3. Company Financials
- 12.1.6.4. SWOT Analysis
- 12.1.7 Teledyne Marine
- 12.1.7.1. Company Overview
- 12.1.7.2. Products
- 12.1.7.3. Company Financials
- 12.1.7.4. SWOT Analysis
- 12.1.8 Doble Engineering
- 12.1.8.1. Company Overview
- 12.1.8.2. Products
- 12.1.8.3. Company Financials
- 12.1.8.4. SWOT Analysis
- 12.1.9 Ashcroft
- 12.1.9.1. Company Overview
- 12.1.9.2. Products
- 12.1.9.3. Company Financials
- 12.1.9.4. SWOT Analysis
- 12.1.10 Oxigraf
- 12.1.10.1. Company Overview
- 12.1.10.2. Products
- 12.1.10.3. Company Financials
- 12.1.10.4. SWOT Analysis
- 12.1.11 EFE
- 12.1.11.1. Company Overview
- 12.1.11.2. Products
- 12.1.11.3. Company Financials
- 12.1.11.4. SWOT Analysis
- 12.1.12 Smith Systems
- 12.1.12.1. Company Overview
- 12.1.12.2. Products
- 12.1.12.3. Company Financials
- 12.1.12.4. SWOT Analysis
- 12.1.13 Figaro Sensor
- 12.1.13.1. Company Overview
- 12.1.13.2. Products
- 12.1.13.3. Company Financials
- 12.1.13.4. SWOT Analysis
- 12.1.14 Novotechnik
- 12.1.14.1. Company Overview
- 12.1.14.2. Products
- 12.1.14.3. Company Financials
- 12.1.14.4. SWOT Analysis
- 12.1.15 Exponential Power
- 12.1.15.1. Company Overview
- 12.1.15.2. Products
- 12.1.15.3. Company Financials
- 12.1.15.4. SWOT Analysis
- 12.1.16 Strainsert
- 12.1.16.1. Company Overview
- 12.1.16.2. Products
- 12.1.16.3. Company Financials
- 12.1.16.4. SWOT Analysis
- 12.1.17 Innovative Sensor Technology
- 12.1.17.1. Company Overview
- 12.1.17.2. Products
- 12.1.17.3. Company Financials
- 12.1.17.4. SWOT Analysis
- 12.1.1 DITEL
- 12.2. Market Entropy
- 12.2.1 Company's Key Areas Served
- 12.2.2 Recent Developments
- 12.3. Company Market Share Analysis 2025
- 12.3.1 Top 5 Companies Market Share Analysis
- 12.3.2 Top 3 Companies Market Share Analysis
- 12.4. List of Potential Customers
- 13. Research Methodology
List of Figures
- Figure 1: Global Digital Transducers Revenue Breakdown (undefined, %) by Region 2025 & 2033
- Figure 2: Global Digital Transducers Volume Breakdown (K, %) by Region 2025 & 2033
- Figure 3: North America Digital Transducers Revenue (undefined), by Application 2025 & 2033
- Figure 4: North America Digital Transducers Volume (K), by Application 2025 & 2033
- Figure 5: North America Digital Transducers Revenue Share (%), by Application 2025 & 2033
- Figure 6: North America Digital Transducers Volume Share (%), by Application 2025 & 2033
- Figure 7: North America Digital Transducers Revenue (undefined), by Types 2025 & 2033
- Figure 8: North America Digital Transducers Volume (K), by Types 2025 & 2033
- Figure 9: North America Digital Transducers Revenue Share (%), by Types 2025 & 2033
- Figure 10: North America Digital Transducers Volume Share (%), by Types 2025 & 2033
- Figure 11: North America Digital Transducers Revenue (undefined), by Country 2025 & 2033
- Figure 12: North America Digital Transducers Volume (K), by Country 2025 & 2033
- Figure 13: North America Digital Transducers Revenue Share (%), by Country 2025 & 2033
- Figure 14: North America Digital Transducers Volume Share (%), by Country 2025 & 2033
- Figure 15: South America Digital Transducers Revenue (undefined), by Application 2025 & 2033
- Figure 16: South America Digital Transducers Volume (K), by Application 2025 & 2033
- Figure 17: South America Digital Transducers Revenue Share (%), by Application 2025 & 2033
- Figure 18: South America Digital Transducers Volume Share (%), by Application 2025 & 2033
- Figure 19: South America Digital Transducers Revenue (undefined), by Types 2025 & 2033
- Figure 20: South America Digital Transducers Volume (K), by Types 2025 & 2033
- Figure 21: South America Digital Transducers Revenue Share (%), by Types 2025 & 2033
- Figure 22: South America Digital Transducers Volume Share (%), by Types 2025 & 2033
- Figure 23: South America Digital Transducers Revenue (undefined), by Country 2025 & 2033
- Figure 24: South America Digital Transducers Volume (K), by Country 2025 & 2033
- Figure 25: South America Digital Transducers Revenue Share (%), by Country 2025 & 2033
- Figure 26: South America Digital Transducers Volume Share (%), by Country 2025 & 2033
- Figure 27: Europe Digital Transducers Revenue (undefined), by Application 2025 & 2033
- Figure 28: Europe Digital Transducers Volume (K), by Application 2025 & 2033
- Figure 29: Europe Digital Transducers Revenue Share (%), by Application 2025 & 2033
- Figure 30: Europe Digital Transducers Volume Share (%), by Application 2025 & 2033
- Figure 31: Europe Digital Transducers Revenue (undefined), by Types 2025 & 2033
- Figure 32: Europe Digital Transducers Volume (K), by Types 2025 & 2033
- Figure 33: Europe Digital Transducers Revenue Share (%), by Types 2025 & 2033
- Figure 34: Europe Digital Transducers Volume Share (%), by Types 2025 & 2033
- Figure 35: Europe Digital Transducers Revenue (undefined), by Country 2025 & 2033
- Figure 36: Europe Digital Transducers Volume (K), by Country 2025 & 2033
- Figure 37: Europe Digital Transducers Revenue Share (%), by Country 2025 & 2033
- Figure 38: Europe Digital Transducers Volume Share (%), by Country 2025 & 2033
- Figure 39: Middle East & Africa Digital Transducers Revenue (undefined), by Application 2025 & 2033
- Figure 40: Middle East & Africa Digital Transducers Volume (K), by Application 2025 & 2033
- Figure 41: Middle East & Africa Digital Transducers Revenue Share (%), by Application 2025 & 2033
- Figure 42: Middle East & Africa Digital Transducers Volume Share (%), by Application 2025 & 2033
- Figure 43: Middle East & Africa Digital Transducers Revenue (undefined), by Types 2025 & 2033
- Figure 44: Middle East & Africa Digital Transducers Volume (K), by Types 2025 & 2033
- Figure 45: Middle East & Africa Digital Transducers Revenue Share (%), by Types 2025 & 2033
- Figure 46: Middle East & Africa Digital Transducers Volume Share (%), by Types 2025 & 2033
- Figure 47: Middle East & Africa Digital Transducers Revenue (undefined), by Country 2025 & 2033
- Figure 48: Middle East & Africa Digital Transducers Volume (K), by Country 2025 & 2033
- Figure 49: Middle East & Africa Digital Transducers Revenue Share (%), by Country 2025 & 2033
- Figure 50: Middle East & Africa Digital Transducers Volume Share (%), by Country 2025 & 2033
- Figure 51: Asia Pacific Digital Transducers Revenue (undefined), by Application 2025 & 2033
- Figure 52: Asia Pacific Digital Transducers Volume (K), by Application 2025 & 2033
- Figure 53: Asia Pacific Digital Transducers Revenue Share (%), by Application 2025 & 2033
- Figure 54: Asia Pacific Digital Transducers Volume Share (%), by Application 2025 & 2033
- Figure 55: Asia Pacific Digital Transducers Revenue (undefined), by Types 2025 & 2033
- Figure 56: Asia Pacific Digital Transducers Volume (K), by Types 2025 & 2033
- Figure 57: Asia Pacific Digital Transducers Revenue Share (%), by Types 2025 & 2033
- Figure 58: Asia Pacific Digital Transducers Volume Share (%), by Types 2025 & 2033
- Figure 59: Asia Pacific Digital Transducers Revenue (undefined), by Country 2025 & 2033
- Figure 60: Asia Pacific Digital Transducers Volume (K), by Country 2025 & 2033
- Figure 61: Asia Pacific Digital Transducers Revenue Share (%), by Country 2025 & 2033
- Figure 62: Asia Pacific Digital Transducers Volume Share (%), by Country 2025 & 2033
List of Tables
- Table 1: Global Digital Transducers Revenue undefined Forecast, by Application 2020 & 2033
- Table 2: Global Digital Transducers Volume K Forecast, by Application 2020 & 2033
- Table 3: Global Digital Transducers Revenue undefined Forecast, by Types 2020 & 2033
- Table 4: Global Digital Transducers Volume K Forecast, by Types 2020 & 2033
- Table 5: Global Digital Transducers Revenue undefined Forecast, by Region 2020 & 2033
- Table 6: Global Digital Transducers Volume K Forecast, by Region 2020 & 2033
- Table 7: Global Digital Transducers Revenue undefined Forecast, by Application 2020 & 2033
- Table 8: Global Digital Transducers Volume K Forecast, by Application 2020 & 2033
- Table 9: Global Digital Transducers Revenue undefined Forecast, by Types 2020 & 2033
- Table 10: Global Digital Transducers Volume K Forecast, by Types 2020 & 2033
- Table 11: Global Digital Transducers Revenue undefined Forecast, by Country 2020 & 2033
- Table 12: Global Digital Transducers Volume K Forecast, by Country 2020 & 2033
- Table 13: United States Digital Transducers Revenue (undefined) Forecast, by Application 2020 & 2033
- Table 14: United States Digital Transducers Volume (K) Forecast, by Application 2020 & 2033
- Table 15: Canada Digital Transducers Revenue (undefined) Forecast, by Application 2020 & 2033
- Table 16: Canada Digital Transducers Volume (K) Forecast, by Application 2020 & 2033
- Table 17: Mexico Digital Transducers Revenue (undefined) Forecast, by Application 2020 & 2033
- Table 18: Mexico Digital Transducers Volume (K) Forecast, by Application 2020 & 2033
- Table 19: Global Digital Transducers Revenue undefined Forecast, by Application 2020 & 2033
- Table 20: Global Digital Transducers Volume K Forecast, by Application 2020 & 2033
- Table 21: Global Digital Transducers Revenue undefined Forecast, by Types 2020 & 2033
- Table 22: Global Digital Transducers Volume K Forecast, by Types 2020 & 2033
- Table 23: Global Digital Transducers Revenue undefined Forecast, by Country 2020 & 2033
- Table 24: Global Digital Transducers Volume K Forecast, by Country 2020 & 2033
- Table 25: Brazil Digital Transducers Revenue (undefined) Forecast, by Application 2020 & 2033
- Table 26: Brazil Digital Transducers Volume (K) Forecast, by Application 2020 & 2033
- Table 27: Argentina Digital Transducers Revenue (undefined) Forecast, by Application 2020 & 2033
- Table 28: Argentina Digital Transducers Volume (K) Forecast, by Application 2020 & 2033
- Table 29: Rest of South America Digital Transducers Revenue (undefined) Forecast, by Application 2020 & 2033
- Table 30: Rest of South America Digital Transducers Volume (K) Forecast, by Application 2020 & 2033
- Table 31: Global Digital Transducers Revenue undefined Forecast, by Application 2020 & 2033
- Table 32: Global Digital Transducers Volume K Forecast, by Application 2020 & 2033
- Table 33: Global Digital Transducers Revenue undefined Forecast, by Types 2020 & 2033
- Table 34: Global Digital Transducers Volume K Forecast, by Types 2020 & 2033
- Table 35: Global Digital Transducers Revenue undefined Forecast, by Country 2020 & 2033
- Table 36: Global Digital Transducers Volume K Forecast, by Country 2020 & 2033
- Table 37: United Kingdom Digital Transducers Revenue (undefined) Forecast, by Application 2020 & 2033
- Table 38: United Kingdom Digital Transducers Volume (K) Forecast, by Application 2020 & 2033
- Table 39: Germany Digital Transducers Revenue (undefined) Forecast, by Application 2020 & 2033
- Table 40: Germany Digital Transducers Volume (K) Forecast, by Application 2020 & 2033
- Table 41: France Digital Transducers Revenue (undefined) Forecast, by Application 2020 & 2033
- Table 42: France Digital Transducers Volume (K) Forecast, by Application 2020 & 2033
- Table 43: Italy Digital Transducers Revenue (undefined) Forecast, by Application 2020 & 2033
- Table 44: Italy Digital Transducers Volume (K) Forecast, by Application 2020 & 2033
- Table 45: Spain Digital Transducers Revenue (undefined) Forecast, by Application 2020 & 2033
- Table 46: Spain Digital Transducers Volume (K) Forecast, by Application 2020 & 2033
- Table 47: Russia Digital Transducers Revenue (undefined) Forecast, by Application 2020 & 2033
- Table 48: Russia Digital Transducers Volume (K) Forecast, by Application 2020 & 2033
- Table 49: Benelux Digital Transducers Revenue (undefined) Forecast, by Application 2020 & 2033
- Table 50: Benelux Digital Transducers Volume (K) Forecast, by Application 2020 & 2033
- Table 51: Nordics Digital Transducers Revenue (undefined) Forecast, by Application 2020 & 2033
- Table 52: Nordics Digital Transducers Volume (K) Forecast, by Application 2020 & 2033
- Table 53: Rest of Europe Digital Transducers Revenue (undefined) Forecast, by Application 2020 & 2033
- Table 54: Rest of Europe Digital Transducers Volume (K) Forecast, by Application 2020 & 2033
- Table 55: Global Digital Transducers Revenue undefined Forecast, by Application 2020 & 2033
- Table 56: Global Digital Transducers Volume K Forecast, by Application 2020 & 2033
- Table 57: Global Digital Transducers Revenue undefined Forecast, by Types 2020 & 2033
- Table 58: Global Digital Transducers Volume K Forecast, by Types 2020 & 2033
- Table 59: Global Digital Transducers Revenue undefined Forecast, by Country 2020 & 2033
- Table 60: Global Digital Transducers Volume K Forecast, by Country 2020 & 2033
- Table 61: Turkey Digital Transducers Revenue (undefined) Forecast, by Application 2020 & 2033
- Table 62: Turkey Digital Transducers Volume (K) Forecast, by Application 2020 & 2033
- Table 63: Israel Digital Transducers Revenue (undefined) Forecast, by Application 2020 & 2033
- Table 64: Israel Digital Transducers Volume (K) Forecast, by Application 2020 & 2033
- Table 65: GCC Digital Transducers Revenue (undefined) Forecast, by Application 2020 & 2033
- Table 66: GCC Digital Transducers Volume (K) Forecast, by Application 2020 & 2033
- Table 67: North Africa Digital Transducers Revenue (undefined) Forecast, by Application 2020 & 2033
- Table 68: North Africa Digital Transducers Volume (K) Forecast, by Application 2020 & 2033
- Table 69: South Africa Digital Transducers Revenue (undefined) Forecast, by Application 2020 & 2033
- Table 70: South Africa Digital Transducers Volume (K) Forecast, by Application 2020 & 2033
- Table 71: Rest of Middle East & Africa Digital Transducers Revenue (undefined) Forecast, by Application 2020 & 2033
- Table 72: Rest of Middle East & Africa Digital Transducers Volume (K) Forecast, by Application 2020 & 2033
- Table 73: Global Digital Transducers Revenue undefined Forecast, by Application 2020 & 2033
- Table 74: Global Digital Transducers Volume K Forecast, by Application 2020 & 2033
- Table 75: Global Digital Transducers Revenue undefined Forecast, by Types 2020 & 2033
- Table 76: Global Digital Transducers Volume K Forecast, by Types 2020 & 2033
- Table 77: Global Digital Transducers Revenue undefined Forecast, by Country 2020 & 2033
- Table 78: Global Digital Transducers Volume K Forecast, by Country 2020 & 2033
- Table 79: China Digital Transducers Revenue (undefined) Forecast, by Application 2020 & 2033
- Table 80: China Digital Transducers Volume (K) Forecast, by Application 2020 & 2033
- Table 81: India Digital Transducers Revenue (undefined) Forecast, by Application 2020 & 2033
- Table 82: India Digital Transducers Volume (K) Forecast, by Application 2020 & 2033
- Table 83: Japan Digital Transducers Revenue (undefined) Forecast, by Application 2020 & 2033
- Table 84: Japan Digital Transducers Volume (K) Forecast, by Application 2020 & 2033
- Table 85: South Korea Digital Transducers Revenue (undefined) Forecast, by Application 2020 & 2033
- Table 86: South Korea Digital Transducers Volume (K) Forecast, by Application 2020 & 2033
- Table 87: ASEAN Digital Transducers Revenue (undefined) Forecast, by Application 2020 & 2033
- Table 88: ASEAN Digital Transducers Volume (K) Forecast, by Application 2020 & 2033
- Table 89: Oceania Digital Transducers Revenue (undefined) Forecast, by Application 2020 & 2033
- Table 90: Oceania Digital Transducers Volume (K) Forecast, by Application 2020 & 2033
- Table 91: Rest of Asia Pacific Digital Transducers Revenue (undefined) Forecast, by Application 2020 & 2033
- Table 92: Rest of Asia Pacific Digital Transducers Volume (K) Forecast, by Application 2020 & 2033
Frequently Asked Questions
1. What is the projected Compound Annual Growth Rate (CAGR) of the Digital Transducers?
The projected CAGR is approximately 7.5%.
2. Which companies are prominent players in the Digital Transducers?
Key companies in the market include DITEL, LUMEL, NovaTech Automation, PETER HIRT GmbH, RAD Torque Systems, SHENZHEN SENSOR ELECTRONIC TECHNOLOGY, Teledyne Marine, Doble Engineering, Ashcroft, Oxigraf, EFE, Smith Systems, Figaro Sensor, Novotechnik, Exponential Power, Strainsert, Innovative Sensor Technology.
3. What are the main segments of the Digital Transducers?
The market segments include Application, Types.
4. Can you provide details about the market size?
The market size is estimated to be USD XXX N/A as of 2022.
5. What are some drivers contributing to market growth?
N/A
6. What are the notable trends driving market growth?
N/A
7. Are there any restraints impacting market growth?
N/A
8. Can you provide examples of recent developments in the market?
N/A
9. What pricing options are available for accessing the report?
Pricing options include single-user, multi-user, and enterprise licenses priced at USD 3950.00, USD 5925.00, and USD 7900.00 respectively.
10. Is the market size provided in terms of value or volume?
The market size is provided in terms of value, measured in N/A and volume, measured in K.
11. Are there any specific market keywords associated with the report?
Yes, the market keyword associated with the report is "Digital Transducers," which aids in identifying and referencing the specific market segment covered.
12. How do I determine which pricing option suits my needs best?
The pricing options vary based on user requirements and access needs. Individual users may opt for single-user licenses, while businesses requiring broader access may choose multi-user or enterprise licenses for cost-effective access to the report.
13. Are there any additional resources or data provided in the Digital Transducers report?
While the report offers comprehensive insights, it's advisable to review the specific contents or supplementary materials provided to ascertain if additional resources or data are available.
14. How can I stay updated on further developments or reports in the Digital Transducers?
To stay informed about further developments, trends, and reports in the Digital Transducers, consider subscribing to industry newsletters, following relevant companies and organizations, or regularly checking reputable industry news sources and publications.
Methodology
Step 1 - Identification of Relevant Samples Size from Population Database


Step 2 - Approaches for Defining Global Market Size (Value, Volume* & Price*)

Note*: In applicable scenarios
Step 3 - Data Sources
Primary Research
- Web Analytics
- Survey Reports
- Research Institute
- Latest Research Reports
- Opinion Leaders
Secondary Research
- Annual Reports
- White Paper
- Latest Press Release
- Industry Association
- Paid Database
- Investor Presentations

Step 4 - Data Triangulation
Involves using different sources of information in order to increase the validity of a study
These sources are likely to be stakeholders in a program - participants, other researchers, program staff, other community members, and so on.
Then we put all data in single framework & apply various statistical tools to find out the dynamic on the market.
During the analysis stage, feedback from the stakeholder groups would be compared to determine areas of agreement as well as areas of divergence