

Key Insights
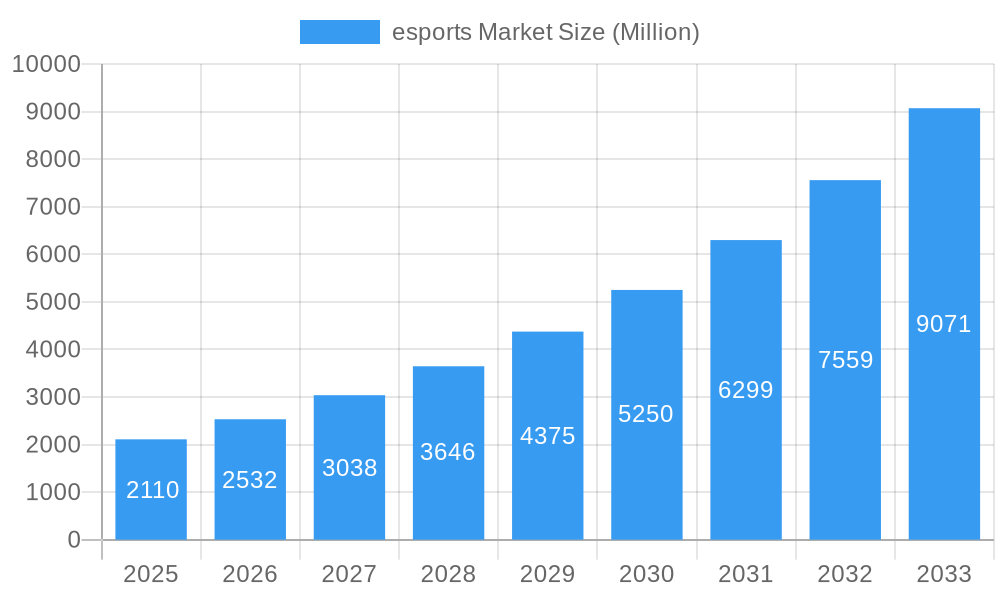
The esports market is experiencing explosive growth, projected to reach \$2.11 billion in 2025 and maintain a robust Compound Annual Growth Rate (CAGR) of 20.05% from 2025 to 2033. This expansion is fueled by several key drivers. Increasing viewership across platforms like Twitch and YouTube, coupled with the rising popularity of mobile esports, contributes significantly to revenue generation. Strategic investments from major players like Tencent Holdings Ltd (through Riot Games), Electronic Arts, and Activision Blizzard are further fueling innovation and market expansion. The diversification of revenue streams, encompassing media rights, advertising and sponsorships, merchandise and ticket sales, and other emerging models, provides resilience and multiple avenues for growth. Geographical expansion, particularly in rapidly developing Asian markets like India and South Korea, alongside continued growth in established regions like North America and Europe, presents significant untapped potential. While challenges like regulatory uncertainties and ensuring player welfare remain, the overall trajectory points towards sustained, substantial growth throughout the forecast period.
esports Market Market Size (In Billion)
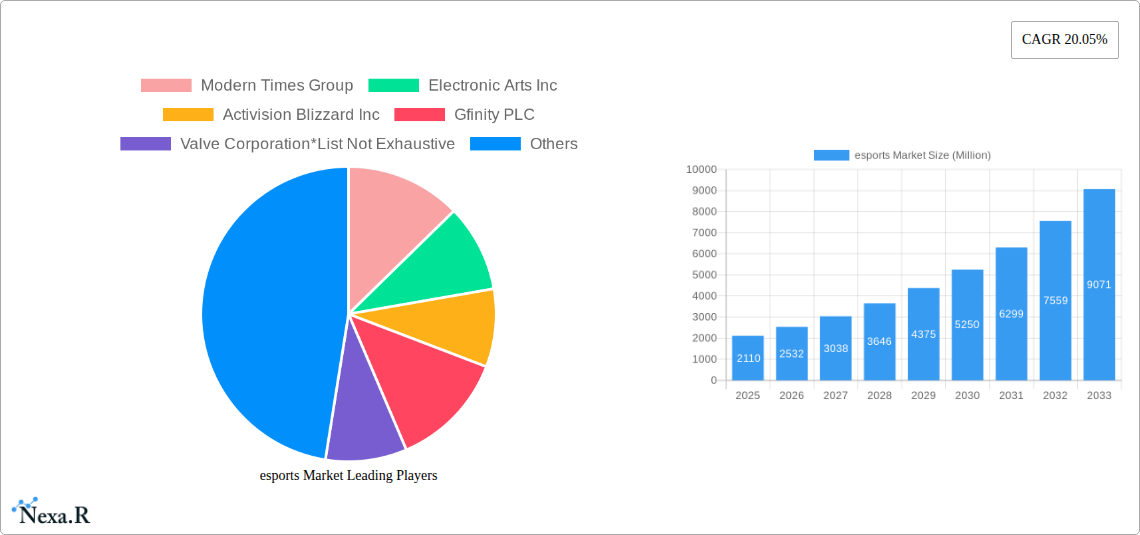
The segmentation of the market highlights key revenue streams and platform usage. Media rights sales, including broadcasting agreements and content licensing, are a major contributor, while advertising and sponsorships capitalize on the substantial viewership base. Merchandise sales and ticket revenue from live events continue to be important, although the pandemic and subsequent shifts towards digital engagement have potentially adjusted their proportions. Twitch and YouTube dominate the streaming landscape, although platforms like DouYu and Hayu indicate regional variations and emerging competitors. Major players like Modern Times Group, Gfinity, and Epic Games are shaping the industry landscape through game development, tournament organization, and platform infrastructure. The competitive landscape is dynamic, with constant innovation in game titles, tournament formats, and engagement strategies shaping market leadership and growth trajectories. Future growth will likely be driven by technological advancements, enhanced fan engagement, and broader accessibility.
esports Market Company Market Share
esports Market: A Comprehensive Market Report (2019-2033)
This comprehensive report provides an in-depth analysis of the esports market, encompassing market dynamics, growth trends, regional dominance, product landscape, key players, and future outlook. The study period covers 2019-2033, with 2025 as the base and estimated year. The forecast period is 2025-2033, and the historical period is 2019-2024. This report is invaluable for industry professionals, investors, and anyone seeking a detailed understanding of this rapidly evolving market.
esports Market Market Dynamics & Structure
The global esports market is characterized by high growth potential, driven by technological advancements, increasing viewership, and lucrative sponsorship opportunities. However, regulatory uncertainties and market concentration pose challenges. This report analyzes market concentration, technological innovation, regulatory frameworks, competitive substitutes, end-user demographics, and M&A trends.
Market Concentration: The market exhibits a moderately concentrated structure with a few dominant players like Tencent Holdings Ltd (through Riot Games), Activision Blizzard, and Electronic Arts controlling significant market share (estimated at xx%). However, numerous smaller companies and independent teams contribute significantly to the competitive landscape.
Technological Innovation: Technological advancements like improved game engines, streaming platforms, and VR/AR integration are significant growth drivers. However, high development costs and the need for constant innovation present barriers to entry.
Regulatory Frameworks: Varying regulations across countries regarding gambling, advertising, and intellectual property rights create complexities. This report analyzes these regulatory differences and their impact.
Competitive Product Substitutes: Traditional sports and other forms of entertainment compete for audience attention. The ability of esports to offer unique experiences and engage younger demographics is crucial.
End-User Demographics: The primary target demographic is young adults (18-35), with a growing presence among older age groups. Understanding the shifting demographics is essential for effective marketing.
M&A Trends: The esports market has witnessed a surge in mergers and acquisitions, with larger companies acquiring smaller studios and teams. The number of M&A deals in the historical period (2019-2024) was approximately xx, reflecting consolidation trends.
esports Market Growth Trends & Insights
The esports market has experienced remarkable growth over the past few years, driven by a confluence of factors such as increasing viewership, rising investment in infrastructure, and the expansion of esports into new geographic markets. The market size, adoption rates, technological disruption, and consumer behaviour shifts have all contributed to this growth.
The Compound Annual Growth Rate (CAGR) during the historical period (2019-2024) was approximately xx%, and is projected to continue growing at a CAGR of xx% during the forecast period (2025-2033). The market penetration rate stands at approximately xx% in 2025, with significant potential for future growth. Technological disruptions, particularly in streaming technology, game development, and VR/AR integration, are consistently reshaping the market dynamics. Consumer behavior is shifting towards greater engagement with esports content across multiple platforms, including mobile, PC, and consoles. This trend is further fueled by the increasing accessibility and affordability of high-speed internet and gaming devices. The emergence of mobile esports has particularly expanded the market's reach into new demographics.
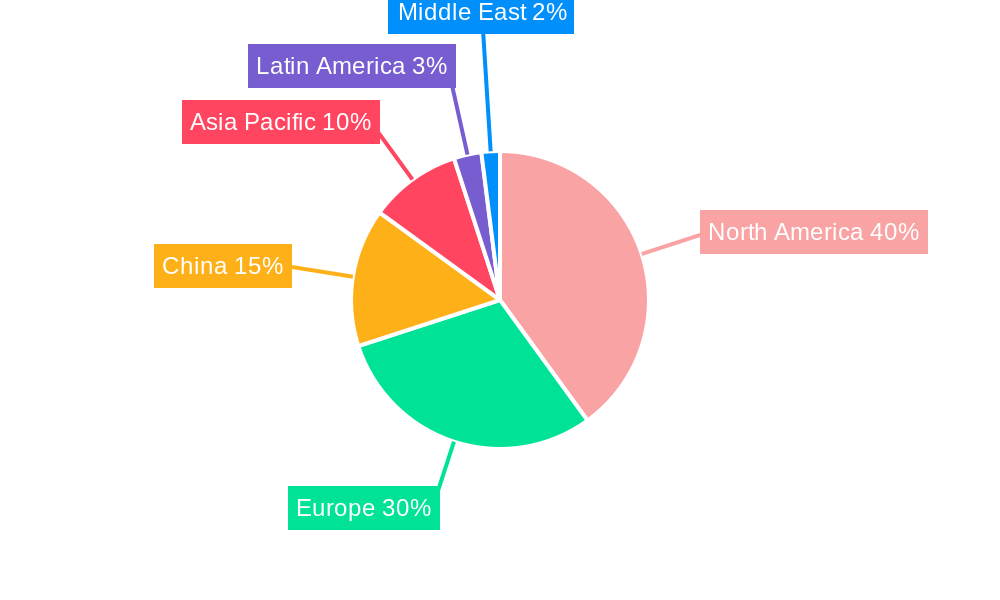
Dominant Regions, Countries, or Segments in esports Market
The esports market is geographically diverse, with significant regional variations in growth drivers.
By Revenue Model: Media rights currently hold the largest market share (xx%), followed by advertising and sponsorships (xx%), merchandise and tickets (xx%), and other revenue models (xx%). The high value of media rights reflects the significant revenue generated through broadcasting and streaming deals. Advertising and sponsorships are also substantial revenue streams, fueled by the growing viewership and engagement of esports events.
By Streaming Platform: Twitch maintains a dominant market share (xx%) as the leading platform for esports streaming, followed by YouTube (xx%) and other streaming platforms like DouYu and Hayu (xx%). Twitch's strong community and features make it the primary choice for many esports viewers and streamers. YouTube’s broad reach and established advertising infrastructure also make it a popular choice.
Key Drivers: North America and Asia are leading the global market, driven by factors such as substantial investments, strong gaming cultures, and supportive infrastructure. In North America, substantial investment in leagues, teams, and infrastructure has fueled market growth. In Asia, particularly China and South Korea, a strong gaming culture and high internet penetration rates have spurred growth.
esports Market Product Landscape
The esports product landscape is constantly evolving, with new games, hardware, and software emerging regularly. High-performance gaming PCs and peripherals, specialized gaming mice and keyboards, and high-refresh-rate monitors are critical products within the ecosystem. Innovation is primarily focused on enhancing player performance, improving viewing experiences, and creating immersive gaming environments. The rise of cloud gaming services is also transforming access to esports titles. The introduction of 1440p NVIDIA G-SYNC esports screens in January 2022, along with the adoption of NVIDIA Reflex low latency technology, demonstrates the continuous quest for improved player experience and competitive edge.
Key Drivers, Barriers & Challenges in esports Market
Key Drivers: Increasing viewership, significant investment from sponsors and investors, technological advancements, and the growth of mobile esports are major driving forces. The growing popularity of esports among younger demographics is another significant driver.
Key Challenges: Regulatory uncertainty regarding gambling and advertising, the need for sustained technological innovation to maintain audience engagement, and intense competition among teams and organizations are key challenges. Maintaining a sustainable revenue model amidst evolving technological trends is another major challenge.
Emerging Opportunities in esports Market
Emerging opportunities include the growth of mobile esports, the expansion of esports into new geographic markets, particularly in developing economies, and the integration of virtual reality (VR) and augmented reality (AR) technologies to enhance the viewing experience. The development of new game genres and esports titles will also create opportunities.
Growth Accelerators in the esports Market Industry
Technological breakthroughs in game development, streaming technology, and VR/AR are expected to significantly propel market growth. Strategic partnerships between esports organizations, game publishers, and technology companies will play a critical role in driving innovation and expanding market reach. The continued expansion of esports into new geographic regions will also serve as a significant growth accelerator.
Key Players Shaping the esports Market Market
- Modern Times Group
- Electronic Arts Inc
- Activision Blizzard Inc
- Gfinity PLC
- Valve Corporation
- Riot Games Inc (Tencent Holdings Ltd)
- Faceit
- Epic Games Inc
- Capcom Co Ltd
Notable Milestones in esports Market Sector
- January 2022: Launch of 1440p NVIDIA G-SYNC esports screens and the expansion of NVIDIA Reflex low-latency technology across multiple games, boosting player experience and market growth.
- February 2022: Nintendo Direct event showcasing new games (Switch Sports, Mario Strikers, etc.), expected to contribute to market expansion through increased game adoption and interest.
In-Depth esports Market Market Outlook
The esports market is poised for sustained growth, driven by technological innovations, increasing viewership, and strategic partnerships. The market's expansion into new geographic markets and the integration of emerging technologies, such as VR/AR, offer substantial opportunities. Companies that adapt quickly to changing consumer preferences and technological advancements are best positioned to capitalize on the future growth potential. The forecast period (2025-2033) is projected to witness continued expansion, driven by increasing investments, audience engagement, and diversification of revenue streams.
esports Market Segmentation
-
1. Revenue Model
- 1.1. Media Rights
- 1.2. Advertising and Sponsorships
- 1.3. Merchandise and Tickets
- 1.4. Other Revenue Models
-
2. Streaming Platform
- 2.1. Twitch
- 2.2. YouTube
- 2.3. Other Streaming Platforms ( DouYu and Hayu )
esports Market Segmentation By Geography
-
1. North America
- 1.1. United States
- 1.2. Canada
- 1.3. Rest of North America
-
2. Europe
- 2.1. Germany
- 2.2. United Kingdom
- 2.3. France
- 2.4. Rest of Europe
- 3. China
- 4. Asia Pacific
-
5. Japan
- 5.1. India
- 5.2. South Korea
- 5.3. Rest of Asia Pacific
- 6. Latin America
- 7. Middle East
esports Market Regional Market Share
Geographic Coverage of esports Market
esports Market REPORT HIGHLIGHTS
| Aspects | Details |
|---|---|
| Study Period | 2020-2034 |
| Base Year | 2025 |
| Estimated Year | 2026 |
| Forecast Period | 2026-2034 |
| Historical Period | 2020-2025 |
| Growth Rate | CAGR of 20.05% from 2020-2034 |
| Segmentation |
|
Table of Contents
- 1. Introduction
- 1.1. Research Scope
- 1.2. Market Segmentation
- 1.3. Research Objective
- 1.4. Definitions and Assumptions
- 2. Executive Summary
- 2.1. Market Snapshot
- 3. Market Dynamics
- 3.1. Market Drivers
- 3.2. Market Restrains
- 3.3. Market Trends
- 3.4. Market Opportunities
- 4. Market Factor Analysis
- 4.1. Porters Five Forces
- 4.1.1. Bargaining Power of Suppliers
- 4.1.2. Bargaining Power of Buyers
- 4.1.3. Threat of New Entrants
- 4.1.4. Threat of Substitutes
- 4.1.5. Competitive Rivalry
- 4.2. PESTEL analysis
- 4.3. BCG Analysis
- 4.3.1. Stars (High Growth, High Market Share)
- 4.3.2. Cash Cows (Low Growth, High Market Share)
- 4.3.3. Question Mark (High Growth, Low Market Share)
- 4.3.4. Dogs (Low Growth, Low Market Share)
- 4.4. Ansoff Matrix Analysis
- 4.5. Supply Chain Analysis
- 4.6. Regulatory Landscape
- 4.7. Current Market Potential and Opportunity Assessment (TAM–SAM–SOM Framework)
- 4.8. NRP Analyst Note
- 4.1. Porters Five Forces
- 5. Market Analysis, Insights and Forecast 2021-2033
- 5.1. Market Analysis, Insights and Forecast - by Revenue Model
- 5.1.1. Media Rights
- 5.1.2. Advertising and Sponsorships
- 5.1.3. Merchandise and Tickets
- 5.1.4. Other Revenue Models
- 5.2. Market Analysis, Insights and Forecast - by Streaming Platform
- 5.2.1. Twitch
- 5.2.2. YouTube
- 5.2.3. Other Streaming Platforms ( DouYu and Hayu )
- 5.3. Market Analysis, Insights and Forecast - by Region
- 5.3.1. North America
- 5.3.2. Europe
- 5.3.3. China
- 5.3.4. Asia Pacific
- 5.3.5. Japan
- 5.3.6. Latin America
- 5.3.7. Middle East
- 5.1. Market Analysis, Insights and Forecast - by Revenue Model
- 6. Global esports Market Analysis, Insights and Forecast, 2021-2033
- 6.1. Market Analysis, Insights and Forecast - by Revenue Model
- 6.1.1. Media Rights
- 6.1.2. Advertising and Sponsorships
- 6.1.3. Merchandise and Tickets
- 6.1.4. Other Revenue Models
- 6.2. Market Analysis, Insights and Forecast - by Streaming Platform
- 6.2.1. Twitch
- 6.2.2. YouTube
- 6.2.3. Other Streaming Platforms ( DouYu and Hayu )
- 6.1. Market Analysis, Insights and Forecast - by Revenue Model
- 7. North America esports Market Analysis, Insights and Forecast, 2020-2032
- 7.1. Market Analysis, Insights and Forecast - by Revenue Model
- 7.1.1. Media Rights
- 7.1.2. Advertising and Sponsorships
- 7.1.3. Merchandise and Tickets
- 7.1.4. Other Revenue Models
- 7.2. Market Analysis, Insights and Forecast - by Streaming Platform
- 7.2.1. Twitch
- 7.2.2. YouTube
- 7.2.3. Other Streaming Platforms ( DouYu and Hayu )
- 7.1. Market Analysis, Insights and Forecast - by Revenue Model
- 8. Europe esports Market Analysis, Insights and Forecast, 2020-2032
- 8.1. Market Analysis, Insights and Forecast - by Revenue Model
- 8.1.1. Media Rights
- 8.1.2. Advertising and Sponsorships
- 8.1.3. Merchandise and Tickets
- 8.1.4. Other Revenue Models
- 8.2. Market Analysis, Insights and Forecast - by Streaming Platform
- 8.2.1. Twitch
- 8.2.2. YouTube
- 8.2.3. Other Streaming Platforms ( DouYu and Hayu )
- 8.1. Market Analysis, Insights and Forecast - by Revenue Model
- 9. China esports Market Analysis, Insights and Forecast, 2020-2032
- 9.1. Market Analysis, Insights and Forecast - by Revenue Model
- 9.1.1. Media Rights
- 9.1.2. Advertising and Sponsorships
- 9.1.3. Merchandise and Tickets
- 9.1.4. Other Revenue Models
- 9.2. Market Analysis, Insights and Forecast - by Streaming Platform
- 9.2.1. Twitch
- 9.2.2. YouTube
- 9.2.3. Other Streaming Platforms ( DouYu and Hayu )
- 9.1. Market Analysis, Insights and Forecast - by Revenue Model
- 10. Asia Pacific esports Market Analysis, Insights and Forecast, 2020-2032
- 10.1. Market Analysis, Insights and Forecast - by Revenue Model
- 10.1.1. Media Rights
- 10.1.2. Advertising and Sponsorships
- 10.1.3. Merchandise and Tickets
- 10.1.4. Other Revenue Models
- 10.2. Market Analysis, Insights and Forecast - by Streaming Platform
- 10.2.1. Twitch
- 10.2.2. YouTube
- 10.2.3. Other Streaming Platforms ( DouYu and Hayu )
- 10.1. Market Analysis, Insights and Forecast - by Revenue Model
- 11. Japan esports Market Analysis, Insights and Forecast, 2020-2032
- 11.1. Market Analysis, Insights and Forecast - by Revenue Model
- 11.1.1. Media Rights
- 11.1.2. Advertising and Sponsorships
- 11.1.3. Merchandise and Tickets
- 11.1.4. Other Revenue Models
- 11.2. Market Analysis, Insights and Forecast - by Streaming Platform
- 11.2.1. Twitch
- 11.2.2. YouTube
- 11.2.3. Other Streaming Platforms ( DouYu and Hayu )
- 11.1. Market Analysis, Insights and Forecast - by Revenue Model
- 12. Latin America esports Market Analysis, Insights and Forecast, 2020-2032
- 12.1. Market Analysis, Insights and Forecast - by Revenue Model
- 12.1.1. Media Rights
- 12.1.2. Advertising and Sponsorships
- 12.1.3. Merchandise and Tickets
- 12.1.4. Other Revenue Models
- 12.2. Market Analysis, Insights and Forecast - by Streaming Platform
- 12.2.1. Twitch
- 12.2.2. YouTube
- 12.2.3. Other Streaming Platforms ( DouYu and Hayu )
- 12.1. Market Analysis, Insights and Forecast - by Revenue Model
- 13. Middle East esports Market Analysis, Insights and Forecast, 2020-2032
- 13.1. Market Analysis, Insights and Forecast - by Revenue Model
- 13.1.1. Media Rights
- 13.1.2. Advertising and Sponsorships
- 13.1.3. Merchandise and Tickets
- 13.1.4. Other Revenue Models
- 13.2. Market Analysis, Insights and Forecast - by Streaming Platform
- 13.2.1. Twitch
- 13.2.2. YouTube
- 13.2.3. Other Streaming Platforms ( DouYu and Hayu )
- 13.1. Market Analysis, Insights and Forecast - by Revenue Model
- 14. Competitive Analysis
- 14.1. Company Profiles
- 14.1.1 Modern Times Group
- 14.1.1.1. Company Overview
- 14.1.1.2. Products
- 14.1.1.3. Company Financials
- 14.1.1.4. SWOT Analysis
- 14.1.2 Electronic Arts Inc
- 14.1.2.1. Company Overview
- 14.1.2.2. Products
- 14.1.2.3. Company Financials
- 14.1.2.4. SWOT Analysis
- 14.1.3 Activision Blizzard Inc
- 14.1.3.1. Company Overview
- 14.1.3.2. Products
- 14.1.3.3. Company Financials
- 14.1.3.4. SWOT Analysis
- 14.1.4 Gfinity PLC
- 14.1.4.1. Company Overview
- 14.1.4.2. Products
- 14.1.4.3. Company Financials
- 14.1.4.4. SWOT Analysis
- 14.1.5 Valve Corporation*List Not Exhaustive
- 14.1.5.1. Company Overview
- 14.1.5.2. Products
- 14.1.5.3. Company Financials
- 14.1.5.4. SWOT Analysis
- 14.1.6 Riot Games Inc ( Tencent Holdings Ltd)
- 14.1.6.1. Company Overview
- 14.1.6.2. Products
- 14.1.6.3. Company Financials
- 14.1.6.4. SWOT Analysis
- 14.1.7 Faceit
- 14.1.7.1. Company Overview
- 14.1.7.2. Products
- 14.1.7.3. Company Financials
- 14.1.7.4. SWOT Analysis
- 14.1.8 Epic Games Inc
- 14.1.8.1. Company Overview
- 14.1.8.2. Products
- 14.1.8.3. Company Financials
- 14.1.8.4. SWOT Analysis
- 14.1.9 Capcom Co Ltd
- 14.1.9.1. Company Overview
- 14.1.9.2. Products
- 14.1.9.3. Company Financials
- 14.1.9.4. SWOT Analysis
- 14.1.1 Modern Times Group
- 14.2. Market Entropy
- 14.2.1 Company's Key Areas Served
- 14.2.2 Recent Developments
- 14.3. Company Market Share Analysis 2025
- 14.3.1 Top 5 Companies Market Share Analysis
- 14.3.2 Top 3 Companies Market Share Analysis
- 14.4. List of Potential Customers
- 15. Research Methodology
List of Figures
- Figure 1: Global esports Market Revenue Breakdown (Million, %) by Region 2025 & 2033
- Figure 2: North America esports Market Revenue (Million), by Revenue Model 2025 & 2033
- Figure 3: North America esports Market Revenue Share (%), by Revenue Model 2025 & 2033
- Figure 4: North America esports Market Revenue (Million), by Streaming Platform 2025 & 2033
- Figure 5: North America esports Market Revenue Share (%), by Streaming Platform 2025 & 2033
- Figure 6: North America esports Market Revenue (Million), by Country 2025 & 2033
- Figure 7: North America esports Market Revenue Share (%), by Country 2025 & 2033
- Figure 8: Europe esports Market Revenue (Million), by Revenue Model 2025 & 2033
- Figure 9: Europe esports Market Revenue Share (%), by Revenue Model 2025 & 2033
- Figure 10: Europe esports Market Revenue (Million), by Streaming Platform 2025 & 2033
- Figure 11: Europe esports Market Revenue Share (%), by Streaming Platform 2025 & 2033
- Figure 12: Europe esports Market Revenue (Million), by Country 2025 & 2033
- Figure 13: Europe esports Market Revenue Share (%), by Country 2025 & 2033
- Figure 14: China esports Market Revenue (Million), by Revenue Model 2025 & 2033
- Figure 15: China esports Market Revenue Share (%), by Revenue Model 2025 & 2033
- Figure 16: China esports Market Revenue (Million), by Streaming Platform 2025 & 2033
- Figure 17: China esports Market Revenue Share (%), by Streaming Platform 2025 & 2033
- Figure 18: China esports Market Revenue (Million), by Country 2025 & 2033
- Figure 19: China esports Market Revenue Share (%), by Country 2025 & 2033
- Figure 20: Asia Pacific esports Market Revenue (Million), by Revenue Model 2025 & 2033
- Figure 21: Asia Pacific esports Market Revenue Share (%), by Revenue Model 2025 & 2033
- Figure 22: Asia Pacific esports Market Revenue (Million), by Streaming Platform 2025 & 2033
- Figure 23: Asia Pacific esports Market Revenue Share (%), by Streaming Platform 2025 & 2033
- Figure 24: Asia Pacific esports Market Revenue (Million), by Country 2025 & 2033
- Figure 25: Asia Pacific esports Market Revenue Share (%), by Country 2025 & 2033
- Figure 26: Japan esports Market Revenue (Million), by Revenue Model 2025 & 2033
- Figure 27: Japan esports Market Revenue Share (%), by Revenue Model 2025 & 2033
- Figure 28: Japan esports Market Revenue (Million), by Streaming Platform 2025 & 2033
- Figure 29: Japan esports Market Revenue Share (%), by Streaming Platform 2025 & 2033
- Figure 30: Japan esports Market Revenue (Million), by Country 2025 & 2033
- Figure 31: Japan esports Market Revenue Share (%), by Country 2025 & 2033
- Figure 32: Latin America esports Market Revenue (Million), by Revenue Model 2025 & 2033
- Figure 33: Latin America esports Market Revenue Share (%), by Revenue Model 2025 & 2033
- Figure 34: Latin America esports Market Revenue (Million), by Streaming Platform 2025 & 2033
- Figure 35: Latin America esports Market Revenue Share (%), by Streaming Platform 2025 & 2033
- Figure 36: Latin America esports Market Revenue (Million), by Country 2025 & 2033
- Figure 37: Latin America esports Market Revenue Share (%), by Country 2025 & 2033
- Figure 38: Middle East esports Market Revenue (Million), by Revenue Model 2025 & 2033
- Figure 39: Middle East esports Market Revenue Share (%), by Revenue Model 2025 & 2033
- Figure 40: Middle East esports Market Revenue (Million), by Streaming Platform 2025 & 2033
- Figure 41: Middle East esports Market Revenue Share (%), by Streaming Platform 2025 & 2033
- Figure 42: Middle East esports Market Revenue (Million), by Country 2025 & 2033
- Figure 43: Middle East esports Market Revenue Share (%), by Country 2025 & 2033
List of Tables
- Table 1: Global esports Market Revenue Million Forecast, by Revenue Model 2020 & 2033
- Table 2: Global esports Market Revenue Million Forecast, by Streaming Platform 2020 & 2033
- Table 3: Global esports Market Revenue Million Forecast, by Region 2020 & 2033
- Table 4: Global esports Market Revenue Million Forecast, by Revenue Model 2020 & 2033
- Table 5: Global esports Market Revenue Million Forecast, by Streaming Platform 2020 & 2033
- Table 6: Global esports Market Revenue Million Forecast, by Country 2020 & 2033
- Table 7: United States esports Market Revenue (Million) Forecast, by Application 2020 & 2033
- Table 8: Canada esports Market Revenue (Million) Forecast, by Application 2020 & 2033
- Table 9: Rest of North America esports Market Revenue (Million) Forecast, by Application 2020 & 2033
- Table 10: Global esports Market Revenue Million Forecast, by Revenue Model 2020 & 2033
- Table 11: Global esports Market Revenue Million Forecast, by Streaming Platform 2020 & 2033
- Table 12: Global esports Market Revenue Million Forecast, by Country 2020 & 2033
- Table 13: Germany esports Market Revenue (Million) Forecast, by Application 2020 & 2033
- Table 14: United Kingdom esports Market Revenue (Million) Forecast, by Application 2020 & 2033
- Table 15: France esports Market Revenue (Million) Forecast, by Application 2020 & 2033
- Table 16: Rest of Europe esports Market Revenue (Million) Forecast, by Application 2020 & 2033
- Table 17: Global esports Market Revenue Million Forecast, by Revenue Model 2020 & 2033
- Table 18: Global esports Market Revenue Million Forecast, by Streaming Platform 2020 & 2033
- Table 19: Global esports Market Revenue Million Forecast, by Country 2020 & 2033
- Table 20: Global esports Market Revenue Million Forecast, by Revenue Model 2020 & 2033
- Table 21: Global esports Market Revenue Million Forecast, by Streaming Platform 2020 & 2033
- Table 22: Global esports Market Revenue Million Forecast, by Country 2020 & 2033
- Table 23: Global esports Market Revenue Million Forecast, by Revenue Model 2020 & 2033
- Table 24: Global esports Market Revenue Million Forecast, by Streaming Platform 2020 & 2033
- Table 25: Global esports Market Revenue Million Forecast, by Country 2020 & 2033
- Table 26: India esports Market Revenue (Million) Forecast, by Application 2020 & 2033
- Table 27: South Korea esports Market Revenue (Million) Forecast, by Application 2020 & 2033
- Table 28: Rest of Asia Pacific esports Market Revenue (Million) Forecast, by Application 2020 & 2033
- Table 29: Global esports Market Revenue Million Forecast, by Revenue Model 2020 & 2033
- Table 30: Global esports Market Revenue Million Forecast, by Streaming Platform 2020 & 2033
- Table 31: Global esports Market Revenue Million Forecast, by Country 2020 & 2033
- Table 32: Global esports Market Revenue Million Forecast, by Revenue Model 2020 & 2033
- Table 33: Global esports Market Revenue Million Forecast, by Streaming Platform 2020 & 2033
- Table 34: Global esports Market Revenue Million Forecast, by Country 2020 & 2033
Frequently Asked Questions
1. What is the projected Compound Annual Growth Rate (CAGR) of the esports Market?
The projected CAGR is approximately 20.05%.
2. Which companies are prominent players in the esports Market?
Key companies in the market include Modern Times Group, Electronic Arts Inc, Activision Blizzard Inc, Gfinity PLC, Valve Corporation*List Not Exhaustive, Riot Games Inc ( Tencent Holdings Ltd), Faceit, Epic Games Inc, Capcom Co Ltd.
3. What are the main segments of the esports Market?
The market segments include Revenue Model, Streaming Platform.
4. Can you provide details about the market size?
The market size is estimated to be USD 2.11 Million as of 2022.
5. What are some drivers contributing to market growth?
Increasing Popularity of Video Games; Growing Awareness about eSports.
6. What are the notable trends driving market growth?
Advertising to be the Largest Sources of eSports Revenue.
7. Are there any restraints impacting market growth?
Issues Such as Piracy. Laws and Regulations. and Concerns Relating to Fraud During Gaming Transactions.
8. Can you provide examples of recent developments in the market?
January 2022 - A new category of 1440p NVIDIA G-SYNC esports screens and seven new games benefit from low latency thanks to NVIDIA Reflex. Since reducing system latency is recognized by gamers and game developers as essential to a quality gaming experience, the NVIDIA Reflex low latency ecosystem has grown significantly over the past year. Eight top-ten competitive shooters, including Apex Legends, Valorant, and Fortnite, support Reflex. Each month, more than 20 million GeForce gamers battle with Reflex ON. More than 50 mouse and screens support their Reflex Analyzer, enabling players to assess system latency quickly. Such developments are expected to flourish the esports market in the forecast period.
9. What pricing options are available for accessing the report?
Pricing options include single-user, multi-user, and enterprise licenses priced at USD 4750, USD 5250, and USD 8750 respectively.
10. Is the market size provided in terms of value or volume?
The market size is provided in terms of value, measured in Million.
11. Are there any specific market keywords associated with the report?
Yes, the market keyword associated with the report is "esports Market," which aids in identifying and referencing the specific market segment covered.
12. How do I determine which pricing option suits my needs best?
The pricing options vary based on user requirements and access needs. Individual users may opt for single-user licenses, while businesses requiring broader access may choose multi-user or enterprise licenses for cost-effective access to the report.
13. Are there any additional resources or data provided in the esports Market report?
While the report offers comprehensive insights, it's advisable to review the specific contents or supplementary materials provided to ascertain if additional resources or data are available.
14. How can I stay updated on further developments or reports in the esports Market?
To stay informed about further developments, trends, and reports in the esports Market, consider subscribing to industry newsletters, following relevant companies and organizations, or regularly checking reputable industry news sources and publications.
Methodology
Step 1 - Identification of Relevant Samples Size from Population Database


Step 2 - Approaches for Defining Global Market Size (Value, Volume* & Price*)

Note*: In applicable scenarios
Step 3 - Data Sources
Primary Research
- Web Analytics
- Survey Reports
- Research Institute
- Latest Research Reports
- Opinion Leaders
Secondary Research
- Annual Reports
- White Paper
- Latest Press Release
- Industry Association
- Paid Database
- Investor Presentations

Step 4 - Data Triangulation
Involves using different sources of information in order to increase the validity of a study
These sources are likely to be stakeholders in a program - participants, other researchers, program staff, other community members, and so on.
Then we put all data in single framework & apply various statistical tools to find out the dynamic on the market.
During the analysis stage, feedback from the stakeholder groups would be compared to determine areas of agreement as well as areas of divergence