

Key Insights
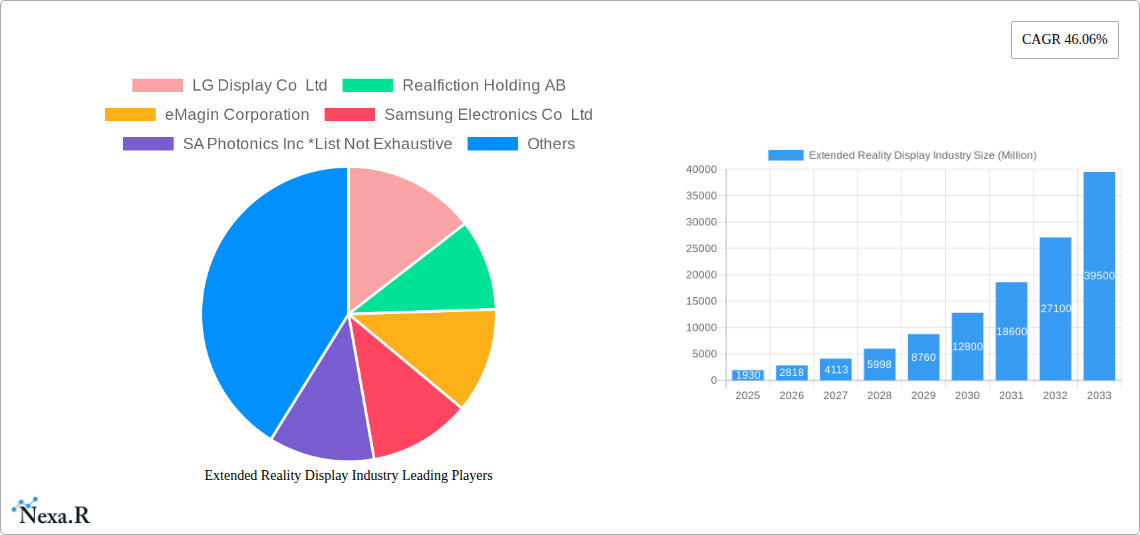
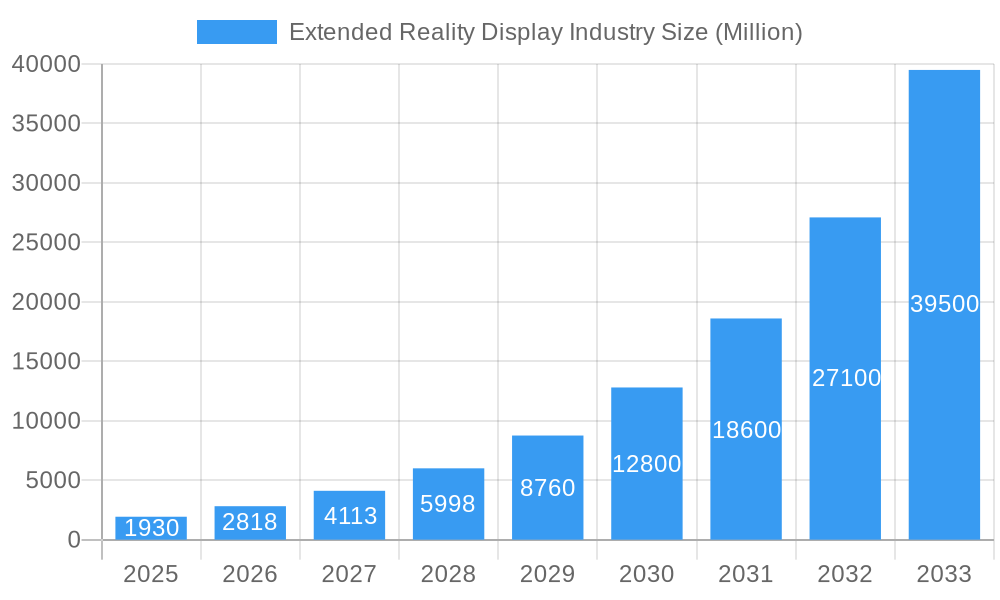
The Extended Reality (XR) display market, encompassing Virtual Reality (VR), Augmented Reality (AR), and Mixed Reality (MR) technologies, is experiencing explosive growth. Driven by increasing adoption across gaming and entertainment, healthcare (surgical simulations, therapeutic applications), education (immersive learning experiences), and the military and defense sectors (training and simulation), the market is projected to reach $1.93 billion in 2025 and maintain a robust Compound Annual Growth Rate (CAGR) of 46.06% through 2033. This expansion is fueled by advancements in display technologies, particularly OLED displays offering superior image quality, higher refresh rates, and improved power efficiency compared to LCD counterparts. The rising demand for lightweight, high-resolution headsets and glasses further propels market growth. While initial high costs of XR devices present a restraint, ongoing technological advancements and economies of scale are gradually addressing this barrier, making XR technology more accessible to consumers and businesses alike. The segment breakdown reveals a strong dominance of the gaming and entertainment sector, yet the healthcare, education, and automotive industries are exhibiting significant growth potential, contributing to the overall market expansion. Key players like LG Display, Samsung Electronics, and BOE Technology are driving innovation through R&D investments and strategic partnerships, further solidifying the XR display market's trajectory.
Extended Reality Display Industry Market Size (In Billion)
The Asia-Pacific region is likely to dominate the XR display market due to the high concentration of manufacturing facilities and the burgeoning consumer electronics market. North America and Europe, while holding significant market share, will see substantial growth fueled by rising investments in research and development and the increased adoption of XR solutions across various sectors. While precise regional breakdowns are absent, a logical estimation based on global trends would indicate a significant lead for the Asia-Pacific region, followed by North America and Europe, with the Rest of the World segment comprising a smaller, but still growing, portion of the market. The competitive landscape is characterized by the presence of established display manufacturers and specialized XR display companies, indicating a market primed for further consolidation and innovation in the coming years. Continuous improvement in display resolution, field of view, and latency reduction will be crucial factors in shaping future market dynamics.
Extended Reality Display Industry Company Market Share
Extended Reality (XR) Display Industry Market Report: 2019-2033
This comprehensive report provides an in-depth analysis of the Extended Reality (XR) display market, encompassing market dynamics, growth trends, regional dominance, product landscape, key players, and future outlook. The study period covers 2019-2033, with a base year of 2025 and a forecast period of 2025-2033. The report leverages extensive data analysis and industry insights to offer actionable intelligence for industry professionals, investors, and strategic decision-makers. Key market segments analyzed include Liquid Crystal Displays (LCDs), Organic Light-Emitting Diodes (OLEDs), and other display technologies across diverse end-user industries.
Extended Reality Display Industry Market Dynamics & Structure
The XR display market is characterized by moderate concentration, with key players like LG Display Co Ltd, Samsung Electronics Co Ltd, and BOE Technology Group Co Ltd holding significant market share (xx%). However, the market also features numerous smaller, specialized companies driving innovation. Technological advancements, particularly in micro-OLED and transparent display technologies, are major growth drivers. Regulatory frameworks concerning data privacy and safety standards in XR applications influence market development. Competitive substitutes include traditional display technologies, impacting market penetration. End-user demographics, particularly the rising adoption of XR in gaming and entertainment, healthcare, and education, significantly shape market demand. M&A activity in the sector remains relatively active, with xx deals recorded in the historical period (2019-2024), primarily focused on enhancing technological capabilities and expanding market reach. Innovation barriers include high R&D costs associated with new display technologies and the need for seamless integration with XR hardware and software.
- Market Concentration: Moderate, with a few major players and numerous smaller companies.
- Technological Innovation: Micro-OLED, transparent displays, and higher refresh rate technologies are key drivers.
- Regulatory Landscape: Data privacy and safety standards are evolving and impacting market dynamics.
- Competitive Substitutes: Traditional display technologies present competition.
- End-User Demographics: Growing adoption in gaming, healthcare, education, and other sectors.
- M&A Activity: xx deals in 2019-2024, focusing on technology and market expansion.
Extended Reality Display Industry Growth Trends & Insights
The XR display market experienced substantial growth during the historical period (2019-2024), reaching xx million units in 2024. This growth is attributed to the increasing adoption of XR technologies across various sectors, fueled by technological advancements resulting in improved display quality, miniaturization, and cost reduction. The market is projected to maintain a healthy Compound Annual Growth Rate (CAGR) of xx% during the forecast period (2025-2033), reaching xx million units by 2033. This positive outlook is based on several factors, including increased consumer demand for immersive experiences, rapid technological advancements, and the expansion of XR applications across various end-user industries. Technological disruptions, such as the development of more efficient and higher resolution displays, are accelerating market expansion. Consumer behavior shifts toward interactive and immersive digital experiences further enhance market growth.
Dominant Regions, Countries, or Segments in Extended Reality Display Industry
The North American region currently holds the largest market share (xx%) in the XR display market, primarily driven by robust demand from the gaming and entertainment, military & defense sectors. Asia-Pacific is a rapidly growing market (xx%), fueled by the expanding adoption of XR technologies across various sectors and significant manufacturing capabilities. Within display types, OLED displays are experiencing faster growth (xx% CAGR) than LCDs due to superior image quality and energy efficiency. The gaming and entertainment segment is the largest end-user market (xx%), followed by healthcare (xx%) and automotive (xx%).
- Key Drivers: Strong consumer demand, significant government investments in XR technologies, and supportive regulatory frameworks.
- Dominance Factors: Established technological base, robust consumer electronics markets, and significant investments in R&D.
- Growth Potential: Asia-Pacific shows significant growth potential, fueled by expanding consumer base and increasing adoption in emerging markets.
Extended Reality Display Industry Product Landscape
XR display technology is rapidly evolving, with notable advancements in micro-OLED, transparent displays, and high refresh rate technologies. These advancements offer improved image quality, reduced power consumption, and enhanced user experiences. Key product innovations include higher resolution, brighter displays with wider color gamuts and improved response times. Unique selling propositions include features such as enhanced durability, increased brightness, wider viewing angles and lower power consumption compared to previous generation displays.
Key Drivers, Barriers & Challenges in Extended Reality Display Industry
Key Drivers:
- Technological advancements in display resolution, brightness, and refresh rates.
- Rising adoption of XR technologies across various sectors.
- Increasing investments in R&D and infrastructure development.
Key Challenges:
- High production costs for advanced display technologies.
- Supply chain disruptions impacting production capacity.
- Competition from existing and emerging display technologies.
- Regulatory hurdles and standardization challenges. The impact of these challenges can be estimated to reduce the overall market size by an estimated xx% by 2033.
Emerging Opportunities in Extended Reality Display Industry
Emerging opportunities are significant in the XR display market. These include the expansion of XR applications into new sectors such as industrial training, remote collaboration, and augmented retail experiences. The development of more affordable and user-friendly XR devices will further drive market growth. Focus on developing sustainable display technologies will become increasingly important, particularly in eco-conscious markets.
Growth Accelerators in the Extended Reality Display Industry
Long-term growth is fueled by continuous technological advancements, particularly in areas such as micro-LED and holographic displays. Strategic partnerships between display manufacturers and XR hardware/software developers will further accelerate market growth. Expansion into new markets and application areas such as healthcare, education, and industrial applications are also strong growth catalysts.
Key Players Shaping the Extended Reality Display Industry Market
- LG Display Co Ltd
- Realfiction Holding AB
- eMagin Corporation
- Samsung Electronics Co Ltd
- SA Photonics Inc
- Japan Display Inc
- Seiko Epson Corporation
- Plessey Company plc
- Lumus Ltd
- Kopin Corporation
- BOE Technology Group Co Ltd
- Sony Corporation
Notable Milestones in Extended Reality Display Industry Sector
- June 2022: JDI developed its revolutionary transparent Raelclear display technology.
- July 2022: Kopin received USD 3.8 million in production orders for its Brillian AMLCD.
- July 2022: Samsung Display announced development of a MicroOLED panel for key customers.
In-Depth Extended Reality Display Industry Market Outlook
The future of the XR display market is bright, with continued growth driven by technological advancements and increasing adoption across various sectors. Strategic investments in R&D, strategic partnerships, and expansion into emerging markets are key to unlocking the vast potential of this dynamic market. The market is poised for significant expansion, particularly in the Asia-Pacific region, and the continued evolution of display technologies will drive further innovation and market penetration.
Extended Reality Display Industry Segmentation
-
1. Display Type
- 1.1. Liquid Crystal Displays (LCD)
- 1.2. Organic Light-Emitting Diode (OLED)
- 1.3. Other Display Type
-
2. End-User Industry
- 2.1. Gaming and Entertainment
- 2.2. Healthcare
- 2.3. Education
- 2.4. Military and Defense
- 2.5. Automotive and Manufacturing
- 2.6. Retail
- 2.7. Other Applications
Extended Reality Display Industry Segmentation By Geography
- 1. North America
- 2. Europe
- 3. Asia Pacific
- 4. Rest of the World
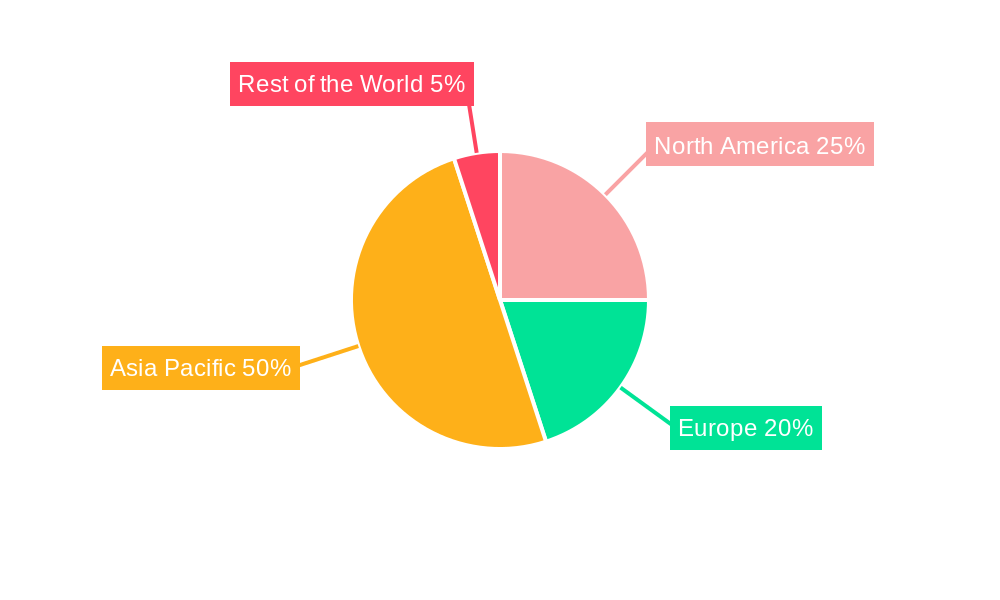
Extended Reality Display Industry Regional Market Share
Geographic Coverage of Extended Reality Display Industry
Extended Reality Display Industry REPORT HIGHLIGHTS
| Aspects | Details |
|---|---|
| Study Period | 2020-2034 |
| Base Year | 2025 |
| Estimated Year | 2026 |
| Forecast Period | 2026-2034 |
| Historical Period | 2020-2025 |
| Growth Rate | CAGR of 46.06% from 2020-2034 |
| Segmentation |
|
Table of Contents
- 1. Introduction
- 1.1. Research Scope
- 1.2. Market Segmentation
- 1.3. Research Objective
- 1.4. Definitions and Assumptions
- 2. Executive Summary
- 2.1. Market Snapshot
- 3. Market Dynamics
- 3.1. Market Drivers
- 3.2. Market Restrains
- 3.3. Market Trends
- 3.4. Market Opportunities
- 4. Market Factor Analysis
- 4.1. Porters Five Forces
- 4.1.1. Bargaining Power of Suppliers
- 4.1.2. Bargaining Power of Buyers
- 4.1.3. Threat of New Entrants
- 4.1.4. Threat of Substitutes
- 4.1.5. Competitive Rivalry
- 4.2. PESTEL analysis
- 4.3. BCG Analysis
- 4.3.1. Stars (High Growth, High Market Share)
- 4.3.2. Cash Cows (Low Growth, High Market Share)
- 4.3.3. Question Mark (High Growth, Low Market Share)
- 4.3.4. Dogs (Low Growth, Low Market Share)
- 4.4. Ansoff Matrix Analysis
- 4.5. Supply Chain Analysis
- 4.6. Regulatory Landscape
- 4.7. Current Market Potential and Opportunity Assessment (TAM–SAM–SOM Framework)
- 4.8. NRP Analyst Note
- 4.1. Porters Five Forces
- 5. Market Analysis, Insights and Forecast 2021-2033
- 5.1. Market Analysis, Insights and Forecast - by Display Type
- 5.1.1. Liquid Crystal Displays (LCD)
- 5.1.2. Organic Light-Emitting Diode (OLED)
- 5.1.3. Other Display Type
- 5.2. Market Analysis, Insights and Forecast - by End-User Industry
- 5.2.1. Gaming and Entertainment
- 5.2.2. Healthcare
- 5.2.3. Education
- 5.2.4. Military and Defense
- 5.2.5. Automotive and Manufacturing
- 5.2.6. Retail
- 5.2.7. Other Applications
- 5.3. Market Analysis, Insights and Forecast - by Region
- 5.3.1. North America
- 5.3.2. Europe
- 5.3.3. Asia Pacific
- 5.3.4. Rest of the World
- 5.1. Market Analysis, Insights and Forecast - by Display Type
- 6. Global Extended Reality Display Industry Analysis, Insights and Forecast, 2021-2033
- 6.1. Market Analysis, Insights and Forecast - by Display Type
- 6.1.1. Liquid Crystal Displays (LCD)
- 6.1.2. Organic Light-Emitting Diode (OLED)
- 6.1.3. Other Display Type
- 6.2. Market Analysis, Insights and Forecast - by End-User Industry
- 6.2.1. Gaming and Entertainment
- 6.2.2. Healthcare
- 6.2.3. Education
- 6.2.4. Military and Defense
- 6.2.5. Automotive and Manufacturing
- 6.2.6. Retail
- 6.2.7. Other Applications
- 6.1. Market Analysis, Insights and Forecast - by Display Type
- 7. North America Extended Reality Display Industry Analysis, Insights and Forecast, 2020-2032
- 7.1. Market Analysis, Insights and Forecast - by Display Type
- 7.1.1. Liquid Crystal Displays (LCD)
- 7.1.2. Organic Light-Emitting Diode (OLED)
- 7.1.3. Other Display Type
- 7.2. Market Analysis, Insights and Forecast - by End-User Industry
- 7.2.1. Gaming and Entertainment
- 7.2.2. Healthcare
- 7.2.3. Education
- 7.2.4. Military and Defense
- 7.2.5. Automotive and Manufacturing
- 7.2.6. Retail
- 7.2.7. Other Applications
- 7.1. Market Analysis, Insights and Forecast - by Display Type
- 8. Europe Extended Reality Display Industry Analysis, Insights and Forecast, 2020-2032
- 8.1. Market Analysis, Insights and Forecast - by Display Type
- 8.1.1. Liquid Crystal Displays (LCD)
- 8.1.2. Organic Light-Emitting Diode (OLED)
- 8.1.3. Other Display Type
- 8.2. Market Analysis, Insights and Forecast - by End-User Industry
- 8.2.1. Gaming and Entertainment
- 8.2.2. Healthcare
- 8.2.3. Education
- 8.2.4. Military and Defense
- 8.2.5. Automotive and Manufacturing
- 8.2.6. Retail
- 8.2.7. Other Applications
- 8.1. Market Analysis, Insights and Forecast - by Display Type
- 9. Asia Pacific Extended Reality Display Industry Analysis, Insights and Forecast, 2020-2032
- 9.1. Market Analysis, Insights and Forecast - by Display Type
- 9.1.1. Liquid Crystal Displays (LCD)
- 9.1.2. Organic Light-Emitting Diode (OLED)
- 9.1.3. Other Display Type
- 9.2. Market Analysis, Insights and Forecast - by End-User Industry
- 9.2.1. Gaming and Entertainment
- 9.2.2. Healthcare
- 9.2.3. Education
- 9.2.4. Military and Defense
- 9.2.5. Automotive and Manufacturing
- 9.2.6. Retail
- 9.2.7. Other Applications
- 9.1. Market Analysis, Insights and Forecast - by Display Type
- 10. Rest of the World Extended Reality Display Industry Analysis, Insights and Forecast, 2020-2032
- 10.1. Market Analysis, Insights and Forecast - by Display Type
- 10.1.1. Liquid Crystal Displays (LCD)
- 10.1.2. Organic Light-Emitting Diode (OLED)
- 10.1.3. Other Display Type
- 10.2. Market Analysis, Insights and Forecast - by End-User Industry
- 10.2.1. Gaming and Entertainment
- 10.2.2. Healthcare
- 10.2.3. Education
- 10.2.4. Military and Defense
- 10.2.5. Automotive and Manufacturing
- 10.2.6. Retail
- 10.2.7. Other Applications
- 10.1. Market Analysis, Insights and Forecast - by Display Type
- 11. Competitive Analysis
- 11.1. Company Profiles
- 11.1.1 LG Display Co Ltd
- 11.1.1.1. Company Overview
- 11.1.1.2. Products
- 11.1.1.3. Company Financials
- 11.1.1.4. SWOT Analysis
- 11.1.2 Realfiction Holding AB
- 11.1.2.1. Company Overview
- 11.1.2.2. Products
- 11.1.2.3. Company Financials
- 11.1.2.4. SWOT Analysis
- 11.1.3 eMagin Corporation
- 11.1.3.1. Company Overview
- 11.1.3.2. Products
- 11.1.3.3. Company Financials
- 11.1.3.4. SWOT Analysis
- 11.1.4 Samsung Electronics Co Ltd
- 11.1.4.1. Company Overview
- 11.1.4.2. Products
- 11.1.4.3. Company Financials
- 11.1.4.4. SWOT Analysis
- 11.1.5 SA Photonics Inc *List Not Exhaustive
- 11.1.5.1. Company Overview
- 11.1.5.2. Products
- 11.1.5.3. Company Financials
- 11.1.5.4. SWOT Analysis
- 11.1.6 Japan Display Inc
- 11.1.6.1. Company Overview
- 11.1.6.2. Products
- 11.1.6.3. Company Financials
- 11.1.6.4. SWOT Analysis
- 11.1.7 Seiko Epson Corporation
- 11.1.7.1. Company Overview
- 11.1.7.2. Products
- 11.1.7.3. Company Financials
- 11.1.7.4. SWOT Analysis
- 11.1.8 Plessey Company plc
- 11.1.8.1. Company Overview
- 11.1.8.2. Products
- 11.1.8.3. Company Financials
- 11.1.8.4. SWOT Analysis
- 11.1.9 Lumus Ltd
- 11.1.9.1. Company Overview
- 11.1.9.2. Products
- 11.1.9.3. Company Financials
- 11.1.9.4. SWOT Analysis
- 11.1.10 Kopin Corporation
- 11.1.10.1. Company Overview
- 11.1.10.2. Products
- 11.1.10.3. Company Financials
- 11.1.10.4. SWOT Analysis
- 11.1.11 BOE Technology Group Co Ltd
- 11.1.11.1. Company Overview
- 11.1.11.2. Products
- 11.1.11.3. Company Financials
- 11.1.11.4. SWOT Analysis
- 11.1.12 Sony Corporation
- 11.1.12.1. Company Overview
- 11.1.12.2. Products
- 11.1.12.3. Company Financials
- 11.1.12.4. SWOT Analysis
- 11.1.1 LG Display Co Ltd
- 11.2. Market Entropy
- 11.2.1 Company's Key Areas Served
- 11.2.2 Recent Developments
- 11.3. Company Market Share Analysis 2025
- 11.3.1 Top 5 Companies Market Share Analysis
- 11.3.2 Top 3 Companies Market Share Analysis
- 11.4. List of Potential Customers
- 12. Research Methodology
List of Figures
- Figure 1: Global Extended Reality Display Industry Revenue Breakdown (Million, %) by Region 2025 & 2033
- Figure 2: North America Extended Reality Display Industry Revenue (Million), by Display Type 2025 & 2033
- Figure 3: North America Extended Reality Display Industry Revenue Share (%), by Display Type 2025 & 2033
- Figure 4: North America Extended Reality Display Industry Revenue (Million), by End-User Industry 2025 & 2033
- Figure 5: North America Extended Reality Display Industry Revenue Share (%), by End-User Industry 2025 & 2033
- Figure 6: North America Extended Reality Display Industry Revenue (Million), by Country 2025 & 2033
- Figure 7: North America Extended Reality Display Industry Revenue Share (%), by Country 2025 & 2033
- Figure 8: Europe Extended Reality Display Industry Revenue (Million), by Display Type 2025 & 2033
- Figure 9: Europe Extended Reality Display Industry Revenue Share (%), by Display Type 2025 & 2033
- Figure 10: Europe Extended Reality Display Industry Revenue (Million), by End-User Industry 2025 & 2033
- Figure 11: Europe Extended Reality Display Industry Revenue Share (%), by End-User Industry 2025 & 2033
- Figure 12: Europe Extended Reality Display Industry Revenue (Million), by Country 2025 & 2033
- Figure 13: Europe Extended Reality Display Industry Revenue Share (%), by Country 2025 & 2033
- Figure 14: Asia Pacific Extended Reality Display Industry Revenue (Million), by Display Type 2025 & 2033
- Figure 15: Asia Pacific Extended Reality Display Industry Revenue Share (%), by Display Type 2025 & 2033
- Figure 16: Asia Pacific Extended Reality Display Industry Revenue (Million), by End-User Industry 2025 & 2033
- Figure 17: Asia Pacific Extended Reality Display Industry Revenue Share (%), by End-User Industry 2025 & 2033
- Figure 18: Asia Pacific Extended Reality Display Industry Revenue (Million), by Country 2025 & 2033
- Figure 19: Asia Pacific Extended Reality Display Industry Revenue Share (%), by Country 2025 & 2033
- Figure 20: Rest of the World Extended Reality Display Industry Revenue (Million), by Display Type 2025 & 2033
- Figure 21: Rest of the World Extended Reality Display Industry Revenue Share (%), by Display Type 2025 & 2033
- Figure 22: Rest of the World Extended Reality Display Industry Revenue (Million), by End-User Industry 2025 & 2033
- Figure 23: Rest of the World Extended Reality Display Industry Revenue Share (%), by End-User Industry 2025 & 2033
- Figure 24: Rest of the World Extended Reality Display Industry Revenue (Million), by Country 2025 & 2033
- Figure 25: Rest of the World Extended Reality Display Industry Revenue Share (%), by Country 2025 & 2033
List of Tables
- Table 1: Global Extended Reality Display Industry Revenue Million Forecast, by Display Type 2020 & 2033
- Table 2: Global Extended Reality Display Industry Revenue Million Forecast, by End-User Industry 2020 & 2033
- Table 3: Global Extended Reality Display Industry Revenue Million Forecast, by Region 2020 & 2033
- Table 4: Global Extended Reality Display Industry Revenue Million Forecast, by Display Type 2020 & 2033
- Table 5: Global Extended Reality Display Industry Revenue Million Forecast, by End-User Industry 2020 & 2033
- Table 6: Global Extended Reality Display Industry Revenue Million Forecast, by Country 2020 & 2033
- Table 7: Global Extended Reality Display Industry Revenue Million Forecast, by Display Type 2020 & 2033
- Table 8: Global Extended Reality Display Industry Revenue Million Forecast, by End-User Industry 2020 & 2033
- Table 9: Global Extended Reality Display Industry Revenue Million Forecast, by Country 2020 & 2033
- Table 10: Global Extended Reality Display Industry Revenue Million Forecast, by Display Type 2020 & 2033
- Table 11: Global Extended Reality Display Industry Revenue Million Forecast, by End-User Industry 2020 & 2033
- Table 12: Global Extended Reality Display Industry Revenue Million Forecast, by Country 2020 & 2033
- Table 13: Global Extended Reality Display Industry Revenue Million Forecast, by Display Type 2020 & 2033
- Table 14: Global Extended Reality Display Industry Revenue Million Forecast, by End-User Industry 2020 & 2033
- Table 15: Global Extended Reality Display Industry Revenue Million Forecast, by Country 2020 & 2033
Frequently Asked Questions
1. What is the projected Compound Annual Growth Rate (CAGR) of the Extended Reality Display Industry?
The projected CAGR is approximately 46.06%.
2. Which companies are prominent players in the Extended Reality Display Industry?
Key companies in the market include LG Display Co Ltd, Realfiction Holding AB, eMagin Corporation, Samsung Electronics Co Ltd, SA Photonics Inc *List Not Exhaustive, Japan Display Inc, Seiko Epson Corporation, Plessey Company plc, Lumus Ltd, Kopin Corporation, BOE Technology Group Co Ltd, Sony Corporation.
3. What are the main segments of the Extended Reality Display Industry?
The market segments include Display Type, End-User Industry.
4. Can you provide details about the market size?
The market size is estimated to be USD 1.93 Million as of 2022.
5. What are some drivers contributing to market growth?
Rising Adoption of AR and VR Applications Across Multiple End-user Industries; Significant Technological Advancement Across Micros Displays Such as MicroLEDs.
6. What are the notable trends driving market growth?
Rising Adoption of AR and VR Applications Across Multiple End-User Industries.
7. Are there any restraints impacting market growth?
Complex Manufacturing Process Involved for the Production of Displays; Limited Content Available for the Extended Reality Wearables.
8. Can you provide examples of recent developments in the market?
July 2022 - Kopin received production orders totaling approximately USD 3.8 million for its new ultra-bright, full-color Brillian Active Matrix Liquid Crystal Display (AMLCD) used by helicopter pilots to display real-time flight and target information. The current orders have scheduled deliveries through the fourth quarter of 2023.
9. What pricing options are available for accessing the report?
Pricing options include single-user, multi-user, and enterprise licenses priced at USD 4750, USD 5250, and USD 8750 respectively.
10. Is the market size provided in terms of value or volume?
The market size is provided in terms of value, measured in Million.
11. Are there any specific market keywords associated with the report?
Yes, the market keyword associated with the report is "Extended Reality Display Industry," which aids in identifying and referencing the specific market segment covered.
12. How do I determine which pricing option suits my needs best?
The pricing options vary based on user requirements and access needs. Individual users may opt for single-user licenses, while businesses requiring broader access may choose multi-user or enterprise licenses for cost-effective access to the report.
13. Are there any additional resources or data provided in the Extended Reality Display Industry report?
While the report offers comprehensive insights, it's advisable to review the specific contents or supplementary materials provided to ascertain if additional resources or data are available.
14. How can I stay updated on further developments or reports in the Extended Reality Display Industry?
To stay informed about further developments, trends, and reports in the Extended Reality Display Industry, consider subscribing to industry newsletters, following relevant companies and organizations, or regularly checking reputable industry news sources and publications.
Methodology
Step 1 - Identification of Relevant Samples Size from Population Database


Step 2 - Approaches for Defining Global Market Size (Value, Volume* & Price*)

Note*: In applicable scenarios
Step 3 - Data Sources
Primary Research
- Web Analytics
- Survey Reports
- Research Institute
- Latest Research Reports
- Opinion Leaders
Secondary Research
- Annual Reports
- White Paper
- Latest Press Release
- Industry Association
- Paid Database
- Investor Presentations

Step 4 - Data Triangulation
Involves using different sources of information in order to increase the validity of a study
These sources are likely to be stakeholders in a program - participants, other researchers, program staff, other community members, and so on.
Then we put all data in single framework & apply various statistical tools to find out the dynamic on the market.
During the analysis stage, feedback from the stakeholder groups would be compared to determine areas of agreement as well as areas of divergence