

Key Insights
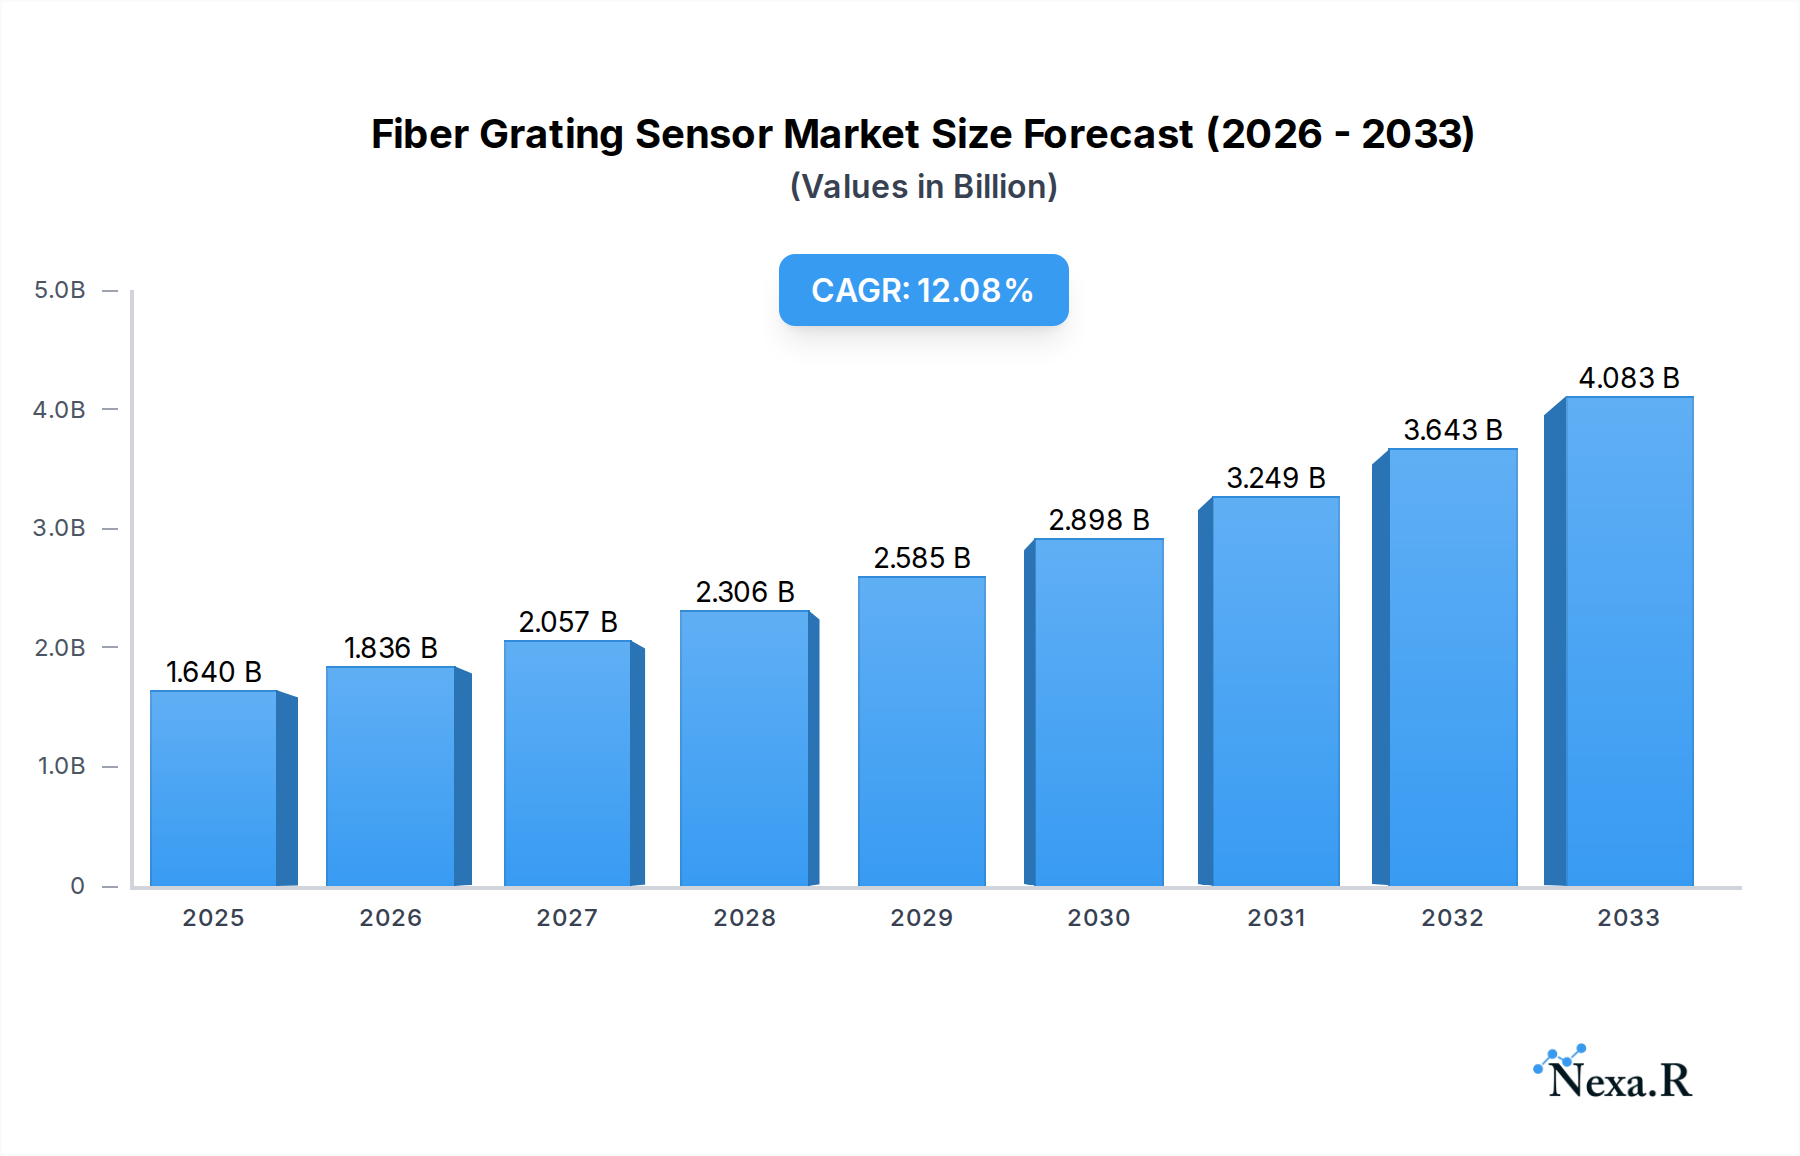
The global Fiber Grating Sensor market is poised for robust expansion, with an estimated market size of $1.64 billion in 2025. This growth trajectory is fueled by a compelling CAGR of 11.9% projected over the forecast period, indicating strong investor confidence and increasing adoption of this advanced sensing technology. The primary drivers for this surge include the escalating demand for enhanced structural health monitoring in critical infrastructure such as water conservancy projects and beam safety applications. As nations prioritize the longevity and safety of their essential assets, the precision and reliability offered by fiber grating sensors become indispensable. Furthermore, the continuous evolution of smart city initiatives and the burgeoning need for real-time, distributed sensing solutions across various industrial sectors are significantly contributing to market acceleration.

Fiber Grating Sensor Market Size (In Billion)
The market is characterized by a dynamic landscape shaped by key trends like miniaturization, increased multiplexing capabilities, and the integration of fiber grating sensors into IoT ecosystems, enabling unprecedented data collection and analysis for predictive maintenance and operational efficiency. While the market exhibits strong growth, potential restraints such as the initial high cost of implementation for certain large-scale projects and the need for specialized expertise in installation and maintenance might present localized challenges. However, the long-term benefits, including low maintenance, immunity to electromagnetic interference, and high bandwidth, are expected to outweigh these considerations. The market is segmented by application into Water Conservancy Projects, Beam Safety Monitoring, and Others, with each segment witnessing unique growth patterns driven by specific industry needs. By type, Strain Transducers and Temperature Sensors are the dominant categories, reflecting their widespread application in stress and temperature measurement.
Fiber Grating Sensor Company Market Share
This in-depth market research report provides a definitive analysis of the global Fiber Grating Sensor market, encompassing its current state, future trajectory, and intricate dynamics. Designed for industry professionals, investors, and stakeholders, this report delivers actionable insights and strategic recommendations based on a rigorous study period from 2019 to 2033, with a base and estimated year of 2025 and a comprehensive forecast period from 2025 to 2033.
Fiber Grating Sensor Market Dynamics & Structure
The global Fiber Grating Sensor market exhibits a moderately concentrated structure, with key players investing heavily in research and development to drive technological innovation. Technological innovation drivers, such as advancements in manufacturing precision and miniaturization of sensing elements, are paramount. The market is also influenced by evolving regulatory frameworks pertaining to structural health monitoring and industrial safety, particularly in critical infrastructure. Competitive product substitutes, including traditional strain gauges and other optical sensing technologies, present a dynamic competitive landscape. Understanding end-user demographics, ranging from large-scale infrastructure developers to specialized industrial manufacturers, is crucial for strategic market penetration. M&A trends are indicative of consolidation efforts and strategic acquisitions aimed at expanding product portfolios and market reach.
- Market Concentration: Dominated by a mix of established players and emerging innovators, indicating a competitive yet evolving landscape.
- Technological Innovation: Continuous progress in grating inscription, packaging, and signal processing fuels enhanced accuracy and new applications.
- Regulatory Influence: Increasing demand for robust safety and monitoring solutions in water conservancy projects and beam safety is a significant driver.
- Competitive Landscape: Competition exists from both traditional sensor types and alternative advanced sensing modalities.
- M&A Activity: Strategic acquisitions are expected to continue as companies seek to enhance their market share and technological capabilities.
Fiber Grating Sensor Growth Trends & Insights
The global Fiber Grating Sensor market is poised for significant expansion, driven by increasing adoption across diverse industrial sectors. The market size is projected to grow from an estimated $1.5 billion in 2025 to $3.2 billion by 2033, exhibiting a Compound Annual Growth Rate (CAGR) of approximately 8.5% during the forecast period. This robust growth is fueled by the inherent advantages of fiber grating sensors, including their immunity to electromagnetic interference, high accuracy, and suitability for harsh environments. Adoption rates are accelerating in sectors like water conservancy, where continuous monitoring of dams and pipelines is critical for preventing catastrophic failures. Technological disruptions, such as the integration of AI and machine learning for predictive maintenance based on sensor data, are further enhancing their value proposition. Shifting consumer behavior towards a greater emphasis on safety, reliability, and long-term asset management is also contributing to the increasing demand for advanced sensing solutions.
The market penetration of fiber grating sensors is expected to deepen as awareness of their benefits grows and as manufacturing costs continue to become more competitive. The inherent ability of these sensors to provide real-time, distributed sensing over long distances makes them ideal for comprehensive monitoring of large-scale infrastructure projects. For instance, in water conservancy projects, their application in monitoring the structural integrity of dams, levees, and pipelines is becoming standard practice. This not only helps in early detection of potential issues but also in optimizing maintenance schedules, leading to substantial cost savings. Similarly, in beam safety monitoring for bridges, tunnels, and other critical structures, fiber grating sensors provide an unparalleled level of insight into stress, strain, and deformation, ensuring public safety and extending the lifespan of these assets.
The evolution of manufacturing processes, including advancements in Fiber Bragg Grating (FBG) fabrication techniques, is leading to more sophisticated and cost-effective sensors. This includes the development of multi-parameter sensors capable of simultaneously measuring strain, temperature, and other environmental factors. The integration of these sensors into the Industrial Internet of Things (IIoT) ecosystem is a key trend, enabling seamless data collection and analysis for enhanced operational efficiency and proactive decision-making. The increasing demand for smart infrastructure and the growing focus on preventive maintenance across industries are expected to be the primary growth accelerators for the Fiber Grating Sensor market in the coming years.
Dominant Regions, Countries, or Segments in Fiber Grating Sensor
The Application segment of Water Conservancy Project is emerging as a dominant force in the global Fiber Grating Sensor market. This dominance is underpinned by substantial investments in infrastructure development and retrofitting, particularly in regions facing water scarcity or prone to natural disasters. The critical need for continuous, reliable monitoring of dams, canals, pipelines, and flood control systems to ensure structural integrity and prevent breaches drives significant demand for these advanced sensors. The market for water conservancy applications is projected to reach $1.1 billion by 2033.
In terms of Type, the Strain Transducer segment is a primary growth engine, expected to contribute $1.8 billion by 2033. Strain transducers are fundamental for measuring deformation and stress in various materials and structures, making them indispensable for monitoring the health of civil infrastructure, industrial machinery, and advanced composite materials. The increasing complexity and scale of infrastructure projects worldwide directly correlate with the demand for precise and durable strain monitoring solutions.
Geographically, Asia-Pacific is poised to be the leading region, driven by rapid industrialization, significant infrastructure investments, and a growing emphasis on safety and environmental protection in countries like China and India. The region is anticipated to command a market share of over 35% by 2033.
- Key Drivers in Water Conservancy Project Application:
- Government initiatives for water management and flood control.
- Aging infrastructure requiring robust monitoring and maintenance.
- Increasing occurrence of extreme weather events.
- Technological advancements enabling distributed and long-term monitoring.
- Key Drivers in Strain Transducer Type:
- Growth in civil engineering and construction projects.
- Demand for structural health monitoring in aerospace and automotive sectors.
- Advancements in composite materials requiring precise strain analysis.
- Industrial automation and machinery monitoring.
- Dominance Factors in Asia-Pacific:
- Massive government spending on infrastructure development.
- Stringent safety regulations for industrial and civil structures.
- Rapid technological adoption and local manufacturing capabilities.
- Growing environmental concerns driving monitoring solutions.
Fiber Grating Sensor Product Landscape
The Fiber Grating Sensor product landscape is characterized by continuous innovation, with manufacturers like FISO Technologies, Brugg Kabel, and YPFC leading the charge. These sensors are increasingly being integrated into comprehensive monitoring systems for applications ranging from civil infrastructure health to industrial process control. Innovations include miniaturized sensor designs for easier deployment, multi-functional gratings capable of simultaneously measuring strain and temperature with high precision, and enhanced packaging for extreme environmental resilience. Corning's advanced fiber optics and Fiberhome's integrated solutions are also shaping the market by providing robust and reliable sensing platforms.
Key Drivers, Barriers & Challenges in Fiber Grating Sensor
Key Drivers: The primary forces propelling the Fiber Grating Sensor market include the escalating need for structural health monitoring in critical infrastructure, advancements in optical sensing technology leading to higher accuracy and reliability, and the inherent advantages of fiber optic sensors over traditional electrical counterparts, such as immunity to electromagnetic interference and corrosion resistance. Growing investments in smart cities and industrial IoT further fuel demand.
Barriers & Challenges: Despite robust growth, the market faces challenges such as the relatively high initial cost of deployment compared to some conventional sensors, the need for specialized expertise for installation and data interpretation, and the ongoing competition from established sensing technologies. Supply chain disruptions for critical optical components and the standardization of data protocols can also pose hurdles. The predicted market value in 2025 is $1.5 billion, with a projected CAGR of 8.5% for the forecast period.
Emerging Opportunities in Fiber Grating Sensor
Emerging opportunities lie in the expansion of fiber grating sensors into new application areas, such as renewable energy infrastructure (wind turbines, solar farms), advanced healthcare monitoring, and subsea exploration. The development of multiplexing techniques allowing for the integration of a high density of sensing points on a single fiber strand opens up possibilities for highly detailed, large-scale monitoring projects. Furthermore, the growing trend of predictive maintenance across industries presents a significant untapped market for the continuous, real-time data provided by these sensors. The parent market, encompassing the broader sensing technologies, is estimated at over $70 billion in 2025.
Growth Accelerators in the Fiber Grating Sensor Industry
Long-term growth in the Fiber Grating Sensor industry will be significantly accelerated by ongoing research into novel grating inscription techniques, enabling faster and more cost-effective manufacturing. Strategic partnerships between sensor manufacturers and system integrators are crucial for developing end-to-end solutions tailored to specific industry needs. Market expansion strategies, particularly targeting emerging economies with substantial infrastructure development plans, will also play a vital role. The continuous drive for miniaturization and enhanced performance metrics will ensure fiber grating sensors remain at the forefront of advanced sensing solutions.
Key Players Shaping the Fiber Grating Sensor Market
- FISO Technologies
- Brugg Kabel
- YPFC
- HTGD
- Fiberhome
- Corning
- ZTT
- Futong
- SDGI
- Yongding
- Tongding
- Fasten
Notable Milestones in Fiber Grating Sensor Sector
- 2019: Increased adoption of FBG sensors in major bridge construction projects for real-time structural health monitoring.
- 2020: Advancements in multiplexing technology allowing for denser sensor networks on single fibers.
- 2021: Growing integration of FBG sensors with AI for predictive maintenance in industrial applications.
- 2022: Enhanced packaging techniques enabling FBG sensors for more extreme environmental conditions, including high temperatures and corrosive environments.
- 2023: Significant investment in R&D for distributed sensing capabilities over longer distances for large-scale infrastructure.
- 2024: Increased demand for FBG sensors in water conservancy projects for enhanced dam and pipeline monitoring.
In-Depth Fiber Grating Sensor Market Outlook
The outlook for the Fiber Grating Sensor market remains exceptionally strong, driven by an unyielding demand for robust, reliable, and precise sensing solutions across critical sectors. Future growth accelerators will stem from the continued integration of these sensors into the burgeoning Industrial Internet of Things (IIoT) ecosystem, enabling advanced data analytics and predictive maintenance strategies. Strategic collaborations and technological breakthroughs in miniaturization and cost reduction will further democratize access to these sophisticated sensing capabilities, paving the way for expanded adoption in emerging markets and novel applications. The child market, specifically focusing on advanced optical sensors, is projected to grow alongside the fiber grating sensor segment, creating a synergistic growth environment with an estimated market value of $5 billion in 2025.
Fiber Grating Sensor Segmentation
-
1. Application
- 1.1. Water Conservancy Project
- 1.2. Beam Safety Monitoring
- 1.3. Other
-
2. Type
- 2.1. Strain Transducer
- 2.2. Temperature Sensor
- 2.3. Other
Fiber Grating Sensor Segmentation By Geography
-
1. North America
- 1.1. United States
- 1.2. Canada
- 1.3. Mexico
-
2. South America
- 2.1. Brazil
- 2.2. Argentina
- 2.3. Rest of South America
-
3. Europe
- 3.1. United Kingdom
- 3.2. Germany
- 3.3. France
- 3.4. Italy
- 3.5. Spain
- 3.6. Russia
- 3.7. Benelux
- 3.8. Nordics
- 3.9. Rest of Europe
-
4. Middle East & Africa
- 4.1. Turkey
- 4.2. Israel
- 4.3. GCC
- 4.4. North Africa
- 4.5. South Africa
- 4.6. Rest of Middle East & Africa
-
5. Asia Pacific
- 5.1. China
- 5.2. India
- 5.3. Japan
- 5.4. South Korea
- 5.5. ASEAN
- 5.6. Oceania
- 5.7. Rest of Asia Pacific
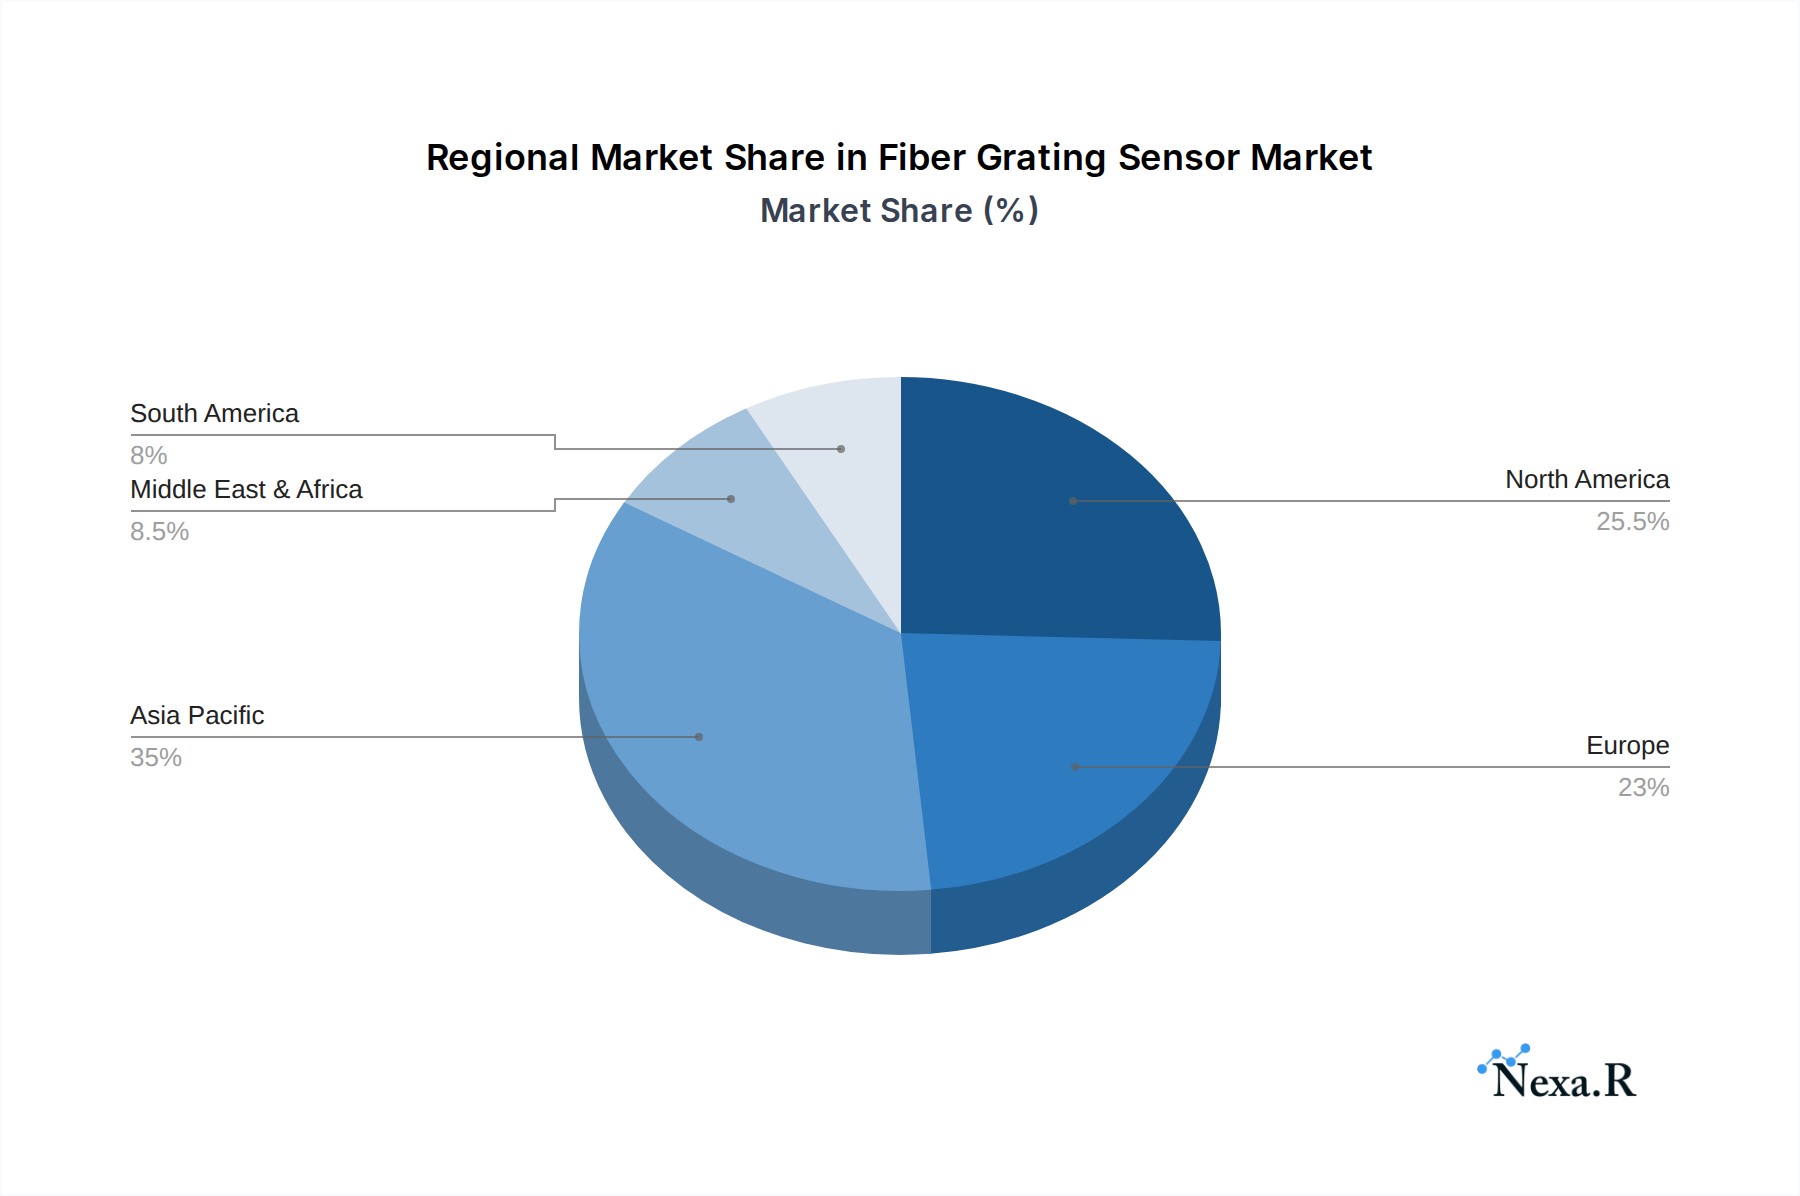
Fiber Grating Sensor Regional Market Share
Geographic Coverage of Fiber Grating Sensor
Fiber Grating Sensor REPORT HIGHLIGHTS
| Aspects | Details |
|---|---|
| Study Period | 2020-2034 |
| Base Year | 2025 |
| Estimated Year | 2026 |
| Forecast Period | 2026-2034 |
| Historical Period | 2020-2025 |
| Growth Rate | CAGR of 11.9% from 2020-2034 |
| Segmentation |
|
Table of Contents
- 1. Introduction
- 1.1. Research Scope
- 1.2. Market Segmentation
- 1.3. Research Methodology
- 1.4. Definitions and Assumptions
- 2. Executive Summary
- 2.1. Introduction
- 3. Market Dynamics
- 3.1. Introduction
- 3.2. Market Drivers
- 3.3. Market Restrains
- 3.4. Market Trends
- 4. Market Factor Analysis
- 4.1. Porters Five Forces
- 4.2. Supply/Value Chain
- 4.3. PESTEL analysis
- 4.4. Market Entropy
- 4.5. Patent/Trademark Analysis
- 5. Global Fiber Grating Sensor Analysis, Insights and Forecast, 2020-2032
- 5.1. Market Analysis, Insights and Forecast - by Application
- 5.1.1. Water Conservancy Project
- 5.1.2. Beam Safety Monitoring
- 5.1.3. Other
- 5.2. Market Analysis, Insights and Forecast - by Type
- 5.2.1. Strain Transducer
- 5.2.2. Temperature Sensor
- 5.2.3. Other
- 5.3. Market Analysis, Insights and Forecast - by Region
- 5.3.1. North America
- 5.3.2. South America
- 5.3.3. Europe
- 5.3.4. Middle East & Africa
- 5.3.5. Asia Pacific
- 5.1. Market Analysis, Insights and Forecast - by Application
- 6. North America Fiber Grating Sensor Analysis, Insights and Forecast, 2020-2032
- 6.1. Market Analysis, Insights and Forecast - by Application
- 6.1.1. Water Conservancy Project
- 6.1.2. Beam Safety Monitoring
- 6.1.3. Other
- 6.2. Market Analysis, Insights and Forecast - by Type
- 6.2.1. Strain Transducer
- 6.2.2. Temperature Sensor
- 6.2.3. Other
- 6.1. Market Analysis, Insights and Forecast - by Application
- 7. South America Fiber Grating Sensor Analysis, Insights and Forecast, 2020-2032
- 7.1. Market Analysis, Insights and Forecast - by Application
- 7.1.1. Water Conservancy Project
- 7.1.2. Beam Safety Monitoring
- 7.1.3. Other
- 7.2. Market Analysis, Insights and Forecast - by Type
- 7.2.1. Strain Transducer
- 7.2.2. Temperature Sensor
- 7.2.3. Other
- 7.1. Market Analysis, Insights and Forecast - by Application
- 8. Europe Fiber Grating Sensor Analysis, Insights and Forecast, 2020-2032
- 8.1. Market Analysis, Insights and Forecast - by Application
- 8.1.1. Water Conservancy Project
- 8.1.2. Beam Safety Monitoring
- 8.1.3. Other
- 8.2. Market Analysis, Insights and Forecast - by Type
- 8.2.1. Strain Transducer
- 8.2.2. Temperature Sensor
- 8.2.3. Other
- 8.1. Market Analysis, Insights and Forecast - by Application
- 9. Middle East & Africa Fiber Grating Sensor Analysis, Insights and Forecast, 2020-2032
- 9.1. Market Analysis, Insights and Forecast - by Application
- 9.1.1. Water Conservancy Project
- 9.1.2. Beam Safety Monitoring
- 9.1.3. Other
- 9.2. Market Analysis, Insights and Forecast - by Type
- 9.2.1. Strain Transducer
- 9.2.2. Temperature Sensor
- 9.2.3. Other
- 9.1. Market Analysis, Insights and Forecast - by Application
- 10. Asia Pacific Fiber Grating Sensor Analysis, Insights and Forecast, 2020-2032
- 10.1. Market Analysis, Insights and Forecast - by Application
- 10.1.1. Water Conservancy Project
- 10.1.2. Beam Safety Monitoring
- 10.1.3. Other
- 10.2. Market Analysis, Insights and Forecast - by Type
- 10.2.1. Strain Transducer
- 10.2.2. Temperature Sensor
- 10.2.3. Other
- 10.1. Market Analysis, Insights and Forecast - by Application
- 11. Competitive Analysis
- 11.1. Global Market Share Analysis 2025
- 11.2. Company Profiles
- 11.2.1 FISO Technologies
- 11.2.1.1. Overview
- 11.2.1.2. Products
- 11.2.1.3. SWOT Analysis
- 11.2.1.4. Recent Developments
- 11.2.1.5. Financials (Based on Availability)
- 11.2.2 Brugg Kabel
- 11.2.2.1. Overview
- 11.2.2.2. Products
- 11.2.2.3. SWOT Analysis
- 11.2.2.4. Recent Developments
- 11.2.2.5. Financials (Based on Availability)
- 11.2.3 YPFC
- 11.2.3.1. Overview
- 11.2.3.2. Products
- 11.2.3.3. SWOT Analysis
- 11.2.3.4. Recent Developments
- 11.2.3.5. Financials (Based on Availability)
- 11.2.4 HTGD
- 11.2.4.1. Overview
- 11.2.4.2. Products
- 11.2.4.3. SWOT Analysis
- 11.2.4.4. Recent Developments
- 11.2.4.5. Financials (Based on Availability)
- 11.2.5 Fiberhome
- 11.2.5.1. Overview
- 11.2.5.2. Products
- 11.2.5.3. SWOT Analysis
- 11.2.5.4. Recent Developments
- 11.2.5.5. Financials (Based on Availability)
- 11.2.6 Corning
- 11.2.6.1. Overview
- 11.2.6.2. Products
- 11.2.6.3. SWOT Analysis
- 11.2.6.4. Recent Developments
- 11.2.6.5. Financials (Based on Availability)
- 11.2.7 ZTT
- 11.2.7.1. Overview
- 11.2.7.2. Products
- 11.2.7.3. SWOT Analysis
- 11.2.7.4. Recent Developments
- 11.2.7.5. Financials (Based on Availability)
- 11.2.8 Futong
- 11.2.8.1. Overview
- 11.2.8.2. Products
- 11.2.8.3. SWOT Analysis
- 11.2.8.4. Recent Developments
- 11.2.8.5. Financials (Based on Availability)
- 11.2.9 SDGI
- 11.2.9.1. Overview
- 11.2.9.2. Products
- 11.2.9.3. SWOT Analysis
- 11.2.9.4. Recent Developments
- 11.2.9.5. Financials (Based on Availability)
- 11.2.10 Yongding
- 11.2.10.1. Overview
- 11.2.10.2. Products
- 11.2.10.3. SWOT Analysis
- 11.2.10.4. Recent Developments
- 11.2.10.5. Financials (Based on Availability)
- 11.2.11 Tongding
- 11.2.11.1. Overview
- 11.2.11.2. Products
- 11.2.11.3. SWOT Analysis
- 11.2.11.4. Recent Developments
- 11.2.11.5. Financials (Based on Availability)
- 11.2.12 Fasten
- 11.2.12.1. Overview
- 11.2.12.2. Products
- 11.2.12.3. SWOT Analysis
- 11.2.12.4. Recent Developments
- 11.2.12.5. Financials (Based on Availability)
- 11.2.1 FISO Technologies
List of Figures
- Figure 1: Global Fiber Grating Sensor Revenue Breakdown (billion, %) by Region 2025 & 2033
- Figure 2: North America Fiber Grating Sensor Revenue (billion), by Application 2025 & 2033
- Figure 3: North America Fiber Grating Sensor Revenue Share (%), by Application 2025 & 2033
- Figure 4: North America Fiber Grating Sensor Revenue (billion), by Type 2025 & 2033
- Figure 5: North America Fiber Grating Sensor Revenue Share (%), by Type 2025 & 2033
- Figure 6: North America Fiber Grating Sensor Revenue (billion), by Country 2025 & 2033
- Figure 7: North America Fiber Grating Sensor Revenue Share (%), by Country 2025 & 2033
- Figure 8: South America Fiber Grating Sensor Revenue (billion), by Application 2025 & 2033
- Figure 9: South America Fiber Grating Sensor Revenue Share (%), by Application 2025 & 2033
- Figure 10: South America Fiber Grating Sensor Revenue (billion), by Type 2025 & 2033
- Figure 11: South America Fiber Grating Sensor Revenue Share (%), by Type 2025 & 2033
- Figure 12: South America Fiber Grating Sensor Revenue (billion), by Country 2025 & 2033
- Figure 13: South America Fiber Grating Sensor Revenue Share (%), by Country 2025 & 2033
- Figure 14: Europe Fiber Grating Sensor Revenue (billion), by Application 2025 & 2033
- Figure 15: Europe Fiber Grating Sensor Revenue Share (%), by Application 2025 & 2033
- Figure 16: Europe Fiber Grating Sensor Revenue (billion), by Type 2025 & 2033
- Figure 17: Europe Fiber Grating Sensor Revenue Share (%), by Type 2025 & 2033
- Figure 18: Europe Fiber Grating Sensor Revenue (billion), by Country 2025 & 2033
- Figure 19: Europe Fiber Grating Sensor Revenue Share (%), by Country 2025 & 2033
- Figure 20: Middle East & Africa Fiber Grating Sensor Revenue (billion), by Application 2025 & 2033
- Figure 21: Middle East & Africa Fiber Grating Sensor Revenue Share (%), by Application 2025 & 2033
- Figure 22: Middle East & Africa Fiber Grating Sensor Revenue (billion), by Type 2025 & 2033
- Figure 23: Middle East & Africa Fiber Grating Sensor Revenue Share (%), by Type 2025 & 2033
- Figure 24: Middle East & Africa Fiber Grating Sensor Revenue (billion), by Country 2025 & 2033
- Figure 25: Middle East & Africa Fiber Grating Sensor Revenue Share (%), by Country 2025 & 2033
- Figure 26: Asia Pacific Fiber Grating Sensor Revenue (billion), by Application 2025 & 2033
- Figure 27: Asia Pacific Fiber Grating Sensor Revenue Share (%), by Application 2025 & 2033
- Figure 28: Asia Pacific Fiber Grating Sensor Revenue (billion), by Type 2025 & 2033
- Figure 29: Asia Pacific Fiber Grating Sensor Revenue Share (%), by Type 2025 & 2033
- Figure 30: Asia Pacific Fiber Grating Sensor Revenue (billion), by Country 2025 & 2033
- Figure 31: Asia Pacific Fiber Grating Sensor Revenue Share (%), by Country 2025 & 2033
List of Tables
- Table 1: Global Fiber Grating Sensor Revenue billion Forecast, by Application 2020 & 2033
- Table 2: Global Fiber Grating Sensor Revenue billion Forecast, by Type 2020 & 2033
- Table 3: Global Fiber Grating Sensor Revenue billion Forecast, by Region 2020 & 2033
- Table 4: Global Fiber Grating Sensor Revenue billion Forecast, by Application 2020 & 2033
- Table 5: Global Fiber Grating Sensor Revenue billion Forecast, by Type 2020 & 2033
- Table 6: Global Fiber Grating Sensor Revenue billion Forecast, by Country 2020 & 2033
- Table 7: United States Fiber Grating Sensor Revenue (billion) Forecast, by Application 2020 & 2033
- Table 8: Canada Fiber Grating Sensor Revenue (billion) Forecast, by Application 2020 & 2033
- Table 9: Mexico Fiber Grating Sensor Revenue (billion) Forecast, by Application 2020 & 2033
- Table 10: Global Fiber Grating Sensor Revenue billion Forecast, by Application 2020 & 2033
- Table 11: Global Fiber Grating Sensor Revenue billion Forecast, by Type 2020 & 2033
- Table 12: Global Fiber Grating Sensor Revenue billion Forecast, by Country 2020 & 2033
- Table 13: Brazil Fiber Grating Sensor Revenue (billion) Forecast, by Application 2020 & 2033
- Table 14: Argentina Fiber Grating Sensor Revenue (billion) Forecast, by Application 2020 & 2033
- Table 15: Rest of South America Fiber Grating Sensor Revenue (billion) Forecast, by Application 2020 & 2033
- Table 16: Global Fiber Grating Sensor Revenue billion Forecast, by Application 2020 & 2033
- Table 17: Global Fiber Grating Sensor Revenue billion Forecast, by Type 2020 & 2033
- Table 18: Global Fiber Grating Sensor Revenue billion Forecast, by Country 2020 & 2033
- Table 19: United Kingdom Fiber Grating Sensor Revenue (billion) Forecast, by Application 2020 & 2033
- Table 20: Germany Fiber Grating Sensor Revenue (billion) Forecast, by Application 2020 & 2033
- Table 21: France Fiber Grating Sensor Revenue (billion) Forecast, by Application 2020 & 2033
- Table 22: Italy Fiber Grating Sensor Revenue (billion) Forecast, by Application 2020 & 2033
- Table 23: Spain Fiber Grating Sensor Revenue (billion) Forecast, by Application 2020 & 2033
- Table 24: Russia Fiber Grating Sensor Revenue (billion) Forecast, by Application 2020 & 2033
- Table 25: Benelux Fiber Grating Sensor Revenue (billion) Forecast, by Application 2020 & 2033
- Table 26: Nordics Fiber Grating Sensor Revenue (billion) Forecast, by Application 2020 & 2033
- Table 27: Rest of Europe Fiber Grating Sensor Revenue (billion) Forecast, by Application 2020 & 2033
- Table 28: Global Fiber Grating Sensor Revenue billion Forecast, by Application 2020 & 2033
- Table 29: Global Fiber Grating Sensor Revenue billion Forecast, by Type 2020 & 2033
- Table 30: Global Fiber Grating Sensor Revenue billion Forecast, by Country 2020 & 2033
- Table 31: Turkey Fiber Grating Sensor Revenue (billion) Forecast, by Application 2020 & 2033
- Table 32: Israel Fiber Grating Sensor Revenue (billion) Forecast, by Application 2020 & 2033
- Table 33: GCC Fiber Grating Sensor Revenue (billion) Forecast, by Application 2020 & 2033
- Table 34: North Africa Fiber Grating Sensor Revenue (billion) Forecast, by Application 2020 & 2033
- Table 35: South Africa Fiber Grating Sensor Revenue (billion) Forecast, by Application 2020 & 2033
- Table 36: Rest of Middle East & Africa Fiber Grating Sensor Revenue (billion) Forecast, by Application 2020 & 2033
- Table 37: Global Fiber Grating Sensor Revenue billion Forecast, by Application 2020 & 2033
- Table 38: Global Fiber Grating Sensor Revenue billion Forecast, by Type 2020 & 2033
- Table 39: Global Fiber Grating Sensor Revenue billion Forecast, by Country 2020 & 2033
- Table 40: China Fiber Grating Sensor Revenue (billion) Forecast, by Application 2020 & 2033
- Table 41: India Fiber Grating Sensor Revenue (billion) Forecast, by Application 2020 & 2033
- Table 42: Japan Fiber Grating Sensor Revenue (billion) Forecast, by Application 2020 & 2033
- Table 43: South Korea Fiber Grating Sensor Revenue (billion) Forecast, by Application 2020 & 2033
- Table 44: ASEAN Fiber Grating Sensor Revenue (billion) Forecast, by Application 2020 & 2033
- Table 45: Oceania Fiber Grating Sensor Revenue (billion) Forecast, by Application 2020 & 2033
- Table 46: Rest of Asia Pacific Fiber Grating Sensor Revenue (billion) Forecast, by Application 2020 & 2033
Frequently Asked Questions
1. What is the projected Compound Annual Growth Rate (CAGR) of the Fiber Grating Sensor?
The projected CAGR is approximately 11.9%.
2. Which companies are prominent players in the Fiber Grating Sensor?
Key companies in the market include FISO Technologies, Brugg Kabel, YPFC, HTGD, Fiberhome, Corning, ZTT, Futong, SDGI, Yongding, Tongding, Fasten.
3. What are the main segments of the Fiber Grating Sensor?
The market segments include Application, Type.
4. Can you provide details about the market size?
The market size is estimated to be USD 1.64 billion as of 2022.
5. What are some drivers contributing to market growth?
N/A
6. What are the notable trends driving market growth?
N/A
7. Are there any restraints impacting market growth?
N/A
8. Can you provide examples of recent developments in the market?
N/A
9. What pricing options are available for accessing the report?
Pricing options include single-user, multi-user, and enterprise licenses priced at USD 2900.00, USD 4350.00, and USD 5800.00 respectively.
10. Is the market size provided in terms of value or volume?
The market size is provided in terms of value, measured in billion.
11. Are there any specific market keywords associated with the report?
Yes, the market keyword associated with the report is "Fiber Grating Sensor," which aids in identifying and referencing the specific market segment covered.
12. How do I determine which pricing option suits my needs best?
The pricing options vary based on user requirements and access needs. Individual users may opt for single-user licenses, while businesses requiring broader access may choose multi-user or enterprise licenses for cost-effective access to the report.
13. Are there any additional resources or data provided in the Fiber Grating Sensor report?
While the report offers comprehensive insights, it's advisable to review the specific contents or supplementary materials provided to ascertain if additional resources or data are available.
14. How can I stay updated on further developments or reports in the Fiber Grating Sensor?
To stay informed about further developments, trends, and reports in the Fiber Grating Sensor, consider subscribing to industry newsletters, following relevant companies and organizations, or regularly checking reputable industry news sources and publications.
Methodology
Step 1 - Identification of Relevant Samples Size from Population Database


Step 2 - Approaches for Defining Global Market Size (Value, Volume* & Price*)

Note*: In applicable scenarios
Step 3 - Data Sources
Primary Research
- Web Analytics
- Survey Reports
- Research Institute
- Latest Research Reports
- Opinion Leaders
Secondary Research
- Annual Reports
- White Paper
- Latest Press Release
- Industry Association
- Paid Database
- Investor Presentations

Step 4 - Data Triangulation
Involves using different sources of information in order to increase the validity of a study
These sources are likely to be stakeholders in a program - participants, other researchers, program staff, other community members, and so on.
Then we put all data in single framework & apply various statistical tools to find out the dynamic on the market.
During the analysis stage, feedback from the stakeholder groups would be compared to determine areas of agreement as well as areas of divergence