

Key Insights
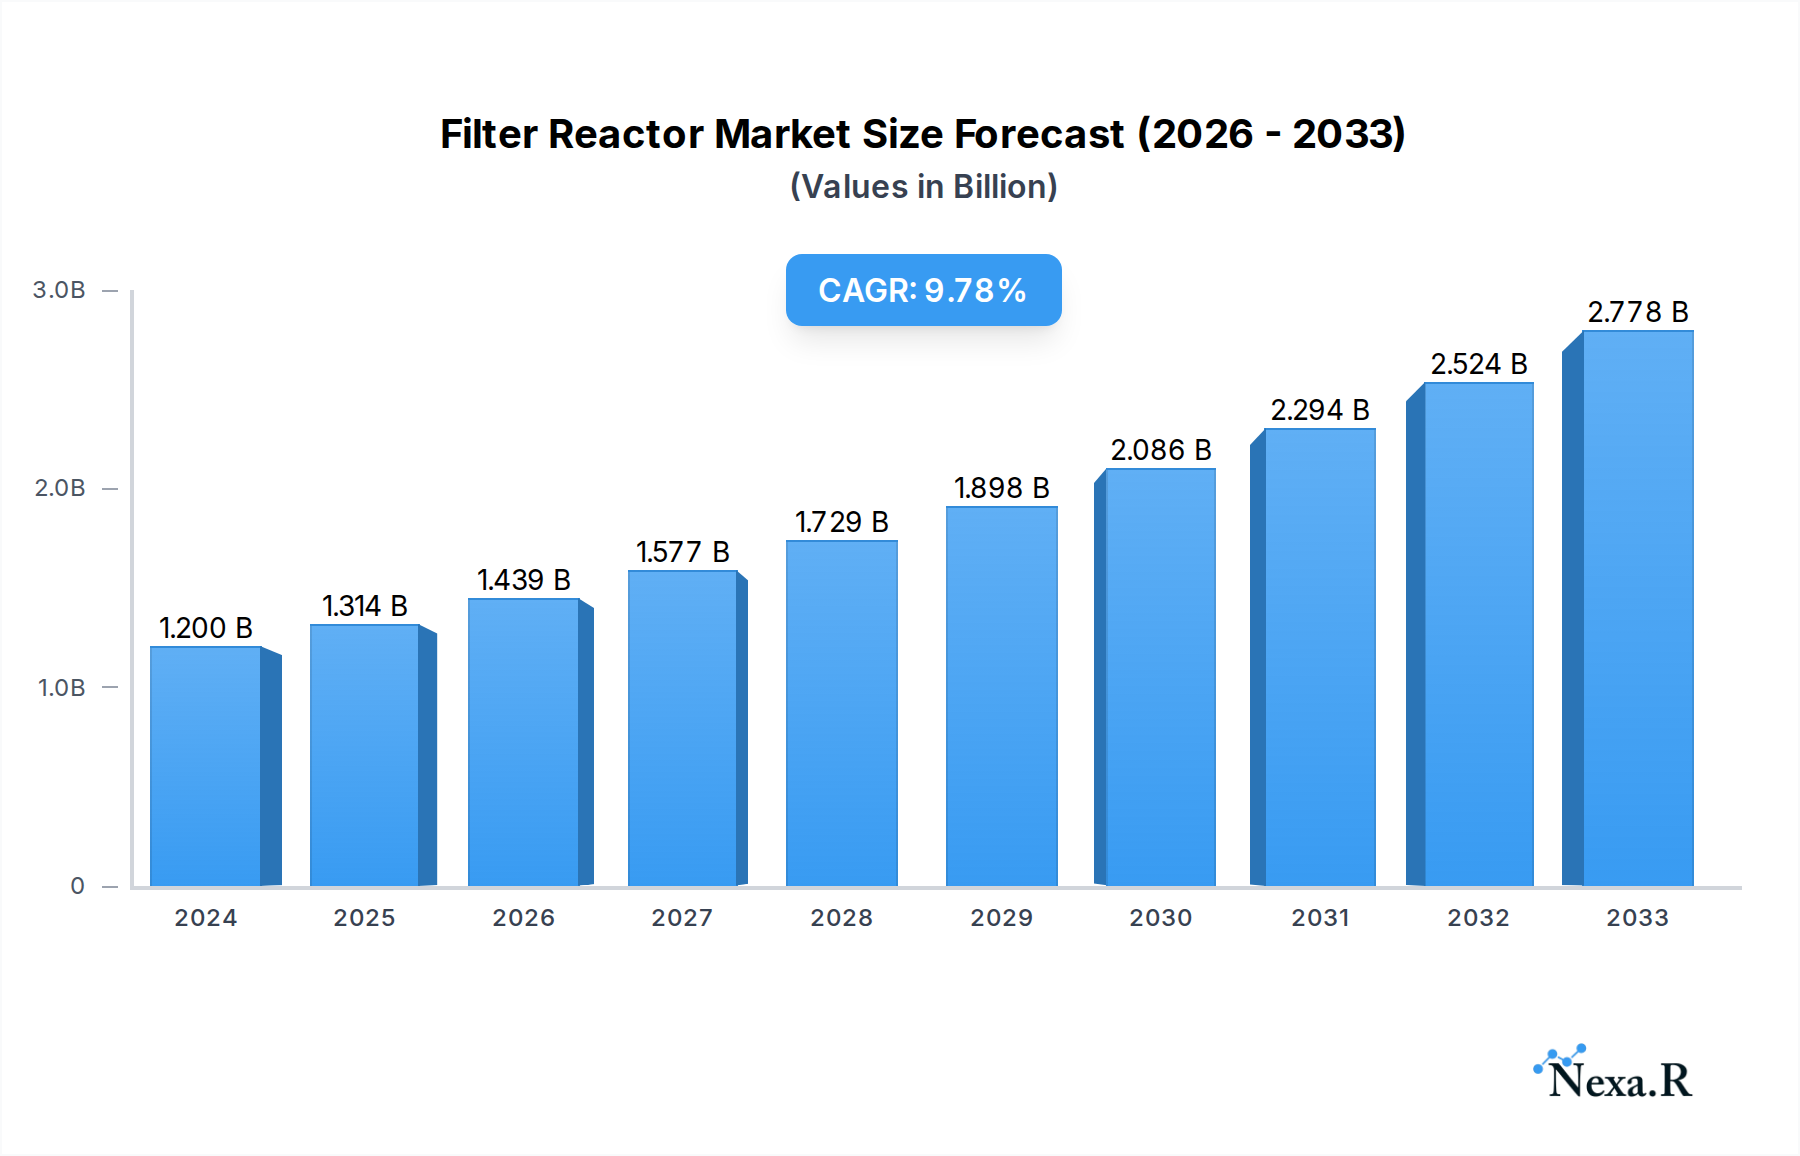
The global Filter Reactor market is poised for significant expansion, projecting a market size of $1.2 billion in 2024, with a robust Compound Annual Growth Rate (CAGR) of 9.5% anticipated through 2033. This impressive growth is primarily propelled by the escalating demand for efficient power quality management across critical sectors. The manufacturing field, in particular, is a substantial driver, as industries increasingly invest in filter reactors to mitigate harmonic distortions and ensure the smooth operation of sensitive machinery, thereby improving production efficiency and reducing downtime. The energy sector also presents a key growth avenue, with the integration of renewable energy sources like solar and wind power introducing new challenges in grid stability and power quality, which filter reactors effectively address. Furthermore, the pharmaceutical industry's stringent regulatory requirements for stable and clean power supplies further contribute to market expansion.

Filter Reactor Market Size (In Billion)
The market's upward trajectory is further supported by emerging trends such as the development of advanced, compact, and highly efficient filter reactor designs, catering to space-constrained applications. The increasing adoption of smart grid technologies, which necessitate precise control over power flow and harmonic suppression, also fuels demand. While the market is experiencing strong growth, certain restraints could influence its pace. The initial capital investment required for advanced filter reactor systems and the availability of cost-effective alternatives in niche applications might pose challenges. However, the long-term benefits of improved energy efficiency, reduced equipment failure, and enhanced grid reliability are expected to outweigh these initial concerns, solidifying the filter reactor market's positive outlook across its diverse applications and segments.
Filter Reactor Company Market Share
Filter Reactor Market Dynamics & Structure
The global Filter Reactor market is characterized by a moderately consolidated structure, with key players like Siemens, Coil Innovation, and Trench holding significant shares. Technological innovation is primarily driven by advancements in power electronics, material science for improved insulation and core materials, and sophisticated control algorithms for enhanced filtering efficiency and reduced harmonic distortion. Stringent regulations regarding power quality and grid stability worldwide are acting as significant drivers, pushing for the adoption of advanced filter reactors. Competitive product substitutes, while present in the form of active filters, are often more expensive, positioning passive filter reactors as a cost-effective solution for many industrial applications. End-user demographics reveal a strong reliance on the manufacturing and energy sectors, with increasing adoption in renewable energy integration and electric vehicle charging infrastructure. Mergers and acquisitions are expected to play a crucial role in market consolidation, with recent deals focusing on enhancing product portfolios and expanding geographical reach. For instance, the acquisition of smaller specialized manufacturers by larger conglomerates aims to leverage economies of scale and R&D capabilities. The market is projected to be valued at approximately $2.5 billion in 2025, with a projected CAGR of 5.8% during the forecast period.
- Market Concentration: Moderately consolidated with top 5 players holding approximately 45% of the market share.
- Technological Innovation: Focus on high-efficiency materials, intelligent control systems, and compact designs.
- Regulatory Frameworks: Driving adoption through power quality standards and grid stability mandates.
- Competitive Substitutes: Active filters present a higher-cost alternative for specific advanced applications.
- End-User Demographics: Dominance of manufacturing and energy sectors, with growing applications in renewables.
- M&A Trends: Strategic acquisitions aimed at portfolio expansion and market consolidation.
Filter Reactor Growth Trends & Insights
The global Filter Reactor market is poised for substantial growth, driven by the ever-increasing demand for clean and reliable power across various industries. The market size, estimated at $2.5 billion in the base year of 2025, is projected to reach an impressive $4.0 billion by the end of the forecast period in 2033. This growth trajectory is underpinned by a Compound Annual Growth Rate (CAGR) of approximately 5.8%. The adoption rates of filter reactors are steadily increasing, fueled by a growing awareness of power quality issues and their detrimental effects on industrial equipment, productivity, and energy efficiency. Technological disruptions, such as the development of novel amorphous and nanocrystalline core materials, are leading to the creation of smaller, lighter, and more efficient filter reactors. These advancements not only improve performance but also reduce installation space and operational costs, making them more attractive to end-users.
Consumer behavior shifts are also playing a pivotal role. Industries are increasingly prioritizing investments in infrastructure that ensures uninterrupted and high-quality power supply. This is particularly evident in sectors like data centers, the pharmaceutical industry, and advanced manufacturing, where even minor power fluctuations can lead to significant financial losses and compromised product quality. The integration of renewable energy sources, such as solar and wind power, into the grid necessitates advanced filtering solutions to mitigate harmonic distortions and ensure grid stability. This trend alone is expected to contribute significantly to market expansion. Furthermore, the electrification of transportation and the increasing adoption of electric vehicles are creating new avenues for filter reactor applications in charging infrastructure, further accelerating market penetration. The historical period from 2019 to 2024 witnessed steady growth, laying a strong foundation for the accelerated expansion anticipated in the coming years. The market penetration of advanced filter reactors is projected to rise from 35% in 2025 to over 55% by 2033, indicating a significant shift towards sophisticated power quality solutions.
Dominant Regions, Countries, or Segments in Filter Reactor
The Energy Field stands as the dominant segment within the global Filter Reactor market, driven by the immense demand for stable and efficient power distribution and integration of renewable energy sources. This segment is projected to hold a market share of approximately 40% by 2025, with significant growth anticipated throughout the forecast period. The increasing global focus on sustainable energy solutions and the expansion of smart grids worldwide are directly contributing to the robust demand for filter reactors. These devices are crucial for mitigating harmonics generated by power electronic converters used in solar inverters, wind turbines, and energy storage systems, ensuring seamless integration with existing power infrastructure.
Leading countries within this segment, such as the United States and China, are at the forefront of this growth. The United States' emphasis on grid modernization, coupled with substantial investments in renewable energy projects, fuels a consistent demand for advanced filter reactors. China, as a global manufacturing powerhouse and a leader in renewable energy deployment, presents a massive market for these components. Economic policies that encourage the adoption of clean energy and incentivize grid stability are key drivers in these regions. Furthermore, the burgeoning demand for electricity to support industrial growth and urbanization in emerging economies further amplifies the importance of robust power infrastructure, where filter reactors play a critical role.
Within the Energy Field, the Three Phase type of filter reactor is overwhelmingly dominant, accounting for over 75% of the segment's market share. This is due to the prevalence of three-phase power systems in high-voltage transmission, industrial machinery, and large-scale energy generation and distribution networks. The capacity of three-phase systems to handle higher power loads makes them the standard for most energy-related applications. Infrastructure development, including the construction of new power plants, transmission lines, and substations, directly translates into increased demand for three-phase filter reactors. Government initiatives promoting energy efficiency and grid resilience are also acting as significant catalysts for market expansion in these dominant regions and within the energy sector.
- Dominant Application: Energy Field (projected 40% market share in 2025).
- Key Geographic Drivers: United States and China due to renewable energy adoption and grid modernization.
- Dominant Type: Three Phase (over 75% of the Energy Field segment).
- Growth Catalysts: Renewable energy integration, smart grid development, economic policies promoting clean energy.
- Infrastructure Impact: New power plant construction, transmission line expansion, and substation upgrades.
Filter Reactor Product Landscape
The Filter Reactor product landscape is witnessing a surge in innovations focused on enhanced performance, miniaturization, and improved thermal management. Manufacturers are increasingly leveraging advanced materials like amorphous and nanocrystalline alloys for reactor cores, enabling higher magnetic flux densities, lower core losses, and consequently, more compact and efficient designs compared to traditional laminated steel cores. Developments in winding technologies, including sophisticated insulation techniques and optimized winding patterns, further contribute to reduced parasitic capacitance and improved high-frequency performance, crucial for filtering out complex harmonic distortions. Smart functionalities are also being integrated, with some advanced filter reactors featuring built-in monitoring capabilities for temperature, current, and impedance, allowing for predictive maintenance and optimized operational efficiency. Applications span across the manufacturing field for motor drives and welding equipment, the energy field for grid stabilization and renewable integration, the pharmaceutical field for sensitive process equipment, and the power field for substations and power conditioning. These product advancements are tailored to meet the evolving demands for cleaner power and greater energy efficiency across diverse industrial sectors.
Key Drivers, Barriers & Challenges in Filter Reactor
Key Drivers:
- Increasing Power Quality Concerns: Growing awareness of the detrimental effects of harmonics on industrial equipment, leading to demand for effective filtering solutions.
- Renewable Energy Integration: The proliferation of solar and wind power necessitates advanced filtering to stabilize grids.
- Electrification Trends: Expansion of electric vehicle charging infrastructure and industrial automation drives demand for cleaner power.
- Stringent Regulatory Standards: Government mandates for power quality and grid reliability are a significant impetus.
- Technological Advancements: Development of higher efficiency materials and compact designs making reactors more appealing.
Key Barriers & Challenges:
- High Initial Investment Costs: Compared to simpler filtering components, advanced filter reactors can represent a significant upfront cost.
- Competition from Active Filters: While more expensive, active filters offer superior performance in certain complex harmonic scenarios.
- Supply Chain Volatility: Fluctuations in the availability and cost of raw materials like copper and specialized alloys can impact production and pricing.
- Technical Expertise Requirement: Proper selection and installation of filter reactors require specialized engineering knowledge, which may be a barrier for smaller enterprises.
- Maintenance and Lifespan Considerations: While generally robust, potential for overheating or insulation degradation requires careful monitoring and periodic maintenance, adding to operational costs.
Emerging Opportunities in Filter Reactor
Emerging opportunities in the Filter Reactor market lie in the burgeoning demand for intelligent and adaptive filtering solutions for microgrids and distributed energy systems. The increasing complexity of power networks, with the integration of various renewable sources and energy storage systems, creates a need for more dynamic and responsive filtering technologies. Opportunities also exist in developing specialized filter reactors for niche applications such as high-power electric arc furnaces, advanced semiconductor manufacturing, and critical data center power supplies where extreme power quality is paramount. Furthermore, the trend towards urbanization and smart city initiatives will drive demand for robust and efficient power infrastructure, including advanced filter reactors for public utilities and transportation networks. The development of compact, modular, and plug-and-play filter reactor solutions tailored for smaller industrial setups and commercial buildings also presents a significant growth avenue.
Growth Accelerators in the Filter Reactor Industry
Several key factors are accelerating growth in the Filter Reactor industry. Technological breakthroughs in material science, leading to the development of highly efficient and compact magnetic core materials, are a primary catalyst. These advancements enable the production of smaller, lighter, and more cost-effective filter reactors, broadening their applicability across various sectors. Strategic partnerships between filter reactor manufacturers and key players in the renewable energy and industrial automation sectors are fostering innovation and market penetration. For example, collaborations to develop integrated filtering solutions for solar inverters or advanced motor drives are proving highly successful. Market expansion strategies, including the establishment of robust distribution networks in emerging economies and the development of tailored product offerings for specific regional demands, are also playing a crucial role in driving long-term growth. The increasing focus on sustainability and energy efficiency across industries worldwide is further fueling the demand for filter reactors as essential components for maintaining optimal power quality and reducing energy wastage.
Key Players Shaping the Filter Reactor Market
- Siemens
- Coil Innovation
- Trench
- Trinity Energy Systems
- Trafotek
- Asahi Glassplant
- Hans von Mangoldt GmbH
- Elektra
- GlasKeller
- Electrica Energy Products
- Hilkar
Notable Milestones in Filter Reactor Sector
- 2019: Launch of advanced amorphous core filter reactors offering 20% improved efficiency.
- 2020: Siemens acquires a specialized power quality solutions provider to enhance its filter reactor portfolio.
- 2021: HANNOVER MESSE showcases next-generation compact filter reactor designs for industrial applications.
- 2022: Introduction of intelligent filter reactors with integrated monitoring and predictive maintenance capabilities.
- 2023: Significant increase in M&A activity, with several smaller manufacturers being acquired by larger players to consolidate market presence.
- 2024: Development of novel insulation materials extending the operational lifespan of filter reactors in high-temperature environments.
In-Depth Filter Reactor Market Outlook
The future outlook for the Filter Reactor market is exceptionally promising, driven by a confluence of technological innovation, supportive regulatory landscapes, and the relentless pursuit of energy efficiency and grid stability. The ongoing transition towards renewable energy sources and the increasing electrification of various sectors will continue to be significant growth accelerators. Companies that focus on developing smart, adaptive, and highly efficient filter reactor solutions, potentially integrating advanced digital technologies for remote monitoring and control, will be well-positioned to capture market share. Strategic collaborations and targeted investments in research and development, particularly in areas like advanced materials and miniaturization, will be crucial for maintaining a competitive edge. The market's trajectory indicates not just a quantitative expansion in value, but also a qualitative shift towards more sophisticated and integrated power quality management systems, presenting substantial strategic opportunities for key stakeholders.
Filter Reactor Segmentation
-
1. Application
- 1.1. Manufacturing Field
- 1.2. Energy Field
- 1.3. Pharmaceutical Field
- 1.4. Power Field
- 1.5. Others
-
2. Types
- 2.1. Three Phase
- 2.2. Two Phase
Filter Reactor Segmentation By Geography
-
1. North America
- 1.1. United States
- 1.2. Canada
- 1.3. Mexico
-
2. South America
- 2.1. Brazil
- 2.2. Argentina
- 2.3. Rest of South America
-
3. Europe
- 3.1. United Kingdom
- 3.2. Germany
- 3.3. France
- 3.4. Italy
- 3.5. Spain
- 3.6. Russia
- 3.7. Benelux
- 3.8. Nordics
- 3.9. Rest of Europe
-
4. Middle East & Africa
- 4.1. Turkey
- 4.2. Israel
- 4.3. GCC
- 4.4. North Africa
- 4.5. South Africa
- 4.6. Rest of Middle East & Africa
-
5. Asia Pacific
- 5.1. China
- 5.2. India
- 5.3. Japan
- 5.4. South Korea
- 5.5. ASEAN
- 5.6. Oceania
- 5.7. Rest of Asia Pacific
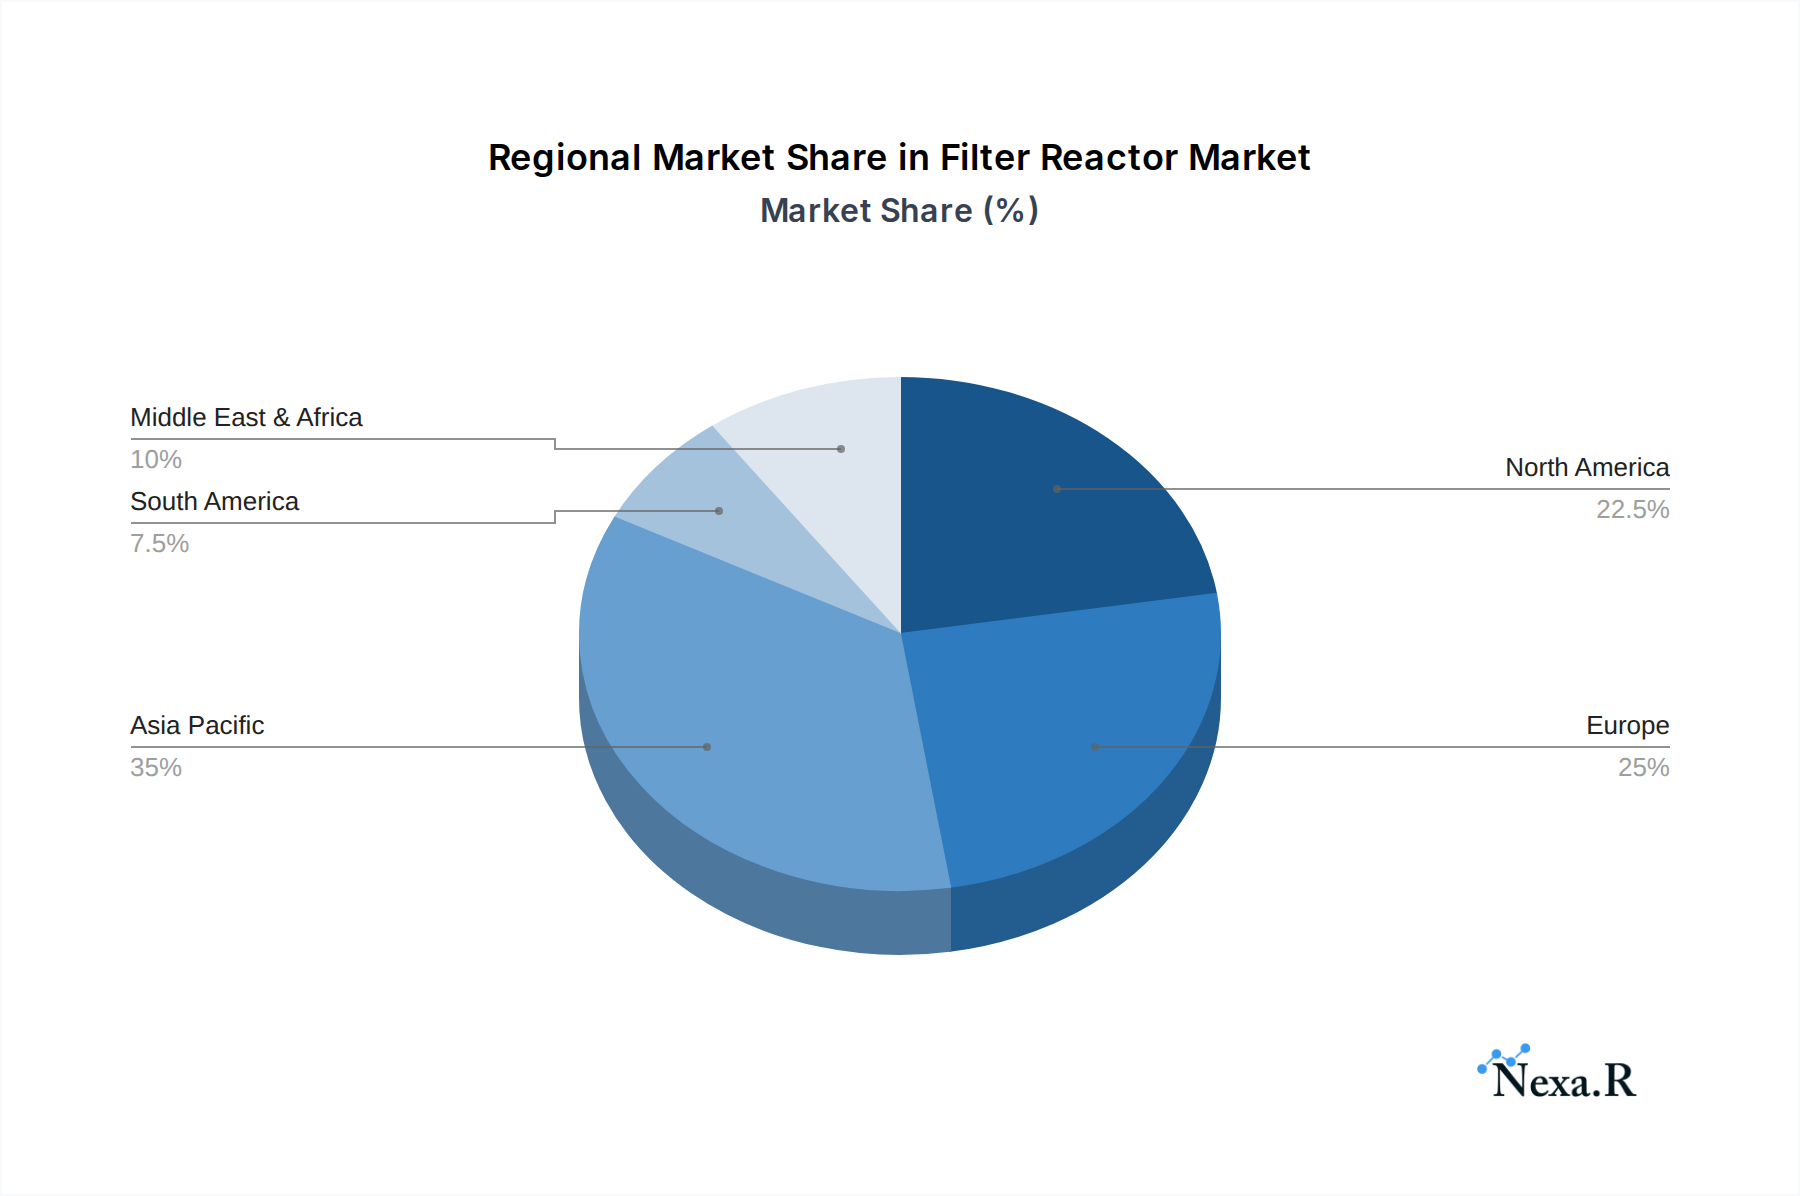
Filter Reactor Regional Market Share
Geographic Coverage of Filter Reactor
Filter Reactor REPORT HIGHLIGHTS
| Aspects | Details |
|---|---|
| Study Period | 2020-2034 |
| Base Year | 2025 |
| Estimated Year | 2026 |
| Forecast Period | 2026-2034 |
| Historical Period | 2020-2025 |
| Growth Rate | CAGR of 9.5% from 2020-2034 |
| Segmentation |
|
Table of Contents
- 1. Introduction
- 1.1. Research Scope
- 1.2. Market Segmentation
- 1.3. Research Methodology
- 1.4. Definitions and Assumptions
- 2. Executive Summary
- 2.1. Introduction
- 3. Market Dynamics
- 3.1. Introduction
- 3.2. Market Drivers
- 3.3. Market Restrains
- 3.4. Market Trends
- 4. Market Factor Analysis
- 4.1. Porters Five Forces
- 4.2. Supply/Value Chain
- 4.3. PESTEL analysis
- 4.4. Market Entropy
- 4.5. Patent/Trademark Analysis
- 5. Global Filter Reactor Analysis, Insights and Forecast, 2020-2032
- 5.1. Market Analysis, Insights and Forecast - by Application
- 5.1.1. Manufacturing Field
- 5.1.2. Energy Field
- 5.1.3. Pharmaceutical Field
- 5.1.4. Power Field
- 5.1.5. Others
- 5.2. Market Analysis, Insights and Forecast - by Types
- 5.2.1. Three Phase
- 5.2.2. Two Phase
- 5.3. Market Analysis, Insights and Forecast - by Region
- 5.3.1. North America
- 5.3.2. South America
- 5.3.3. Europe
- 5.3.4. Middle East & Africa
- 5.3.5. Asia Pacific
- 5.1. Market Analysis, Insights and Forecast - by Application
- 6. North America Filter Reactor Analysis, Insights and Forecast, 2020-2032
- 6.1. Market Analysis, Insights and Forecast - by Application
- 6.1.1. Manufacturing Field
- 6.1.2. Energy Field
- 6.1.3. Pharmaceutical Field
- 6.1.4. Power Field
- 6.1.5. Others
- 6.2. Market Analysis, Insights and Forecast - by Types
- 6.2.1. Three Phase
- 6.2.2. Two Phase
- 6.1. Market Analysis, Insights and Forecast - by Application
- 7. South America Filter Reactor Analysis, Insights and Forecast, 2020-2032
- 7.1. Market Analysis, Insights and Forecast - by Application
- 7.1.1. Manufacturing Field
- 7.1.2. Energy Field
- 7.1.3. Pharmaceutical Field
- 7.1.4. Power Field
- 7.1.5. Others
- 7.2. Market Analysis, Insights and Forecast - by Types
- 7.2.1. Three Phase
- 7.2.2. Two Phase
- 7.1. Market Analysis, Insights and Forecast - by Application
- 8. Europe Filter Reactor Analysis, Insights and Forecast, 2020-2032
- 8.1. Market Analysis, Insights and Forecast - by Application
- 8.1.1. Manufacturing Field
- 8.1.2. Energy Field
- 8.1.3. Pharmaceutical Field
- 8.1.4. Power Field
- 8.1.5. Others
- 8.2. Market Analysis, Insights and Forecast - by Types
- 8.2.1. Three Phase
- 8.2.2. Two Phase
- 8.1. Market Analysis, Insights and Forecast - by Application
- 9. Middle East & Africa Filter Reactor Analysis, Insights and Forecast, 2020-2032
- 9.1. Market Analysis, Insights and Forecast - by Application
- 9.1.1. Manufacturing Field
- 9.1.2. Energy Field
- 9.1.3. Pharmaceutical Field
- 9.1.4. Power Field
- 9.1.5. Others
- 9.2. Market Analysis, Insights and Forecast - by Types
- 9.2.1. Three Phase
- 9.2.2. Two Phase
- 9.1. Market Analysis, Insights and Forecast - by Application
- 10. Asia Pacific Filter Reactor Analysis, Insights and Forecast, 2020-2032
- 10.1. Market Analysis, Insights and Forecast - by Application
- 10.1.1. Manufacturing Field
- 10.1.2. Energy Field
- 10.1.3. Pharmaceutical Field
- 10.1.4. Power Field
- 10.1.5. Others
- 10.2. Market Analysis, Insights and Forecast - by Types
- 10.2.1. Three Phase
- 10.2.2. Two Phase
- 10.1. Market Analysis, Insights and Forecast - by Application
- 11. Competitive Analysis
- 11.1. Global Market Share Analysis 2025
- 11.2. Company Profiles
- 11.2.1 Coil Innovation
- 11.2.1.1. Overview
- 11.2.1.2. Products
- 11.2.1.3. SWOT Analysis
- 11.2.1.4. Recent Developments
- 11.2.1.5. Financials (Based on Availability)
- 11.2.2 Trench
- 11.2.2.1. Overview
- 11.2.2.2. Products
- 11.2.2.3. SWOT Analysis
- 11.2.2.4. Recent Developments
- 11.2.2.5. Financials (Based on Availability)
- 11.2.3 Trinity Energy Systems
- 11.2.3.1. Overview
- 11.2.3.2. Products
- 11.2.3.3. SWOT Analysis
- 11.2.3.4. Recent Developments
- 11.2.3.5. Financials (Based on Availability)
- 11.2.4 Elektra
- 11.2.4.1. Overview
- 11.2.4.2. Products
- 11.2.4.3. SWOT Analysis
- 11.2.4.4. Recent Developments
- 11.2.4.5. Financials (Based on Availability)
- 11.2.5 Asahi Glassplant
- 11.2.5.1. Overview
- 11.2.5.2. Products
- 11.2.5.3. SWOT Analysis
- 11.2.5.4. Recent Developments
- 11.2.5.5. Financials (Based on Availability)
- 11.2.6 Hans von Mangoldt GmbH
- 11.2.6.1. Overview
- 11.2.6.2. Products
- 11.2.6.3. SWOT Analysis
- 11.2.6.4. Recent Developments
- 11.2.6.5. Financials (Based on Availability)
- 11.2.7 Trafotek
- 11.2.7.1. Overview
- 11.2.7.2. Products
- 11.2.7.3. SWOT Analysis
- 11.2.7.4. Recent Developments
- 11.2.7.5. Financials (Based on Availability)
- 11.2.8 HANNOVER MESSE
- 11.2.8.1. Overview
- 11.2.8.2. Products
- 11.2.8.3. SWOT Analysis
- 11.2.8.4. Recent Developments
- 11.2.8.5. Financials (Based on Availability)
- 11.2.9 GlasKeller
- 11.2.9.1. Overview
- 11.2.9.2. Products
- 11.2.9.3. SWOT Analysis
- 11.2.9.4. Recent Developments
- 11.2.9.5. Financials (Based on Availability)
- 11.2.10 Electrica Energy Products
- 11.2.10.1. Overview
- 11.2.10.2. Products
- 11.2.10.3. SWOT Analysis
- 11.2.10.4. Recent Developments
- 11.2.10.5. Financials (Based on Availability)
- 11.2.11 Hilkar
- 11.2.11.1. Overview
- 11.2.11.2. Products
- 11.2.11.3. SWOT Analysis
- 11.2.11.4. Recent Developments
- 11.2.11.5. Financials (Based on Availability)
- 11.2.12 Siemens
- 11.2.12.1. Overview
- 11.2.12.2. Products
- 11.2.12.3. SWOT Analysis
- 11.2.12.4. Recent Developments
- 11.2.12.5. Financials (Based on Availability)
- 11.2.1 Coil Innovation
List of Figures
- Figure 1: Global Filter Reactor Revenue Breakdown (undefined, %) by Region 2025 & 2033
- Figure 2: Global Filter Reactor Volume Breakdown (K, %) by Region 2025 & 2033
- Figure 3: North America Filter Reactor Revenue (undefined), by Application 2025 & 2033
- Figure 4: North America Filter Reactor Volume (K), by Application 2025 & 2033
- Figure 5: North America Filter Reactor Revenue Share (%), by Application 2025 & 2033
- Figure 6: North America Filter Reactor Volume Share (%), by Application 2025 & 2033
- Figure 7: North America Filter Reactor Revenue (undefined), by Types 2025 & 2033
- Figure 8: North America Filter Reactor Volume (K), by Types 2025 & 2033
- Figure 9: North America Filter Reactor Revenue Share (%), by Types 2025 & 2033
- Figure 10: North America Filter Reactor Volume Share (%), by Types 2025 & 2033
- Figure 11: North America Filter Reactor Revenue (undefined), by Country 2025 & 2033
- Figure 12: North America Filter Reactor Volume (K), by Country 2025 & 2033
- Figure 13: North America Filter Reactor Revenue Share (%), by Country 2025 & 2033
- Figure 14: North America Filter Reactor Volume Share (%), by Country 2025 & 2033
- Figure 15: South America Filter Reactor Revenue (undefined), by Application 2025 & 2033
- Figure 16: South America Filter Reactor Volume (K), by Application 2025 & 2033
- Figure 17: South America Filter Reactor Revenue Share (%), by Application 2025 & 2033
- Figure 18: South America Filter Reactor Volume Share (%), by Application 2025 & 2033
- Figure 19: South America Filter Reactor Revenue (undefined), by Types 2025 & 2033
- Figure 20: South America Filter Reactor Volume (K), by Types 2025 & 2033
- Figure 21: South America Filter Reactor Revenue Share (%), by Types 2025 & 2033
- Figure 22: South America Filter Reactor Volume Share (%), by Types 2025 & 2033
- Figure 23: South America Filter Reactor Revenue (undefined), by Country 2025 & 2033
- Figure 24: South America Filter Reactor Volume (K), by Country 2025 & 2033
- Figure 25: South America Filter Reactor Revenue Share (%), by Country 2025 & 2033
- Figure 26: South America Filter Reactor Volume Share (%), by Country 2025 & 2033
- Figure 27: Europe Filter Reactor Revenue (undefined), by Application 2025 & 2033
- Figure 28: Europe Filter Reactor Volume (K), by Application 2025 & 2033
- Figure 29: Europe Filter Reactor Revenue Share (%), by Application 2025 & 2033
- Figure 30: Europe Filter Reactor Volume Share (%), by Application 2025 & 2033
- Figure 31: Europe Filter Reactor Revenue (undefined), by Types 2025 & 2033
- Figure 32: Europe Filter Reactor Volume (K), by Types 2025 & 2033
- Figure 33: Europe Filter Reactor Revenue Share (%), by Types 2025 & 2033
- Figure 34: Europe Filter Reactor Volume Share (%), by Types 2025 & 2033
- Figure 35: Europe Filter Reactor Revenue (undefined), by Country 2025 & 2033
- Figure 36: Europe Filter Reactor Volume (K), by Country 2025 & 2033
- Figure 37: Europe Filter Reactor Revenue Share (%), by Country 2025 & 2033
- Figure 38: Europe Filter Reactor Volume Share (%), by Country 2025 & 2033
- Figure 39: Middle East & Africa Filter Reactor Revenue (undefined), by Application 2025 & 2033
- Figure 40: Middle East & Africa Filter Reactor Volume (K), by Application 2025 & 2033
- Figure 41: Middle East & Africa Filter Reactor Revenue Share (%), by Application 2025 & 2033
- Figure 42: Middle East & Africa Filter Reactor Volume Share (%), by Application 2025 & 2033
- Figure 43: Middle East & Africa Filter Reactor Revenue (undefined), by Types 2025 & 2033
- Figure 44: Middle East & Africa Filter Reactor Volume (K), by Types 2025 & 2033
- Figure 45: Middle East & Africa Filter Reactor Revenue Share (%), by Types 2025 & 2033
- Figure 46: Middle East & Africa Filter Reactor Volume Share (%), by Types 2025 & 2033
- Figure 47: Middle East & Africa Filter Reactor Revenue (undefined), by Country 2025 & 2033
- Figure 48: Middle East & Africa Filter Reactor Volume (K), by Country 2025 & 2033
- Figure 49: Middle East & Africa Filter Reactor Revenue Share (%), by Country 2025 & 2033
- Figure 50: Middle East & Africa Filter Reactor Volume Share (%), by Country 2025 & 2033
- Figure 51: Asia Pacific Filter Reactor Revenue (undefined), by Application 2025 & 2033
- Figure 52: Asia Pacific Filter Reactor Volume (K), by Application 2025 & 2033
- Figure 53: Asia Pacific Filter Reactor Revenue Share (%), by Application 2025 & 2033
- Figure 54: Asia Pacific Filter Reactor Volume Share (%), by Application 2025 & 2033
- Figure 55: Asia Pacific Filter Reactor Revenue (undefined), by Types 2025 & 2033
- Figure 56: Asia Pacific Filter Reactor Volume (K), by Types 2025 & 2033
- Figure 57: Asia Pacific Filter Reactor Revenue Share (%), by Types 2025 & 2033
- Figure 58: Asia Pacific Filter Reactor Volume Share (%), by Types 2025 & 2033
- Figure 59: Asia Pacific Filter Reactor Revenue (undefined), by Country 2025 & 2033
- Figure 60: Asia Pacific Filter Reactor Volume (K), by Country 2025 & 2033
- Figure 61: Asia Pacific Filter Reactor Revenue Share (%), by Country 2025 & 2033
- Figure 62: Asia Pacific Filter Reactor Volume Share (%), by Country 2025 & 2033
List of Tables
- Table 1: Global Filter Reactor Revenue undefined Forecast, by Application 2020 & 2033
- Table 2: Global Filter Reactor Volume K Forecast, by Application 2020 & 2033
- Table 3: Global Filter Reactor Revenue undefined Forecast, by Types 2020 & 2033
- Table 4: Global Filter Reactor Volume K Forecast, by Types 2020 & 2033
- Table 5: Global Filter Reactor Revenue undefined Forecast, by Region 2020 & 2033
- Table 6: Global Filter Reactor Volume K Forecast, by Region 2020 & 2033
- Table 7: Global Filter Reactor Revenue undefined Forecast, by Application 2020 & 2033
- Table 8: Global Filter Reactor Volume K Forecast, by Application 2020 & 2033
- Table 9: Global Filter Reactor Revenue undefined Forecast, by Types 2020 & 2033
- Table 10: Global Filter Reactor Volume K Forecast, by Types 2020 & 2033
- Table 11: Global Filter Reactor Revenue undefined Forecast, by Country 2020 & 2033
- Table 12: Global Filter Reactor Volume K Forecast, by Country 2020 & 2033
- Table 13: United States Filter Reactor Revenue (undefined) Forecast, by Application 2020 & 2033
- Table 14: United States Filter Reactor Volume (K) Forecast, by Application 2020 & 2033
- Table 15: Canada Filter Reactor Revenue (undefined) Forecast, by Application 2020 & 2033
- Table 16: Canada Filter Reactor Volume (K) Forecast, by Application 2020 & 2033
- Table 17: Mexico Filter Reactor Revenue (undefined) Forecast, by Application 2020 & 2033
- Table 18: Mexico Filter Reactor Volume (K) Forecast, by Application 2020 & 2033
- Table 19: Global Filter Reactor Revenue undefined Forecast, by Application 2020 & 2033
- Table 20: Global Filter Reactor Volume K Forecast, by Application 2020 & 2033
- Table 21: Global Filter Reactor Revenue undefined Forecast, by Types 2020 & 2033
- Table 22: Global Filter Reactor Volume K Forecast, by Types 2020 & 2033
- Table 23: Global Filter Reactor Revenue undefined Forecast, by Country 2020 & 2033
- Table 24: Global Filter Reactor Volume K Forecast, by Country 2020 & 2033
- Table 25: Brazil Filter Reactor Revenue (undefined) Forecast, by Application 2020 & 2033
- Table 26: Brazil Filter Reactor Volume (K) Forecast, by Application 2020 & 2033
- Table 27: Argentina Filter Reactor Revenue (undefined) Forecast, by Application 2020 & 2033
- Table 28: Argentina Filter Reactor Volume (K) Forecast, by Application 2020 & 2033
- Table 29: Rest of South America Filter Reactor Revenue (undefined) Forecast, by Application 2020 & 2033
- Table 30: Rest of South America Filter Reactor Volume (K) Forecast, by Application 2020 & 2033
- Table 31: Global Filter Reactor Revenue undefined Forecast, by Application 2020 & 2033
- Table 32: Global Filter Reactor Volume K Forecast, by Application 2020 & 2033
- Table 33: Global Filter Reactor Revenue undefined Forecast, by Types 2020 & 2033
- Table 34: Global Filter Reactor Volume K Forecast, by Types 2020 & 2033
- Table 35: Global Filter Reactor Revenue undefined Forecast, by Country 2020 & 2033
- Table 36: Global Filter Reactor Volume K Forecast, by Country 2020 & 2033
- Table 37: United Kingdom Filter Reactor Revenue (undefined) Forecast, by Application 2020 & 2033
- Table 38: United Kingdom Filter Reactor Volume (K) Forecast, by Application 2020 & 2033
- Table 39: Germany Filter Reactor Revenue (undefined) Forecast, by Application 2020 & 2033
- Table 40: Germany Filter Reactor Volume (K) Forecast, by Application 2020 & 2033
- Table 41: France Filter Reactor Revenue (undefined) Forecast, by Application 2020 & 2033
- Table 42: France Filter Reactor Volume (K) Forecast, by Application 2020 & 2033
- Table 43: Italy Filter Reactor Revenue (undefined) Forecast, by Application 2020 & 2033
- Table 44: Italy Filter Reactor Volume (K) Forecast, by Application 2020 & 2033
- Table 45: Spain Filter Reactor Revenue (undefined) Forecast, by Application 2020 & 2033
- Table 46: Spain Filter Reactor Volume (K) Forecast, by Application 2020 & 2033
- Table 47: Russia Filter Reactor Revenue (undefined) Forecast, by Application 2020 & 2033
- Table 48: Russia Filter Reactor Volume (K) Forecast, by Application 2020 & 2033
- Table 49: Benelux Filter Reactor Revenue (undefined) Forecast, by Application 2020 & 2033
- Table 50: Benelux Filter Reactor Volume (K) Forecast, by Application 2020 & 2033
- Table 51: Nordics Filter Reactor Revenue (undefined) Forecast, by Application 2020 & 2033
- Table 52: Nordics Filter Reactor Volume (K) Forecast, by Application 2020 & 2033
- Table 53: Rest of Europe Filter Reactor Revenue (undefined) Forecast, by Application 2020 & 2033
- Table 54: Rest of Europe Filter Reactor Volume (K) Forecast, by Application 2020 & 2033
- Table 55: Global Filter Reactor Revenue undefined Forecast, by Application 2020 & 2033
- Table 56: Global Filter Reactor Volume K Forecast, by Application 2020 & 2033
- Table 57: Global Filter Reactor Revenue undefined Forecast, by Types 2020 & 2033
- Table 58: Global Filter Reactor Volume K Forecast, by Types 2020 & 2033
- Table 59: Global Filter Reactor Revenue undefined Forecast, by Country 2020 & 2033
- Table 60: Global Filter Reactor Volume K Forecast, by Country 2020 & 2033
- Table 61: Turkey Filter Reactor Revenue (undefined) Forecast, by Application 2020 & 2033
- Table 62: Turkey Filter Reactor Volume (K) Forecast, by Application 2020 & 2033
- Table 63: Israel Filter Reactor Revenue (undefined) Forecast, by Application 2020 & 2033
- Table 64: Israel Filter Reactor Volume (K) Forecast, by Application 2020 & 2033
- Table 65: GCC Filter Reactor Revenue (undefined) Forecast, by Application 2020 & 2033
- Table 66: GCC Filter Reactor Volume (K) Forecast, by Application 2020 & 2033
- Table 67: North Africa Filter Reactor Revenue (undefined) Forecast, by Application 2020 & 2033
- Table 68: North Africa Filter Reactor Volume (K) Forecast, by Application 2020 & 2033
- Table 69: South Africa Filter Reactor Revenue (undefined) Forecast, by Application 2020 & 2033
- Table 70: South Africa Filter Reactor Volume (K) Forecast, by Application 2020 & 2033
- Table 71: Rest of Middle East & Africa Filter Reactor Revenue (undefined) Forecast, by Application 2020 & 2033
- Table 72: Rest of Middle East & Africa Filter Reactor Volume (K) Forecast, by Application 2020 & 2033
- Table 73: Global Filter Reactor Revenue undefined Forecast, by Application 2020 & 2033
- Table 74: Global Filter Reactor Volume K Forecast, by Application 2020 & 2033
- Table 75: Global Filter Reactor Revenue undefined Forecast, by Types 2020 & 2033
- Table 76: Global Filter Reactor Volume K Forecast, by Types 2020 & 2033
- Table 77: Global Filter Reactor Revenue undefined Forecast, by Country 2020 & 2033
- Table 78: Global Filter Reactor Volume K Forecast, by Country 2020 & 2033
- Table 79: China Filter Reactor Revenue (undefined) Forecast, by Application 2020 & 2033
- Table 80: China Filter Reactor Volume (K) Forecast, by Application 2020 & 2033
- Table 81: India Filter Reactor Revenue (undefined) Forecast, by Application 2020 & 2033
- Table 82: India Filter Reactor Volume (K) Forecast, by Application 2020 & 2033
- Table 83: Japan Filter Reactor Revenue (undefined) Forecast, by Application 2020 & 2033
- Table 84: Japan Filter Reactor Volume (K) Forecast, by Application 2020 & 2033
- Table 85: South Korea Filter Reactor Revenue (undefined) Forecast, by Application 2020 & 2033
- Table 86: South Korea Filter Reactor Volume (K) Forecast, by Application 2020 & 2033
- Table 87: ASEAN Filter Reactor Revenue (undefined) Forecast, by Application 2020 & 2033
- Table 88: ASEAN Filter Reactor Volume (K) Forecast, by Application 2020 & 2033
- Table 89: Oceania Filter Reactor Revenue (undefined) Forecast, by Application 2020 & 2033
- Table 90: Oceania Filter Reactor Volume (K) Forecast, by Application 2020 & 2033
- Table 91: Rest of Asia Pacific Filter Reactor Revenue (undefined) Forecast, by Application 2020 & 2033
- Table 92: Rest of Asia Pacific Filter Reactor Volume (K) Forecast, by Application 2020 & 2033
Frequently Asked Questions
1. What is the projected Compound Annual Growth Rate (CAGR) of the Filter Reactor?
The projected CAGR is approximately 9.5%.
2. Which companies are prominent players in the Filter Reactor?
Key companies in the market include Coil Innovation, Trench, Trinity Energy Systems, Elektra, Asahi Glassplant, Hans von Mangoldt GmbH, Trafotek, HANNOVER MESSE, GlasKeller, Electrica Energy Products, Hilkar, Siemens.
3. What are the main segments of the Filter Reactor?
The market segments include Application, Types.
4. Can you provide details about the market size?
The market size is estimated to be USD XXX N/A as of 2022.
5. What are some drivers contributing to market growth?
N/A
6. What are the notable trends driving market growth?
N/A
7. Are there any restraints impacting market growth?
N/A
8. Can you provide examples of recent developments in the market?
N/A
9. What pricing options are available for accessing the report?
Pricing options include single-user, multi-user, and enterprise licenses priced at USD 3350.00, USD 5025.00, and USD 6700.00 respectively.
10. Is the market size provided in terms of value or volume?
The market size is provided in terms of value, measured in N/A and volume, measured in K.
11. Are there any specific market keywords associated with the report?
Yes, the market keyword associated with the report is "Filter Reactor," which aids in identifying and referencing the specific market segment covered.
12. How do I determine which pricing option suits my needs best?
The pricing options vary based on user requirements and access needs. Individual users may opt for single-user licenses, while businesses requiring broader access may choose multi-user or enterprise licenses for cost-effective access to the report.
13. Are there any additional resources or data provided in the Filter Reactor report?
While the report offers comprehensive insights, it's advisable to review the specific contents or supplementary materials provided to ascertain if additional resources or data are available.
14. How can I stay updated on further developments or reports in the Filter Reactor?
To stay informed about further developments, trends, and reports in the Filter Reactor, consider subscribing to industry newsletters, following relevant companies and organizations, or regularly checking reputable industry news sources and publications.
Methodology
Step 1 - Identification of Relevant Samples Size from Population Database


Step 2 - Approaches for Defining Global Market Size (Value, Volume* & Price*)

Note*: In applicable scenarios
Step 3 - Data Sources
Primary Research
- Web Analytics
- Survey Reports
- Research Institute
- Latest Research Reports
- Opinion Leaders
Secondary Research
- Annual Reports
- White Paper
- Latest Press Release
- Industry Association
- Paid Database
- Investor Presentations

Step 4 - Data Triangulation
Involves using different sources of information in order to increase the validity of a study
These sources are likely to be stakeholders in a program - participants, other researchers, program staff, other community members, and so on.
Then we put all data in single framework & apply various statistical tools to find out the dynamic on the market.
During the analysis stage, feedback from the stakeholder groups would be compared to determine areas of agreement as well as areas of divergence