

Key Insights
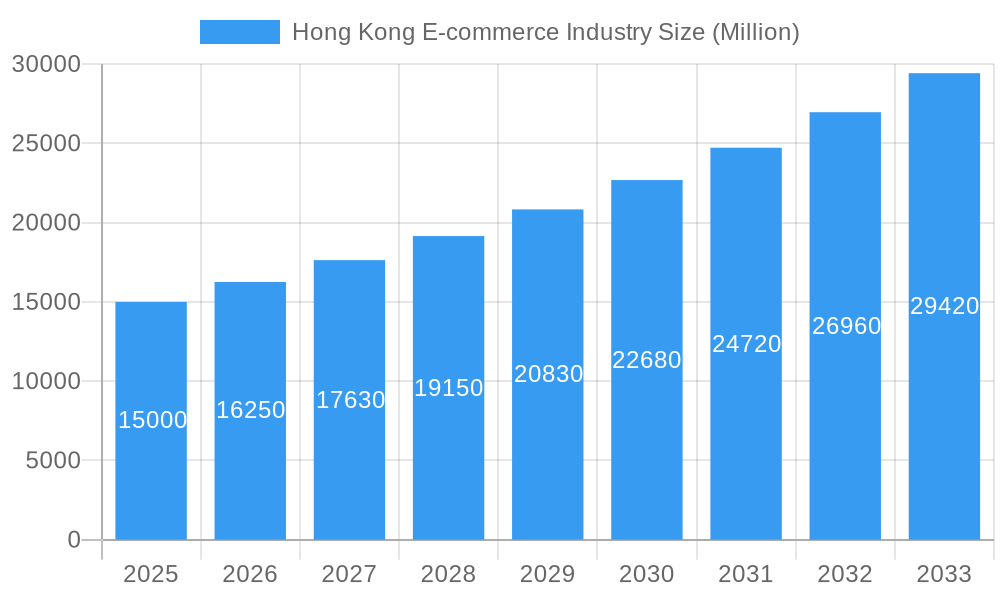
Hong Kong's e-commerce sector is poised for substantial growth, projected at a Compound Annual Growth Rate (CAGR) of 7.87%. This expansion is fueled by widespread internet and smartphone adoption, a digitally native consumer base, and the inherent convenience of online retail. Major e-commerce platforms are enhancing customer experiences through advanced mobile payment solutions and robust logistics. The market is segmented by application, with notable growth in fashion, electronics, groceries, and essential goods. Despite competitive pressures, the market's strong growth potential remains attractive. The increasing adoption of mobile and social commerce further accelerates market expansion. The estimated market size for 2025 is $5.34 billion, with significant projected growth through 2033.
Hong Kong E-commerce Industry Market Size (In Billion)
Hong Kong's advanced digital infrastructure and consumer behavior underpin its thriving e-commerce ecosystem, favoring secure and seamless online transactions. While opportunities abound for domestic and international businesses, challenges related to data privacy, logistics, and maintaining competitive advantage in a dynamic global market persist. The sustained high CAGR indicates a positive market outlook, making Hong Kong an attractive landscape for established players and new entrants alike. Future success hinges on adapting to evolving consumer demands, embracing technological innovation, and proactively addressing market challenges.
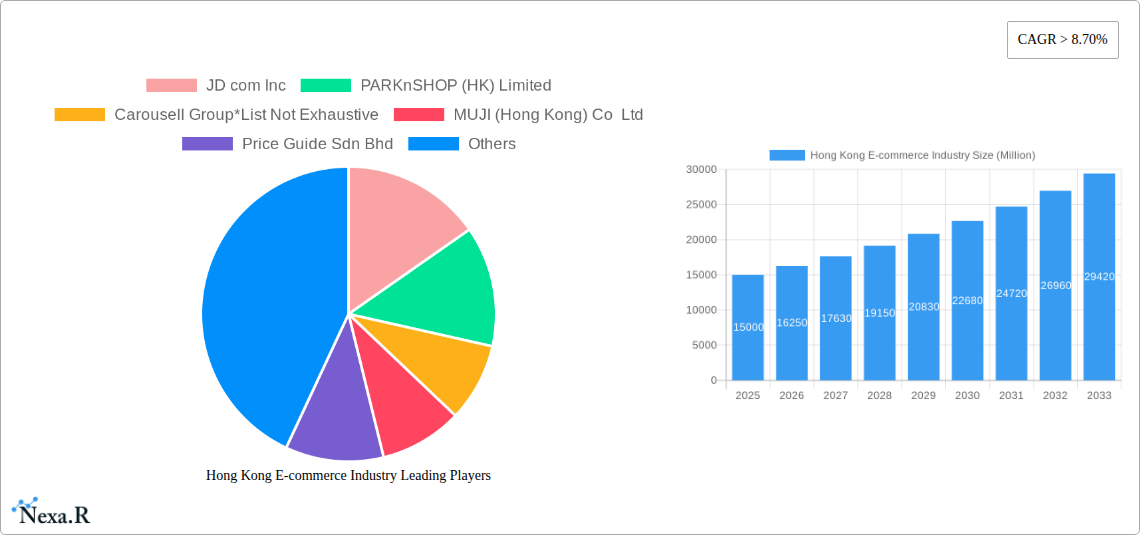
Hong Kong E-commerce Industry Company Market Share
Hong Kong E-commerce Industry: 2019-2033 Market Report
This comprehensive report provides a deep dive into the dynamic Hong Kong e-commerce industry, offering invaluable insights for businesses, investors, and industry professionals. Analyzing the period from 2019 to 2033, with a focus on 2025, this report covers market size, growth trends, key players, and future opportunities across various segments. The report uses Million units as the measurement for all values.
Keywords: Hong Kong e-commerce, online retail Hong Kong, Hong Kong digital market, e-commerce market Hong Kong, Hong Kong online shopping, e-commerce industry trends Hong Kong, Hong Kong e-commerce growth, B2C e-commerce Hong Kong, Hong Kong online marketplace, e-commerce market analysis Hong Kong.
Hong Kong E-commerce Industry Market Dynamics & Structure
This section analyzes the competitive landscape, technological advancements, regulatory environment, and market trends within the Hong Kong e-commerce sector. The study period covers 2019-2033, with 2025 as the base and estimated year. The forecast period spans 2025-2033 and the historical period 2019-2024.
- Market Concentration: The Hong Kong e-commerce market exhibits a moderately concentrated structure, with a few dominant players and a large number of smaller businesses. xx% of the market is held by the top 5 players in 2025.
- Technological Innovation: Rapid advancements in mobile commerce, AI-powered personalization, and logistics technologies are driving market growth. The adoption of blockchain technology for supply chain transparency is also gaining traction.
- Regulatory Framework: Government regulations concerning data privacy, consumer protection, and cross-border e-commerce significantly influence market dynamics. Recent regulatory changes have focused on enhancing consumer trust and protecting data security.
- Competitive Product Substitutes: Traditional brick-and-mortar retail continues to compete with online channels, but the dominance of e-commerce continues to increase due to its convenience and wider product selection.
- End-User Demographics: The Hong Kong e-commerce market is driven by a young, tech-savvy population with high internet penetration and mobile usage. This demographic actively engages in online shopping and digital payments.
- M&A Trends: The Hong Kong e-commerce industry has witnessed a significant number of mergers and acquisitions (M&A) deals in recent years, totaling xx Million units in value between 2019 and 2024. These deals reflect market consolidation and expansion strategies of major players.
Hong Kong E-commerce Industry Growth Trends & Insights
This section details the evolution of the Hong Kong e-commerce market size, adoption rates, and consumer behavior shifts using comprehensive data analysis. The market exhibited a CAGR of xx% during the historical period (2019-2024), and is projected to maintain a CAGR of xx% during the forecast period (2025-2033). Market penetration reached xx% in 2024 and is expected to surpass xx% by 2033. This growth is fueled by rising internet and smartphone penetration, increasing consumer trust in online platforms, and the convenience offered by e-commerce. The shift towards mobile commerce is a key trend, with a significant portion of online transactions now originating from mobile devices.
Dominant Regions, Countries, or Segments in Hong Kong E-commerce Industry
Hong Kong's e-commerce market is largely driven by the urban areas, with consumers in these regions exhibiting higher online shopping frequencies and average order values.
- Key Drivers: High internet and smartphone penetration, well-developed logistics infrastructure, and a strong mobile payment ecosystem contribute to this dominance. Government initiatives promoting digitalization and e-commerce further bolster growth in these regions.
- Market Share and Growth Potential: The urban areas hold the largest market share (xx% in 2025), with continued growth potential driven by increasing consumer spending and technological advancements.
Hong Kong E-commerce Industry Product Landscape
The Hong Kong e-commerce market offers a diverse range of products, catering to various consumer needs. From electronics and fashion to groceries and beauty products, the industry showcases continuous innovation in product offerings and delivery models. The adoption of personalized recommendations, virtual try-on tools, and improved product search functions enhances the shopping experience, while omnichannel strategies integrate online and offline retail for a seamless customer journey.
Key Drivers, Barriers & Challenges in Hong Kong E-commerce Industry
Key Drivers:
- Technological advancements: Mobile commerce, AI, and big data analytics enhance the customer experience and operational efficiency.
- Government support: Initiatives to promote digitalization and e-commerce create a favorable environment for industry growth.
- Changing consumer behavior: Increased preference for online shopping and convenience drives market expansion.
Challenges and Restraints:
- High logistics costs: The densely populated urban environment poses logistical challenges, impacting delivery efficiency and costs.
- Cybersecurity concerns: Growing concerns about data breaches and online fraud hinder consumer trust and adoption.
- Intense competition: A large number of players, including global giants and local businesses, creates intense competition, impacting profit margins.
Emerging Opportunities in Hong Kong E-commerce Industry
- Growth of social commerce: Leveraging social media platforms to drive sales and enhance customer engagement presents significant opportunities.
- Expansion into niche markets: Targeting specific consumer segments with tailored products and services unlocks untapped market potential.
- Cross-border e-commerce: Facilitating trade with mainland China and other international markets offers significant growth prospects.
Growth Accelerators in the Hong Kong E-commerce Industry Industry
Technological innovations in logistics, AI-powered personalization, and enhanced cybersecurity measures will significantly accelerate e-commerce growth in Hong Kong. Strategic partnerships between online retailers, logistics providers, and fintech companies are key to optimizing supply chains and creating seamless customer experiences. Expansion into new product categories and omnichannel strategies further contribute to industry growth.
Key Players Shaping the Hong Kong E-commerce Industry Market
- JD.com Inc
- PARKnSHOP (HK) Limited
- Carousell Group
- MUJI (Hong Kong) Co Ltd
- Price Guide Sdn Bhd
- Amazon.com Inc
- Alibaba Group
- Hong Kong TV Shopping Network Limited
- eBay Inc
- WeChat Pay Hong Kong Limited
Notable Milestones in Hong Kong E-commerce Industry Sector
- May 2022: YesAsia partnered with Geek+ to build a smart warehouse, enhancing logistics efficiency.
- April 2022: Sa Sa International launched on-demand delivery with Foodpanda, expanding access to beauty products.
In-Depth Hong Kong E-commerce Industry Market Outlook
The Hong Kong e-commerce industry is poised for continued robust growth, driven by technological advancements, evolving consumer preferences, and supportive government policies. Strategic partnerships, investments in logistics infrastructure, and expansion into new market segments will shape the industry's future. The focus on enhancing the customer experience through personalized recommendations, seamless payment options, and secure online transactions will be critical for sustained success. The market offers substantial opportunities for both established players and new entrants to capitalize on the growth potential.
Hong Kong E-commerce Industry Segmentation
-
1. B2C ecommerce
- 1.1. Market size (GMV) for the period of 2017-2027
-
1.2. Market Segmentation - by Application
- 1.2.1. Beauty and Personal Care
- 1.2.2. Consumer Electronics
- 1.2.3. Fashion and Apparel
- 1.2.4. Food and Beverage
- 1.2.5. Furniture and Home
- 1.2.6. Others (Toys, DIY, Media, etc.)
- 2. Market size (GMV) for the period of 2017-2027
-
3. Application
- 3.1. Beauty and Personal Care
- 3.2. Consumer Electronics
- 3.3. Fashion and Apparel
- 3.4. Food and Beverage
- 3.5. Furniture and Home
- 3.6. Others (Toys, DIY, Media, etc.)
- 4. Beauty and Personal Care
- 5. Consumer Electronics
- 6. Fashion and Apparel
- 7. Food and Beverage
- 8. Furniture and Home
- 9. Others (Toys, DIY, Media, etc.)
-
10. B2B ecommerce
- 10.1. Market size for the period of 2017-2027
Hong Kong E-commerce Industry Segmentation By Geography
-
1. North America
- 1.1. United States
- 1.2. Canada
- 1.3. Mexico
-
2. South America
- 2.1. Brazil
- 2.2. Argentina
- 2.3. Rest of South America
-
3. Europe
- 3.1. United Kingdom
- 3.2. Germany
- 3.3. France
- 3.4. Italy
- 3.5. Spain
- 3.6. Russia
- 3.7. Benelux
- 3.8. Nordics
- 3.9. Rest of Europe
-
4. Middle East & Africa
- 4.1. Turkey
- 4.2. Israel
- 4.3. GCC
- 4.4. North Africa
- 4.5. South Africa
- 4.6. Rest of Middle East & Africa
-
5. Asia Pacific
- 5.1. China
- 5.2. India
- 5.3. Japan
- 5.4. South Korea
- 5.5. ASEAN
- 5.6. Oceania
- 5.7. Rest of Asia Pacific
Hong Kong E-commerce Industry Regional Market Share
Geographic Coverage of Hong Kong E-commerce Industry
Hong Kong E-commerce Industry REPORT HIGHLIGHTS
| Aspects | Details |
|---|---|
| Study Period | 2020-2034 |
| Base Year | 2025 |
| Estimated Year | 2026 |
| Forecast Period | 2026-2034 |
| Historical Period | 2020-2025 |
| Growth Rate | CAGR of 7.87% from 2020-2034 |
| Segmentation |
|
Table of Contents
- 1. Introduction
- 1.1. Research Scope
- 1.2. Market Segmentation
- 1.3. Research Methodology
- 1.4. Definitions and Assumptions
- 2. Executive Summary
- 2.1. Introduction
- 3. Market Dynamics
- 3.1. Introduction
- 3.2. Market Drivers
- 3.2.1. Increase in adoption of digitalization; Adoption of Omnichannel Innovative Solutions
- 3.3. Market Restrains
- 3.3.1. High Initial Cost of Installation
- 3.4. Market Trends
- 3.4.1. Increase in Internet Penetration Across the Country is Fueling the Growth of the Market
- 4. Market Factor Analysis
- 4.1. Porters Five Forces
- 4.2. Supply/Value Chain
- 4.3. PESTEL analysis
- 4.4. Market Entropy
- 4.5. Patent/Trademark Analysis
- 5. Global Hong Kong E-commerce Industry Analysis, Insights and Forecast, 2020-2032
- 5.1. Market Analysis, Insights and Forecast - by B2C ecommerce
- 5.1.1. Market size (GMV) for the period of 2017-2027
- 5.1.2. Market Segmentation - by Application
- 5.1.2.1. Beauty and Personal Care
- 5.1.2.2. Consumer Electronics
- 5.1.2.3. Fashion and Apparel
- 5.1.2.4. Food and Beverage
- 5.1.2.5. Furniture and Home
- 5.1.2.6. Others (Toys, DIY, Media, etc.)
- 5.2. Market Analysis, Insights and Forecast - by Market size (GMV) for the period of 2017-2027
- 5.3. Market Analysis, Insights and Forecast - by Application
- 5.3.1. Beauty and Personal Care
- 5.3.2. Consumer Electronics
- 5.3.3. Fashion and Apparel
- 5.3.4. Food and Beverage
- 5.3.5. Furniture and Home
- 5.3.6. Others (Toys, DIY, Media, etc.)
- 5.4. Market Analysis, Insights and Forecast - by Beauty and Personal Care
- 5.5. Market Analysis, Insights and Forecast - by Consumer Electronics
- 5.6. Market Analysis, Insights and Forecast - by Fashion and Apparel
- 5.7. Market Analysis, Insights and Forecast - by Food and Beverage
- 5.8. Market Analysis, Insights and Forecast - by Furniture and Home
- 5.9. Market Analysis, Insights and Forecast - by Others (Toys, DIY, Media, etc.)
- 5.10. Market Analysis, Insights and Forecast - by B2B ecommerce
- 5.10.1. Market size for the period of 2017-2027
- 5.11. Market Analysis, Insights and Forecast - by Region
- 5.11.1. North America
- 5.11.2. South America
- 5.11.3. Europe
- 5.11.4. Middle East & Africa
- 5.11.5. Asia Pacific
- 5.1. Market Analysis, Insights and Forecast - by B2C ecommerce
- 6. North America Hong Kong E-commerce Industry Analysis, Insights and Forecast, 2020-2032
- 6.1. Market Analysis, Insights and Forecast - by B2C ecommerce
- 6.1.1. Market size (GMV) for the period of 2017-2027
- 6.1.2. Market Segmentation - by Application
- 6.1.2.1. Beauty and Personal Care
- 6.1.2.2. Consumer Electronics
- 6.1.2.3. Fashion and Apparel
- 6.1.2.4. Food and Beverage
- 6.1.2.5. Furniture and Home
- 6.1.2.6. Others (Toys, DIY, Media, etc.)
- 6.2. Market Analysis, Insights and Forecast - by Market size (GMV) for the period of 2017-2027
- 6.3. Market Analysis, Insights and Forecast - by Application
- 6.3.1. Beauty and Personal Care
- 6.3.2. Consumer Electronics
- 6.3.3. Fashion and Apparel
- 6.3.4. Food and Beverage
- 6.3.5. Furniture and Home
- 6.3.6. Others (Toys, DIY, Media, etc.)
- 6.4. Market Analysis, Insights and Forecast - by Beauty and Personal Care
- 6.5. Market Analysis, Insights and Forecast - by Consumer Electronics
- 6.6. Market Analysis, Insights and Forecast - by Fashion and Apparel
- 6.7. Market Analysis, Insights and Forecast - by Food and Beverage
- 6.8. Market Analysis, Insights and Forecast - by Furniture and Home
- 6.9. Market Analysis, Insights and Forecast - by Others (Toys, DIY, Media, etc.)
- 6.10. Market Analysis, Insights and Forecast - by B2B ecommerce
- 6.10.1. Market size for the period of 2017-2027
- 6.1. Market Analysis, Insights and Forecast - by B2C ecommerce
- 7. South America Hong Kong E-commerce Industry Analysis, Insights and Forecast, 2020-2032
- 7.1. Market Analysis, Insights and Forecast - by B2C ecommerce
- 7.1.1. Market size (GMV) for the period of 2017-2027
- 7.1.2. Market Segmentation - by Application
- 7.1.2.1. Beauty and Personal Care
- 7.1.2.2. Consumer Electronics
- 7.1.2.3. Fashion and Apparel
- 7.1.2.4. Food and Beverage
- 7.1.2.5. Furniture and Home
- 7.1.2.6. Others (Toys, DIY, Media, etc.)
- 7.2. Market Analysis, Insights and Forecast - by Market size (GMV) for the period of 2017-2027
- 7.3. Market Analysis, Insights and Forecast - by Application
- 7.3.1. Beauty and Personal Care
- 7.3.2. Consumer Electronics
- 7.3.3. Fashion and Apparel
- 7.3.4. Food and Beverage
- 7.3.5. Furniture and Home
- 7.3.6. Others (Toys, DIY, Media, etc.)
- 7.4. Market Analysis, Insights and Forecast - by Beauty and Personal Care
- 7.5. Market Analysis, Insights and Forecast - by Consumer Electronics
- 7.6. Market Analysis, Insights and Forecast - by Fashion and Apparel
- 7.7. Market Analysis, Insights and Forecast - by Food and Beverage
- 7.8. Market Analysis, Insights and Forecast - by Furniture and Home
- 7.9. Market Analysis, Insights and Forecast - by Others (Toys, DIY, Media, etc.)
- 7.10. Market Analysis, Insights and Forecast - by B2B ecommerce
- 7.10.1. Market size for the period of 2017-2027
- 7.1. Market Analysis, Insights and Forecast - by B2C ecommerce
- 8. Europe Hong Kong E-commerce Industry Analysis, Insights and Forecast, 2020-2032
- 8.1. Market Analysis, Insights and Forecast - by B2C ecommerce
- 8.1.1. Market size (GMV) for the period of 2017-2027
- 8.1.2. Market Segmentation - by Application
- 8.1.2.1. Beauty and Personal Care
- 8.1.2.2. Consumer Electronics
- 8.1.2.3. Fashion and Apparel
- 8.1.2.4. Food and Beverage
- 8.1.2.5. Furniture and Home
- 8.1.2.6. Others (Toys, DIY, Media, etc.)
- 8.2. Market Analysis, Insights and Forecast - by Market size (GMV) for the period of 2017-2027
- 8.3. Market Analysis, Insights and Forecast - by Application
- 8.3.1. Beauty and Personal Care
- 8.3.2. Consumer Electronics
- 8.3.3. Fashion and Apparel
- 8.3.4. Food and Beverage
- 8.3.5. Furniture and Home
- 8.3.6. Others (Toys, DIY, Media, etc.)
- 8.4. Market Analysis, Insights and Forecast - by Beauty and Personal Care
- 8.5. Market Analysis, Insights and Forecast - by Consumer Electronics
- 8.6. Market Analysis, Insights and Forecast - by Fashion and Apparel
- 8.7. Market Analysis, Insights and Forecast - by Food and Beverage
- 8.8. Market Analysis, Insights and Forecast - by Furniture and Home
- 8.9. Market Analysis, Insights and Forecast - by Others (Toys, DIY, Media, etc.)
- 8.10. Market Analysis, Insights and Forecast - by B2B ecommerce
- 8.10.1. Market size for the period of 2017-2027
- 8.1. Market Analysis, Insights and Forecast - by B2C ecommerce
- 9. Middle East & Africa Hong Kong E-commerce Industry Analysis, Insights and Forecast, 2020-2032
- 9.1. Market Analysis, Insights and Forecast - by B2C ecommerce
- 9.1.1. Market size (GMV) for the period of 2017-2027
- 9.1.2. Market Segmentation - by Application
- 9.1.2.1. Beauty and Personal Care
- 9.1.2.2. Consumer Electronics
- 9.1.2.3. Fashion and Apparel
- 9.1.2.4. Food and Beverage
- 9.1.2.5. Furniture and Home
- 9.1.2.6. Others (Toys, DIY, Media, etc.)
- 9.2. Market Analysis, Insights and Forecast - by Market size (GMV) for the period of 2017-2027
- 9.3. Market Analysis, Insights and Forecast - by Application
- 9.3.1. Beauty and Personal Care
- 9.3.2. Consumer Electronics
- 9.3.3. Fashion and Apparel
- 9.3.4. Food and Beverage
- 9.3.5. Furniture and Home
- 9.3.6. Others (Toys, DIY, Media, etc.)
- 9.4. Market Analysis, Insights and Forecast - by Beauty and Personal Care
- 9.5. Market Analysis, Insights and Forecast - by Consumer Electronics
- 9.6. Market Analysis, Insights and Forecast - by Fashion and Apparel
- 9.7. Market Analysis, Insights and Forecast - by Food and Beverage
- 9.8. Market Analysis, Insights and Forecast - by Furniture and Home
- 9.9. Market Analysis, Insights and Forecast - by Others (Toys, DIY, Media, etc.)
- 9.10. Market Analysis, Insights and Forecast - by B2B ecommerce
- 9.10.1. Market size for the period of 2017-2027
- 9.1. Market Analysis, Insights and Forecast - by B2C ecommerce
- 10. Asia Pacific Hong Kong E-commerce Industry Analysis, Insights and Forecast, 2020-2032
- 10.1. Market Analysis, Insights and Forecast - by B2C ecommerce
- 10.1.1. Market size (GMV) for the period of 2017-2027
- 10.1.2. Market Segmentation - by Application
- 10.1.2.1. Beauty and Personal Care
- 10.1.2.2. Consumer Electronics
- 10.1.2.3. Fashion and Apparel
- 10.1.2.4. Food and Beverage
- 10.1.2.5. Furniture and Home
- 10.1.2.6. Others (Toys, DIY, Media, etc.)
- 10.2. Market Analysis, Insights and Forecast - by Market size (GMV) for the period of 2017-2027
- 10.3. Market Analysis, Insights and Forecast - by Application
- 10.3.1. Beauty and Personal Care
- 10.3.2. Consumer Electronics
- 10.3.3. Fashion and Apparel
- 10.3.4. Food and Beverage
- 10.3.5. Furniture and Home
- 10.3.6. Others (Toys, DIY, Media, etc.)
- 10.4. Market Analysis, Insights and Forecast - by Beauty and Personal Care
- 10.5. Market Analysis, Insights and Forecast - by Consumer Electronics
- 10.6. Market Analysis, Insights and Forecast - by Fashion and Apparel
- 10.7. Market Analysis, Insights and Forecast - by Food and Beverage
- 10.8. Market Analysis, Insights and Forecast - by Furniture and Home
- 10.9. Market Analysis, Insights and Forecast - by Others (Toys, DIY, Media, etc.)
- 10.10. Market Analysis, Insights and Forecast - by B2B ecommerce
- 10.10.1. Market size for the period of 2017-2027
- 10.1. Market Analysis, Insights and Forecast - by B2C ecommerce
- 11. Competitive Analysis
- 11.1. Global Market Share Analysis 2025
- 11.2. Company Profiles
- 11.2.1 JD com Inc
- 11.2.1.1. Overview
- 11.2.1.2. Products
- 11.2.1.3. SWOT Analysis
- 11.2.1.4. Recent Developments
- 11.2.1.5. Financials (Based on Availability)
- 11.2.2 PARKnSHOP (HK) Limited
- 11.2.2.1. Overview
- 11.2.2.2. Products
- 11.2.2.3. SWOT Analysis
- 11.2.2.4. Recent Developments
- 11.2.2.5. Financials (Based on Availability)
- 11.2.3 Carousell Group*List Not Exhaustive
- 11.2.3.1. Overview
- 11.2.3.2. Products
- 11.2.3.3. SWOT Analysis
- 11.2.3.4. Recent Developments
- 11.2.3.5. Financials (Based on Availability)
- 11.2.4 MUJI (Hong Kong) Co Ltd
- 11.2.4.1. Overview
- 11.2.4.2. Products
- 11.2.4.3. SWOT Analysis
- 11.2.4.4. Recent Developments
- 11.2.4.5. Financials (Based on Availability)
- 11.2.5 Price Guide Sdn Bhd
- 11.2.5.1. Overview
- 11.2.5.2. Products
- 11.2.5.3. SWOT Analysis
- 11.2.5.4. Recent Developments
- 11.2.5.5. Financials (Based on Availability)
- 11.2.6 Amazon com Inc
- 11.2.6.1. Overview
- 11.2.6.2. Products
- 11.2.6.3. SWOT Analysis
- 11.2.6.4. Recent Developments
- 11.2.6.5. Financials (Based on Availability)
- 11.2.7 Alibaba Group
- 11.2.7.1. Overview
- 11.2.7.2. Products
- 11.2.7.3. SWOT Analysis
- 11.2.7.4. Recent Developments
- 11.2.7.5. Financials (Based on Availability)
- 11.2.8 Hong Kong TV Shopping Network Limited
- 11.2.8.1. Overview
- 11.2.8.2. Products
- 11.2.8.3. SWOT Analysis
- 11.2.8.4. Recent Developments
- 11.2.8.5. Financials (Based on Availability)
- 11.2.9 eBay Inc
- 11.2.9.1. Overview
- 11.2.9.2. Products
- 11.2.9.3. SWOT Analysis
- 11.2.9.4. Recent Developments
- 11.2.9.5. Financials (Based on Availability)
- 11.2.10 WeChat Pay Hong Kong Limited
- 11.2.10.1. Overview
- 11.2.10.2. Products
- 11.2.10.3. SWOT Analysis
- 11.2.10.4. Recent Developments
- 11.2.10.5. Financials (Based on Availability)
- 11.2.1 JD com Inc
List of Figures
- Figure 1: Global Hong Kong E-commerce Industry Revenue Breakdown (billion, %) by Region 2025 & 2033
- Figure 2: North America Hong Kong E-commerce Industry Revenue (billion), by B2C ecommerce 2025 & 2033
- Figure 3: North America Hong Kong E-commerce Industry Revenue Share (%), by B2C ecommerce 2025 & 2033
- Figure 4: North America Hong Kong E-commerce Industry Revenue (billion), by Market size (GMV) for the period of 2017-2027 2025 & 2033
- Figure 5: North America Hong Kong E-commerce Industry Revenue Share (%), by Market size (GMV) for the period of 2017-2027 2025 & 2033
- Figure 6: North America Hong Kong E-commerce Industry Revenue (billion), by Application 2025 & 2033
- Figure 7: North America Hong Kong E-commerce Industry Revenue Share (%), by Application 2025 & 2033
- Figure 8: North America Hong Kong E-commerce Industry Revenue (billion), by Beauty and Personal Care 2025 & 2033
- Figure 9: North America Hong Kong E-commerce Industry Revenue Share (%), by Beauty and Personal Care 2025 & 2033
- Figure 10: North America Hong Kong E-commerce Industry Revenue (billion), by Consumer Electronics 2025 & 2033
- Figure 11: North America Hong Kong E-commerce Industry Revenue Share (%), by Consumer Electronics 2025 & 2033
- Figure 12: North America Hong Kong E-commerce Industry Revenue (billion), by Fashion and Apparel 2025 & 2033
- Figure 13: North America Hong Kong E-commerce Industry Revenue Share (%), by Fashion and Apparel 2025 & 2033
- Figure 14: North America Hong Kong E-commerce Industry Revenue (billion), by Food and Beverage 2025 & 2033
- Figure 15: North America Hong Kong E-commerce Industry Revenue Share (%), by Food and Beverage 2025 & 2033
- Figure 16: North America Hong Kong E-commerce Industry Revenue (billion), by Furniture and Home 2025 & 2033
- Figure 17: North America Hong Kong E-commerce Industry Revenue Share (%), by Furniture and Home 2025 & 2033
- Figure 18: North America Hong Kong E-commerce Industry Revenue (billion), by Others (Toys, DIY, Media, etc.) 2025 & 2033
- Figure 19: North America Hong Kong E-commerce Industry Revenue Share (%), by Others (Toys, DIY, Media, etc.) 2025 & 2033
- Figure 20: North America Hong Kong E-commerce Industry Revenue (billion), by B2B ecommerce 2025 & 2033
- Figure 21: North America Hong Kong E-commerce Industry Revenue Share (%), by B2B ecommerce 2025 & 2033
- Figure 22: North America Hong Kong E-commerce Industry Revenue (billion), by Country 2025 & 2033
- Figure 23: North America Hong Kong E-commerce Industry Revenue Share (%), by Country 2025 & 2033
- Figure 24: South America Hong Kong E-commerce Industry Revenue (billion), by B2C ecommerce 2025 & 2033
- Figure 25: South America Hong Kong E-commerce Industry Revenue Share (%), by B2C ecommerce 2025 & 2033
- Figure 26: South America Hong Kong E-commerce Industry Revenue (billion), by Market size (GMV) for the period of 2017-2027 2025 & 2033
- Figure 27: South America Hong Kong E-commerce Industry Revenue Share (%), by Market size (GMV) for the period of 2017-2027 2025 & 2033
- Figure 28: South America Hong Kong E-commerce Industry Revenue (billion), by Application 2025 & 2033
- Figure 29: South America Hong Kong E-commerce Industry Revenue Share (%), by Application 2025 & 2033
- Figure 30: South America Hong Kong E-commerce Industry Revenue (billion), by Beauty and Personal Care 2025 & 2033
- Figure 31: South America Hong Kong E-commerce Industry Revenue Share (%), by Beauty and Personal Care 2025 & 2033
- Figure 32: South America Hong Kong E-commerce Industry Revenue (billion), by Consumer Electronics 2025 & 2033
- Figure 33: South America Hong Kong E-commerce Industry Revenue Share (%), by Consumer Electronics 2025 & 2033
- Figure 34: South America Hong Kong E-commerce Industry Revenue (billion), by Fashion and Apparel 2025 & 2033
- Figure 35: South America Hong Kong E-commerce Industry Revenue Share (%), by Fashion and Apparel 2025 & 2033
- Figure 36: South America Hong Kong E-commerce Industry Revenue (billion), by Food and Beverage 2025 & 2033
- Figure 37: South America Hong Kong E-commerce Industry Revenue Share (%), by Food and Beverage 2025 & 2033
- Figure 38: South America Hong Kong E-commerce Industry Revenue (billion), by Furniture and Home 2025 & 2033
- Figure 39: South America Hong Kong E-commerce Industry Revenue Share (%), by Furniture and Home 2025 & 2033
- Figure 40: South America Hong Kong E-commerce Industry Revenue (billion), by Others (Toys, DIY, Media, etc.) 2025 & 2033
- Figure 41: South America Hong Kong E-commerce Industry Revenue Share (%), by Others (Toys, DIY, Media, etc.) 2025 & 2033
- Figure 42: South America Hong Kong E-commerce Industry Revenue (billion), by B2B ecommerce 2025 & 2033
- Figure 43: South America Hong Kong E-commerce Industry Revenue Share (%), by B2B ecommerce 2025 & 2033
- Figure 44: South America Hong Kong E-commerce Industry Revenue (billion), by Country 2025 & 2033
- Figure 45: South America Hong Kong E-commerce Industry Revenue Share (%), by Country 2025 & 2033
- Figure 46: Europe Hong Kong E-commerce Industry Revenue (billion), by B2C ecommerce 2025 & 2033
- Figure 47: Europe Hong Kong E-commerce Industry Revenue Share (%), by B2C ecommerce 2025 & 2033
- Figure 48: Europe Hong Kong E-commerce Industry Revenue (billion), by Market size (GMV) for the period of 2017-2027 2025 & 2033
- Figure 49: Europe Hong Kong E-commerce Industry Revenue Share (%), by Market size (GMV) for the period of 2017-2027 2025 & 2033
- Figure 50: Europe Hong Kong E-commerce Industry Revenue (billion), by Application 2025 & 2033
- Figure 51: Europe Hong Kong E-commerce Industry Revenue Share (%), by Application 2025 & 2033
- Figure 52: Europe Hong Kong E-commerce Industry Revenue (billion), by Beauty and Personal Care 2025 & 2033
- Figure 53: Europe Hong Kong E-commerce Industry Revenue Share (%), by Beauty and Personal Care 2025 & 2033
- Figure 54: Europe Hong Kong E-commerce Industry Revenue (billion), by Consumer Electronics 2025 & 2033
- Figure 55: Europe Hong Kong E-commerce Industry Revenue Share (%), by Consumer Electronics 2025 & 2033
- Figure 56: Europe Hong Kong E-commerce Industry Revenue (billion), by Fashion and Apparel 2025 & 2033
- Figure 57: Europe Hong Kong E-commerce Industry Revenue Share (%), by Fashion and Apparel 2025 & 2033
- Figure 58: Europe Hong Kong E-commerce Industry Revenue (billion), by Food and Beverage 2025 & 2033
- Figure 59: Europe Hong Kong E-commerce Industry Revenue Share (%), by Food and Beverage 2025 & 2033
- Figure 60: Europe Hong Kong E-commerce Industry Revenue (billion), by Furniture and Home 2025 & 2033
- Figure 61: Europe Hong Kong E-commerce Industry Revenue Share (%), by Furniture and Home 2025 & 2033
- Figure 62: Europe Hong Kong E-commerce Industry Revenue (billion), by Others (Toys, DIY, Media, etc.) 2025 & 2033
- Figure 63: Europe Hong Kong E-commerce Industry Revenue Share (%), by Others (Toys, DIY, Media, etc.) 2025 & 2033
- Figure 64: Europe Hong Kong E-commerce Industry Revenue (billion), by B2B ecommerce 2025 & 2033
- Figure 65: Europe Hong Kong E-commerce Industry Revenue Share (%), by B2B ecommerce 2025 & 2033
- Figure 66: Europe Hong Kong E-commerce Industry Revenue (billion), by Country 2025 & 2033
- Figure 67: Europe Hong Kong E-commerce Industry Revenue Share (%), by Country 2025 & 2033
- Figure 68: Middle East & Africa Hong Kong E-commerce Industry Revenue (billion), by B2C ecommerce 2025 & 2033
- Figure 69: Middle East & Africa Hong Kong E-commerce Industry Revenue Share (%), by B2C ecommerce 2025 & 2033
- Figure 70: Middle East & Africa Hong Kong E-commerce Industry Revenue (billion), by Market size (GMV) for the period of 2017-2027 2025 & 2033
- Figure 71: Middle East & Africa Hong Kong E-commerce Industry Revenue Share (%), by Market size (GMV) for the period of 2017-2027 2025 & 2033
- Figure 72: Middle East & Africa Hong Kong E-commerce Industry Revenue (billion), by Application 2025 & 2033
- Figure 73: Middle East & Africa Hong Kong E-commerce Industry Revenue Share (%), by Application 2025 & 2033
- Figure 74: Middle East & Africa Hong Kong E-commerce Industry Revenue (billion), by Beauty and Personal Care 2025 & 2033
- Figure 75: Middle East & Africa Hong Kong E-commerce Industry Revenue Share (%), by Beauty and Personal Care 2025 & 2033
- Figure 76: Middle East & Africa Hong Kong E-commerce Industry Revenue (billion), by Consumer Electronics 2025 & 2033
- Figure 77: Middle East & Africa Hong Kong E-commerce Industry Revenue Share (%), by Consumer Electronics 2025 & 2033
- Figure 78: Middle East & Africa Hong Kong E-commerce Industry Revenue (billion), by Fashion and Apparel 2025 & 2033
- Figure 79: Middle East & Africa Hong Kong E-commerce Industry Revenue Share (%), by Fashion and Apparel 2025 & 2033
- Figure 80: Middle East & Africa Hong Kong E-commerce Industry Revenue (billion), by Food and Beverage 2025 & 2033
- Figure 81: Middle East & Africa Hong Kong E-commerce Industry Revenue Share (%), by Food and Beverage 2025 & 2033
- Figure 82: Middle East & Africa Hong Kong E-commerce Industry Revenue (billion), by Furniture and Home 2025 & 2033
- Figure 83: Middle East & Africa Hong Kong E-commerce Industry Revenue Share (%), by Furniture and Home 2025 & 2033
- Figure 84: Middle East & Africa Hong Kong E-commerce Industry Revenue (billion), by Others (Toys, DIY, Media, etc.) 2025 & 2033
- Figure 85: Middle East & Africa Hong Kong E-commerce Industry Revenue Share (%), by Others (Toys, DIY, Media, etc.) 2025 & 2033
- Figure 86: Middle East & Africa Hong Kong E-commerce Industry Revenue (billion), by B2B ecommerce 2025 & 2033
- Figure 87: Middle East & Africa Hong Kong E-commerce Industry Revenue Share (%), by B2B ecommerce 2025 & 2033
- Figure 88: Middle East & Africa Hong Kong E-commerce Industry Revenue (billion), by Country 2025 & 2033
- Figure 89: Middle East & Africa Hong Kong E-commerce Industry Revenue Share (%), by Country 2025 & 2033
- Figure 90: Asia Pacific Hong Kong E-commerce Industry Revenue (billion), by B2C ecommerce 2025 & 2033
- Figure 91: Asia Pacific Hong Kong E-commerce Industry Revenue Share (%), by B2C ecommerce 2025 & 2033
- Figure 92: Asia Pacific Hong Kong E-commerce Industry Revenue (billion), by Market size (GMV) for the period of 2017-2027 2025 & 2033
- Figure 93: Asia Pacific Hong Kong E-commerce Industry Revenue Share (%), by Market size (GMV) for the period of 2017-2027 2025 & 2033
- Figure 94: Asia Pacific Hong Kong E-commerce Industry Revenue (billion), by Application 2025 & 2033
- Figure 95: Asia Pacific Hong Kong E-commerce Industry Revenue Share (%), by Application 2025 & 2033
- Figure 96: Asia Pacific Hong Kong E-commerce Industry Revenue (billion), by Beauty and Personal Care 2025 & 2033
- Figure 97: Asia Pacific Hong Kong E-commerce Industry Revenue Share (%), by Beauty and Personal Care 2025 & 2033
- Figure 98: Asia Pacific Hong Kong E-commerce Industry Revenue (billion), by Consumer Electronics 2025 & 2033
- Figure 99: Asia Pacific Hong Kong E-commerce Industry Revenue Share (%), by Consumer Electronics 2025 & 2033
- Figure 100: Asia Pacific Hong Kong E-commerce Industry Revenue (billion), by Fashion and Apparel 2025 & 2033
- Figure 101: Asia Pacific Hong Kong E-commerce Industry Revenue Share (%), by Fashion and Apparel 2025 & 2033
- Figure 102: Asia Pacific Hong Kong E-commerce Industry Revenue (billion), by Food and Beverage 2025 & 2033
- Figure 103: Asia Pacific Hong Kong E-commerce Industry Revenue Share (%), by Food and Beverage 2025 & 2033
- Figure 104: Asia Pacific Hong Kong E-commerce Industry Revenue (billion), by Furniture and Home 2025 & 2033
- Figure 105: Asia Pacific Hong Kong E-commerce Industry Revenue Share (%), by Furniture and Home 2025 & 2033
- Figure 106: Asia Pacific Hong Kong E-commerce Industry Revenue (billion), by Others (Toys, DIY, Media, etc.) 2025 & 2033
- Figure 107: Asia Pacific Hong Kong E-commerce Industry Revenue Share (%), by Others (Toys, DIY, Media, etc.) 2025 & 2033
- Figure 108: Asia Pacific Hong Kong E-commerce Industry Revenue (billion), by B2B ecommerce 2025 & 2033
- Figure 109: Asia Pacific Hong Kong E-commerce Industry Revenue Share (%), by B2B ecommerce 2025 & 2033
- Figure 110: Asia Pacific Hong Kong E-commerce Industry Revenue (billion), by Country 2025 & 2033
- Figure 111: Asia Pacific Hong Kong E-commerce Industry Revenue Share (%), by Country 2025 & 2033
List of Tables
- Table 1: Global Hong Kong E-commerce Industry Revenue billion Forecast, by B2C ecommerce 2020 & 2033
- Table 2: Global Hong Kong E-commerce Industry Revenue billion Forecast, by Market size (GMV) for the period of 2017-2027 2020 & 2033
- Table 3: Global Hong Kong E-commerce Industry Revenue billion Forecast, by Application 2020 & 2033
- Table 4: Global Hong Kong E-commerce Industry Revenue billion Forecast, by Beauty and Personal Care 2020 & 2033
- Table 5: Global Hong Kong E-commerce Industry Revenue billion Forecast, by Consumer Electronics 2020 & 2033
- Table 6: Global Hong Kong E-commerce Industry Revenue billion Forecast, by Fashion and Apparel 2020 & 2033
- Table 7: Global Hong Kong E-commerce Industry Revenue billion Forecast, by Food and Beverage 2020 & 2033
- Table 8: Global Hong Kong E-commerce Industry Revenue billion Forecast, by Furniture and Home 2020 & 2033
- Table 9: Global Hong Kong E-commerce Industry Revenue billion Forecast, by Others (Toys, DIY, Media, etc.) 2020 & 2033
- Table 10: Global Hong Kong E-commerce Industry Revenue billion Forecast, by B2B ecommerce 2020 & 2033
- Table 11: Global Hong Kong E-commerce Industry Revenue billion Forecast, by Region 2020 & 2033
- Table 12: Global Hong Kong E-commerce Industry Revenue billion Forecast, by B2C ecommerce 2020 & 2033
- Table 13: Global Hong Kong E-commerce Industry Revenue billion Forecast, by Market size (GMV) for the period of 2017-2027 2020 & 2033
- Table 14: Global Hong Kong E-commerce Industry Revenue billion Forecast, by Application 2020 & 2033
- Table 15: Global Hong Kong E-commerce Industry Revenue billion Forecast, by Beauty and Personal Care 2020 & 2033
- Table 16: Global Hong Kong E-commerce Industry Revenue billion Forecast, by Consumer Electronics 2020 & 2033
- Table 17: Global Hong Kong E-commerce Industry Revenue billion Forecast, by Fashion and Apparel 2020 & 2033
- Table 18: Global Hong Kong E-commerce Industry Revenue billion Forecast, by Food and Beverage 2020 & 2033
- Table 19: Global Hong Kong E-commerce Industry Revenue billion Forecast, by Furniture and Home 2020 & 2033
- Table 20: Global Hong Kong E-commerce Industry Revenue billion Forecast, by Others (Toys, DIY, Media, etc.) 2020 & 2033
- Table 21: Global Hong Kong E-commerce Industry Revenue billion Forecast, by B2B ecommerce 2020 & 2033
- Table 22: Global Hong Kong E-commerce Industry Revenue billion Forecast, by Country 2020 & 2033
- Table 23: United States Hong Kong E-commerce Industry Revenue (billion) Forecast, by Application 2020 & 2033
- Table 24: Canada Hong Kong E-commerce Industry Revenue (billion) Forecast, by Application 2020 & 2033
- Table 25: Mexico Hong Kong E-commerce Industry Revenue (billion) Forecast, by Application 2020 & 2033
- Table 26: Global Hong Kong E-commerce Industry Revenue billion Forecast, by B2C ecommerce 2020 & 2033
- Table 27: Global Hong Kong E-commerce Industry Revenue billion Forecast, by Market size (GMV) for the period of 2017-2027 2020 & 2033
- Table 28: Global Hong Kong E-commerce Industry Revenue billion Forecast, by Application 2020 & 2033
- Table 29: Global Hong Kong E-commerce Industry Revenue billion Forecast, by Beauty and Personal Care 2020 & 2033
- Table 30: Global Hong Kong E-commerce Industry Revenue billion Forecast, by Consumer Electronics 2020 & 2033
- Table 31: Global Hong Kong E-commerce Industry Revenue billion Forecast, by Fashion and Apparel 2020 & 2033
- Table 32: Global Hong Kong E-commerce Industry Revenue billion Forecast, by Food and Beverage 2020 & 2033
- Table 33: Global Hong Kong E-commerce Industry Revenue billion Forecast, by Furniture and Home 2020 & 2033
- Table 34: Global Hong Kong E-commerce Industry Revenue billion Forecast, by Others (Toys, DIY, Media, etc.) 2020 & 2033
- Table 35: Global Hong Kong E-commerce Industry Revenue billion Forecast, by B2B ecommerce 2020 & 2033
- Table 36: Global Hong Kong E-commerce Industry Revenue billion Forecast, by Country 2020 & 2033
- Table 37: Brazil Hong Kong E-commerce Industry Revenue (billion) Forecast, by Application 2020 & 2033
- Table 38: Argentina Hong Kong E-commerce Industry Revenue (billion) Forecast, by Application 2020 & 2033
- Table 39: Rest of South America Hong Kong E-commerce Industry Revenue (billion) Forecast, by Application 2020 & 2033
- Table 40: Global Hong Kong E-commerce Industry Revenue billion Forecast, by B2C ecommerce 2020 & 2033
- Table 41: Global Hong Kong E-commerce Industry Revenue billion Forecast, by Market size (GMV) for the period of 2017-2027 2020 & 2033
- Table 42: Global Hong Kong E-commerce Industry Revenue billion Forecast, by Application 2020 & 2033
- Table 43: Global Hong Kong E-commerce Industry Revenue billion Forecast, by Beauty and Personal Care 2020 & 2033
- Table 44: Global Hong Kong E-commerce Industry Revenue billion Forecast, by Consumer Electronics 2020 & 2033
- Table 45: Global Hong Kong E-commerce Industry Revenue billion Forecast, by Fashion and Apparel 2020 & 2033
- Table 46: Global Hong Kong E-commerce Industry Revenue billion Forecast, by Food and Beverage 2020 & 2033
- Table 47: Global Hong Kong E-commerce Industry Revenue billion Forecast, by Furniture and Home 2020 & 2033
- Table 48: Global Hong Kong E-commerce Industry Revenue billion Forecast, by Others (Toys, DIY, Media, etc.) 2020 & 2033
- Table 49: Global Hong Kong E-commerce Industry Revenue billion Forecast, by B2B ecommerce 2020 & 2033
- Table 50: Global Hong Kong E-commerce Industry Revenue billion Forecast, by Country 2020 & 2033
- Table 51: United Kingdom Hong Kong E-commerce Industry Revenue (billion) Forecast, by Application 2020 & 2033
- Table 52: Germany Hong Kong E-commerce Industry Revenue (billion) Forecast, by Application 2020 & 2033
- Table 53: France Hong Kong E-commerce Industry Revenue (billion) Forecast, by Application 2020 & 2033
- Table 54: Italy Hong Kong E-commerce Industry Revenue (billion) Forecast, by Application 2020 & 2033
- Table 55: Spain Hong Kong E-commerce Industry Revenue (billion) Forecast, by Application 2020 & 2033
- Table 56: Russia Hong Kong E-commerce Industry Revenue (billion) Forecast, by Application 2020 & 2033
- Table 57: Benelux Hong Kong E-commerce Industry Revenue (billion) Forecast, by Application 2020 & 2033
- Table 58: Nordics Hong Kong E-commerce Industry Revenue (billion) Forecast, by Application 2020 & 2033
- Table 59: Rest of Europe Hong Kong E-commerce Industry Revenue (billion) Forecast, by Application 2020 & 2033
- Table 60: Global Hong Kong E-commerce Industry Revenue billion Forecast, by B2C ecommerce 2020 & 2033
- Table 61: Global Hong Kong E-commerce Industry Revenue billion Forecast, by Market size (GMV) for the period of 2017-2027 2020 & 2033
- Table 62: Global Hong Kong E-commerce Industry Revenue billion Forecast, by Application 2020 & 2033
- Table 63: Global Hong Kong E-commerce Industry Revenue billion Forecast, by Beauty and Personal Care 2020 & 2033
- Table 64: Global Hong Kong E-commerce Industry Revenue billion Forecast, by Consumer Electronics 2020 & 2033
- Table 65: Global Hong Kong E-commerce Industry Revenue billion Forecast, by Fashion and Apparel 2020 & 2033
- Table 66: Global Hong Kong E-commerce Industry Revenue billion Forecast, by Food and Beverage 2020 & 2033
- Table 67: Global Hong Kong E-commerce Industry Revenue billion Forecast, by Furniture and Home 2020 & 2033
- Table 68: Global Hong Kong E-commerce Industry Revenue billion Forecast, by Others (Toys, DIY, Media, etc.) 2020 & 2033
- Table 69: Global Hong Kong E-commerce Industry Revenue billion Forecast, by B2B ecommerce 2020 & 2033
- Table 70: Global Hong Kong E-commerce Industry Revenue billion Forecast, by Country 2020 & 2033
- Table 71: Turkey Hong Kong E-commerce Industry Revenue (billion) Forecast, by Application 2020 & 2033
- Table 72: Israel Hong Kong E-commerce Industry Revenue (billion) Forecast, by Application 2020 & 2033
- Table 73: GCC Hong Kong E-commerce Industry Revenue (billion) Forecast, by Application 2020 & 2033
- Table 74: North Africa Hong Kong E-commerce Industry Revenue (billion) Forecast, by Application 2020 & 2033
- Table 75: South Africa Hong Kong E-commerce Industry Revenue (billion) Forecast, by Application 2020 & 2033
- Table 76: Rest of Middle East & Africa Hong Kong E-commerce Industry Revenue (billion) Forecast, by Application 2020 & 2033
- Table 77: Global Hong Kong E-commerce Industry Revenue billion Forecast, by B2C ecommerce 2020 & 2033
- Table 78: Global Hong Kong E-commerce Industry Revenue billion Forecast, by Market size (GMV) for the period of 2017-2027 2020 & 2033
- Table 79: Global Hong Kong E-commerce Industry Revenue billion Forecast, by Application 2020 & 2033
- Table 80: Global Hong Kong E-commerce Industry Revenue billion Forecast, by Beauty and Personal Care 2020 & 2033
- Table 81: Global Hong Kong E-commerce Industry Revenue billion Forecast, by Consumer Electronics 2020 & 2033
- Table 82: Global Hong Kong E-commerce Industry Revenue billion Forecast, by Fashion and Apparel 2020 & 2033
- Table 83: Global Hong Kong E-commerce Industry Revenue billion Forecast, by Food and Beverage 2020 & 2033
- Table 84: Global Hong Kong E-commerce Industry Revenue billion Forecast, by Furniture and Home 2020 & 2033
- Table 85: Global Hong Kong E-commerce Industry Revenue billion Forecast, by Others (Toys, DIY, Media, etc.) 2020 & 2033
- Table 86: Global Hong Kong E-commerce Industry Revenue billion Forecast, by B2B ecommerce 2020 & 2033
- Table 87: Global Hong Kong E-commerce Industry Revenue billion Forecast, by Country 2020 & 2033
- Table 88: China Hong Kong E-commerce Industry Revenue (billion) Forecast, by Application 2020 & 2033
- Table 89: India Hong Kong E-commerce Industry Revenue (billion) Forecast, by Application 2020 & 2033
- Table 90: Japan Hong Kong E-commerce Industry Revenue (billion) Forecast, by Application 2020 & 2033
- Table 91: South Korea Hong Kong E-commerce Industry Revenue (billion) Forecast, by Application 2020 & 2033
- Table 92: ASEAN Hong Kong E-commerce Industry Revenue (billion) Forecast, by Application 2020 & 2033
- Table 93: Oceania Hong Kong E-commerce Industry Revenue (billion) Forecast, by Application 2020 & 2033
- Table 94: Rest of Asia Pacific Hong Kong E-commerce Industry Revenue (billion) Forecast, by Application 2020 & 2033
Frequently Asked Questions
1. What is the projected Compound Annual Growth Rate (CAGR) of the Hong Kong E-commerce Industry?
The projected CAGR is approximately 7.87%.
2. Which companies are prominent players in the Hong Kong E-commerce Industry?
Key companies in the market include JD com Inc, PARKnSHOP (HK) Limited, Carousell Group*List Not Exhaustive, MUJI (Hong Kong) Co Ltd, Price Guide Sdn Bhd, Amazon com Inc, Alibaba Group, Hong Kong TV Shopping Network Limited, eBay Inc, WeChat Pay Hong Kong Limited.
3. What are the main segments of the Hong Kong E-commerce Industry?
The market segments include B2C ecommerce, Market size (GMV) for the period of 2017-2027, Application, Beauty and Personal Care, Consumer Electronics, Fashion and Apparel, Food and Beverage, Furniture and Home, Others (Toys, DIY, Media, etc.), B2B ecommerce.
4. Can you provide details about the market size?
The market size is estimated to be USD 5.34 billion as of 2022.
5. What are some drivers contributing to market growth?
Increase in adoption of digitalization; Adoption of Omnichannel Innovative Solutions.
6. What are the notable trends driving market growth?
Increase in Internet Penetration Across the Country is Fueling the Growth of the Market.
7. Are there any restraints impacting market growth?
High Initial Cost of Installation.
8. Can you provide examples of recent developments in the market?
May 2022 - YesAsia, a global online retailer, announced a partnership with Geek+, an autonomous robots company, to build YesAsia's first smart warehouse at Goodman Interlink, located in Tsing Yi, Hong Kong.
9. What pricing options are available for accessing the report?
Pricing options include single-user, multi-user, and enterprise licenses priced at USD 3800, USD 4500, and USD 5800 respectively.
10. Is the market size provided in terms of value or volume?
The market size is provided in terms of value, measured in billion.
11. Are there any specific market keywords associated with the report?
Yes, the market keyword associated with the report is "Hong Kong E-commerce Industry," which aids in identifying and referencing the specific market segment covered.
12. How do I determine which pricing option suits my needs best?
The pricing options vary based on user requirements and access needs. Individual users may opt for single-user licenses, while businesses requiring broader access may choose multi-user or enterprise licenses for cost-effective access to the report.
13. Are there any additional resources or data provided in the Hong Kong E-commerce Industry report?
While the report offers comprehensive insights, it's advisable to review the specific contents or supplementary materials provided to ascertain if additional resources or data are available.
14. How can I stay updated on further developments or reports in the Hong Kong E-commerce Industry?
To stay informed about further developments, trends, and reports in the Hong Kong E-commerce Industry, consider subscribing to industry newsletters, following relevant companies and organizations, or regularly checking reputable industry news sources and publications.
Methodology
Step 1 - Identification of Relevant Samples Size from Population Database


Step 2 - Approaches for Defining Global Market Size (Value, Volume* & Price*)

Note*: In applicable scenarios
Step 3 - Data Sources
Primary Research
- Web Analytics
- Survey Reports
- Research Institute
- Latest Research Reports
- Opinion Leaders
Secondary Research
- Annual Reports
- White Paper
- Latest Press Release
- Industry Association
- Paid Database
- Investor Presentations

Step 4 - Data Triangulation
Involves using different sources of information in order to increase the validity of a study
These sources are likely to be stakeholders in a program - participants, other researchers, program staff, other community members, and so on.
Then we put all data in single framework & apply various statistical tools to find out the dynamic on the market.
During the analysis stage, feedback from the stakeholder groups would be compared to determine areas of agreement as well as areas of divergence