

Key Insights
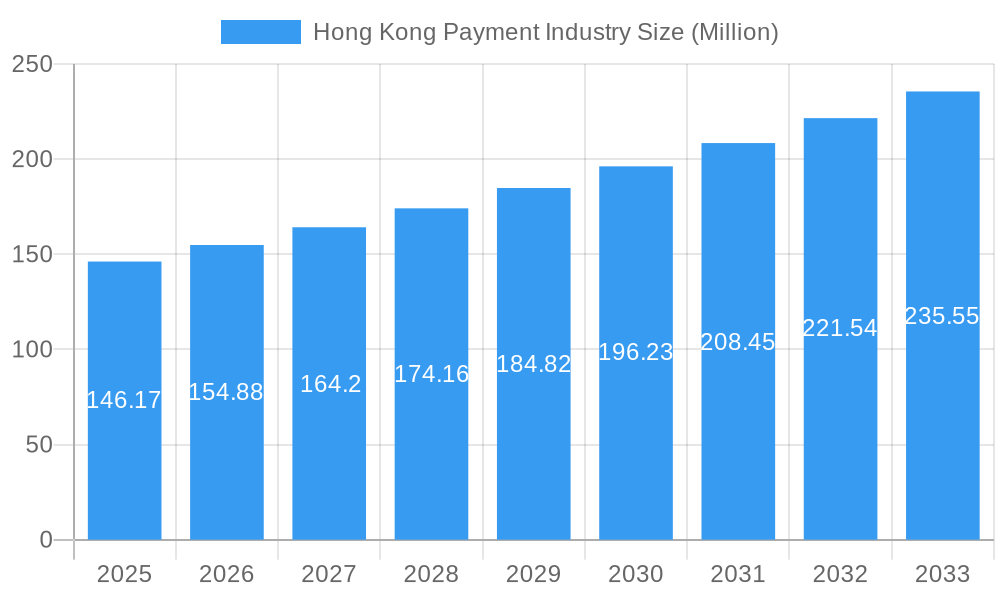
The Hong Kong payment industry, valued at $146.17 million in 2025, is projected to experience robust growth, driven by increasing digital adoption, expanding e-commerce, and the rising popularity of contactless payments. A Compound Annual Growth Rate (CAGR) of 5.66% from 2025 to 2033 indicates a significant expansion in market size, exceeding $230 million by 2033. Key growth drivers include the government's initiatives promoting digital financial inclusion, the widespread use of smartphones, and a burgeoning tourism sector fueling transaction volumes. The market is segmented by payment mode (point-of-sale, online) and end-user industry (retail, entertainment, healthcare, hospitality). While the dominance of established players like Visa, Mastercard, and American Express remains strong, the rise of fintech companies and mobile payment platforms presents both opportunities and competitive pressures. The increasing prevalence of mobile wallets and Buy Now Pay Later (BNPL) services are shaping consumer behavior and influencing the payment landscape. Regulatory changes and cybersecurity concerns present potential restraints to growth, however, the overall outlook for the Hong Kong payment industry remains positive.
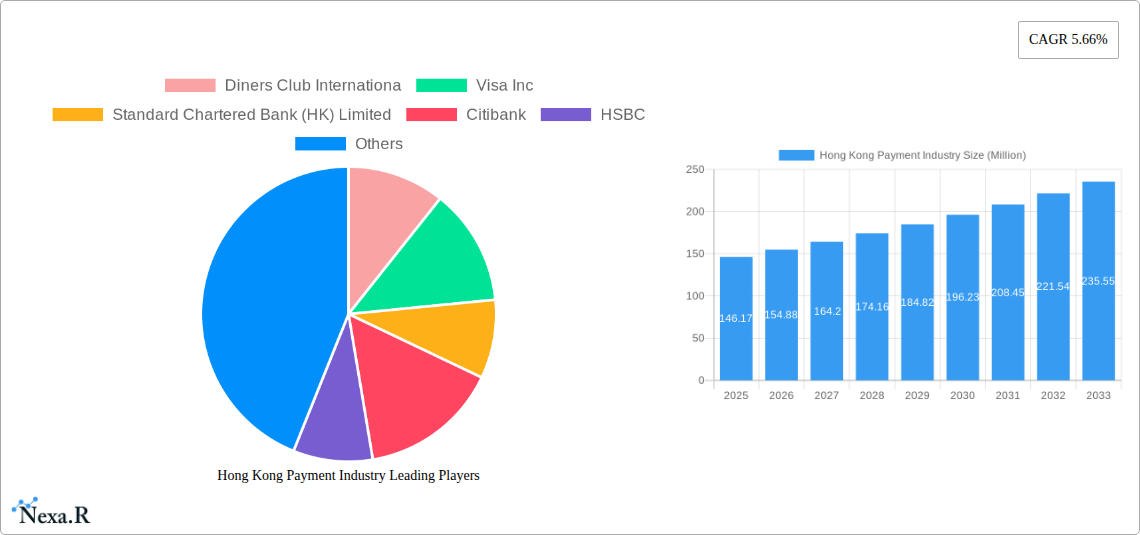
Hong Kong Payment Industry Market Size (In Million)
The competitive landscape features a mix of international giants and local banks, all vying for market share. The strong regulatory framework ensures stability and consumer protection. However, maintaining the balance between innovation and regulation will be crucial for sustaining the projected growth. Future growth will likely be fueled by further advancements in contactless payment technologies, the integration of blockchain and cryptocurrency, and the adoption of open banking initiatives. This dynamic environment demands continuous adaptation and innovation from all stakeholders in the Hong Kong payment ecosystem to remain competitive and meet evolving customer expectations.
Hong Kong Payment Industry Company Market Share
Hong Kong Payment Industry Market Report: 2019-2033
This comprehensive report provides an in-depth analysis of the Hong Kong payment industry, covering market dynamics, growth trends, key players, and future outlook from 2019 to 2033. The report leverages rigorous data analysis and expert insights to offer actionable intelligence for industry professionals, investors, and strategic decision-makers. This report segments the market by mode of payment (Point of Sale, Online Sale, Other Point of Sales) and end-user industry (Retail, Entertainment, Healthcare, Hospitality, Other End-user Industries), providing a granular understanding of the evolving landscape. The base year is 2025, with estimates for 2025 and forecasts extending to 2033. The historical period covered is 2019-2024.
Hong Kong Payment Industry Market Dynamics & Structure
This section analyzes the competitive landscape, technological advancements, regulatory environment, and market trends shaping the Hong Kong payment industry. The market is characterized by a high level of competition among established players and fintech disruptors. The analysis incorporates quantitative data, such as market share percentages and M&A activity volume (xx Million deals in the historical period), alongside qualitative factors like innovation barriers and regulatory hurdles.
- Market Concentration: The market is moderately concentrated, with key players such as Visa, Mastercard, and local banks holding significant shares. However, the emergence of fintech companies is increasing competition. Visa and Mastercard hold a combined market share of approximately xx%.
- Technological Innovation: Rapid adoption of mobile payments, contactless technology, and digital wallets is driving innovation. However, challenges remain in achieving widespread adoption of certain technologies, particularly among older demographics.
- Regulatory Framework: The Hong Kong Monetary Authority (HKMA) plays a crucial role in regulating the payment industry, ensuring stability and consumer protection. Recent regulatory changes have focused on promoting innovation while mitigating risks.
- Competitive Product Substitutes: The emergence of alternative payment methods, such as virtual currencies and Buy Now Pay Later (BNPL) services, presents both opportunities and threats to traditional payment providers.
- End-User Demographics: Hong Kong’s tech-savvy population fuels the adoption of digital payment methods. However, a segment of the population still relies on traditional methods, creating opportunities for inclusive payment solutions.
- M&A Trends: The historical period witnessed xx Million in M&A activity, primarily driven by strategic acquisitions by larger players to expand their market reach and product offerings.
Hong Kong Payment Industry Growth Trends & Insights
This section provides a comprehensive analysis of the market size evolution, adoption rates, technological disruptions, and consumer behavior shifts, using data and insights to project future trends. The Hong Kong payment market experienced strong growth during the historical period (2019-2024), with a Compound Annual Growth Rate (CAGR) of xx%. This growth is expected to continue during the forecast period (2025-2033), driven by factors like increasing smartphone penetration, rising e-commerce activity, and government initiatives promoting digital financial inclusion. Market penetration for digital payment methods is projected to reach xx% by 2033. The shift towards contactless payments and the increasing adoption of mobile wallets are key trends shaping consumer behavior. Technological disruptions, such as the rise of open banking and embedded finance, are also transforming the industry landscape. The market size in 2025 is estimated at xx Million, projected to reach xx Million by 2033.
Dominant Regions, Countries, or Segments in Hong Kong Payment Industry
This section identifies the leading segments within the Hong Kong payment industry. While Hong Kong is a single entity, analysis is conducted across identified segments.
- By Mode of Payment: Point-of-sale (POS) payments remain dominant, although online sales are experiencing rapid growth, driven by the rise of e-commerce. The online sales segment is projected to show the highest CAGR (xx%) during the forecast period.
- By End-user Industry: The retail sector is the largest segment, followed by entertainment and hospitality. However, growth potential exists in emerging sectors such as healthcare and other end-user industries as digitalization increases. The retail segment is estimated to account for xx% of the market in 2025.
Hong Kong Payment Industry Product Landscape
The Hong Kong payment industry offers a diverse range of products, from traditional credit and debit cards to innovative mobile wallets and digital payment platforms. Key trends include the increasing integration of biometric authentication, the adoption of tokenization for enhanced security, and the development of specialized solutions for specific industries. Competition is fierce, with companies continuously launching new features and services to attract and retain customers. These offerings include customized loyalty programs and advanced fraud prevention measures.
Key Drivers, Barriers & Challenges in Hong Kong Payment Industry
Key Drivers:
- The increasing adoption of smartphones and mobile internet penetration.
- Government initiatives promoting digital financial inclusion.
- Growth of e-commerce and online transactions.
Key Challenges:
- Maintaining robust cybersecurity infrastructure to mitigate fraud and data breaches.
- Ensuring interoperability between different payment systems and platforms.
- Adapting to evolving regulatory frameworks and compliance requirements. The cost of compliance accounts for approximately xx% of operating expenses for some companies.
Emerging Opportunities in Hong Kong Payment Industry
Emerging opportunities include the expansion of BNPL services, the integration of blockchain technology, and the development of personalized financial solutions catered to specific customer needs. Untapped markets include micro, small, and medium-sized enterprises (MSMEs) and the unbanked population.
Growth Accelerators in the Hong Kong Payment Industry
Strategic partnerships between fintech companies and traditional financial institutions are accelerating growth. Technological advancements, such as AI-powered fraud detection systems, are enhancing efficiency and security. Expansion into new market segments, like the growing healthcare sector, presents significant opportunities.
Key Players Shaping the Hong Kong Payment Industry Market
- Diners Club International
- Visa Inc
- Standard Chartered Bank (HK) Limited
- Citibank
- HSBC
- Bank of China
- American Express Company
- The Bank of East Asia Limited (BEA)
- Mastercard Incorporated
- EPS Company
Notable Milestones in Hong Kong Payment Industry Sector
- November 2023: JCB and Stripe expanded their partnership to Europe, Singapore, and Hong Kong, enhancing payment options for merchants.
In-Depth Hong Kong Payment Industry Market Outlook
The Hong Kong payment industry is poised for sustained growth, driven by technological advancements, favorable regulatory support, and the increasing adoption of digital payment methods. Strategic partnerships and the expansion into new market segments will be key drivers of future success. The market presents significant opportunities for both established players and emerging fintech companies.
Hong Kong Payment Industry Segmentation
-
1. Mode of Payment
-
1.1. By Point of Sale
- 1.1.1. Card Payments
- 1.1.2. Digital Wallet
- 1.1.3. Cash
- 1.1.4. Other Point of Sales
-
1.2. By Online Sale
- 1.2.1. Other Online Sales
-
1.1. By Point of Sale
-
2. End-user Industry
- 2.1. Retail
- 2.2. Entertainment
- 2.3. Healthcare
- 2.4. Hospitality
- 2.5. Other End-user Industries
Hong Kong Payment Industry Segmentation By Geography
-
1. North America
- 1.1. United States
- 1.2. Canada
- 1.3. Mexico
-
2. South America
- 2.1. Brazil
- 2.2. Argentina
- 2.3. Rest of South America
-
3. Europe
- 3.1. United Kingdom
- 3.2. Germany
- 3.3. France
- 3.4. Italy
- 3.5. Spain
- 3.6. Russia
- 3.7. Benelux
- 3.8. Nordics
- 3.9. Rest of Europe
-
4. Middle East & Africa
- 4.1. Turkey
- 4.2. Israel
- 4.3. GCC
- 4.4. North Africa
- 4.5. South Africa
- 4.6. Rest of Middle East & Africa
-
5. Asia Pacific
- 5.1. China
- 5.2. India
- 5.3. Japan
- 5.4. South Korea
- 5.5. ASEAN
- 5.6. Oceania
- 5.7. Rest of Asia Pacific
Hong Kong Payment Industry Regional Market Share
Geographic Coverage of Hong Kong Payment Industry
Hong Kong Payment Industry REPORT HIGHLIGHTS
| Aspects | Details |
|---|---|
| Study Period | 2020-2034 |
| Base Year | 2025 |
| Estimated Year | 2026 |
| Forecast Period | 2026-2034 |
| Historical Period | 2020-2025 |
| Growth Rate | CAGR of 5.66% from 2020-2034 |
| Segmentation |
|
Table of Contents
- 1. Introduction
- 1.1. Research Scope
- 1.2. Market Segmentation
- 1.3. Research Objective
- 1.4. Definitions and Assumptions
- 2. Executive Summary
- 2.1. Market Snapshot
- 3. Market Dynamics
- 3.1. Market Drivers
- 3.2. Market Restrains
- 3.3. Market Trends
- 3.4. Market Opportunities
- 4. Market Factor Analysis
- 4.1. Porters Five Forces
- 4.1.1. Bargaining Power of Suppliers
- 4.1.2. Bargaining Power of Buyers
- 4.1.3. Threat of New Entrants
- 4.1.4. Threat of Substitutes
- 4.1.5. Competitive Rivalry
- 4.2. PESTEL analysis
- 4.3. BCG Analysis
- 4.3.1. Stars (High Growth, High Market Share)
- 4.3.2. Cash Cows (Low Growth, High Market Share)
- 4.3.3. Question Mark (High Growth, Low Market Share)
- 4.3.4. Dogs (Low Growth, Low Market Share)
- 4.4. Ansoff Matrix Analysis
- 4.5. Supply Chain Analysis
- 4.6. Regulatory Landscape
- 4.7. Current Market Potential and Opportunity Assessment (TAM–SAM–SOM Framework)
- 4.8. NRP Analyst Note
- 4.1. Porters Five Forces
- 5. Market Analysis, Insights and Forecast 2021-2033
- 5.1. Market Analysis, Insights and Forecast - by Mode of Payment
- 5.1.1. By Point of Sale
- 5.1.1.1. Card Payments
- 5.1.1.2. Digital Wallet
- 5.1.1.3. Cash
- 5.1.1.4. Other Point of Sales
- 5.1.2. By Online Sale
- 5.1.2.1. Other Online Sales
- 5.1.1. By Point of Sale
- 5.2. Market Analysis, Insights and Forecast - by End-user Industry
- 5.2.1. Retail
- 5.2.2. Entertainment
- 5.2.3. Healthcare
- 5.2.4. Hospitality
- 5.2.5. Other End-user Industries
- 5.3. Market Analysis, Insights and Forecast - by Region
- 5.3.1. North America
- 5.3.2. South America
- 5.3.3. Europe
- 5.3.4. Middle East & Africa
- 5.3.5. Asia Pacific
- 5.1. Market Analysis, Insights and Forecast - by Mode of Payment
- 6. Global Hong Kong Payment Industry Analysis, Insights and Forecast, 2021-2033
- 6.1. Market Analysis, Insights and Forecast - by Mode of Payment
- 6.1.1. By Point of Sale
- 6.1.1.1. Card Payments
- 6.1.1.2. Digital Wallet
- 6.1.1.3. Cash
- 6.1.1.4. Other Point of Sales
- 6.1.2. By Online Sale
- 6.1.2.1. Other Online Sales
- 6.1.1. By Point of Sale
- 6.2. Market Analysis, Insights and Forecast - by End-user Industry
- 6.2.1. Retail
- 6.2.2. Entertainment
- 6.2.3. Healthcare
- 6.2.4. Hospitality
- 6.2.5. Other End-user Industries
- 6.1. Market Analysis, Insights and Forecast - by Mode of Payment
- 7. North America Hong Kong Payment Industry Analysis, Insights and Forecast, 2020-2032
- 7.1. Market Analysis, Insights and Forecast - by Mode of Payment
- 7.1.1. By Point of Sale
- 7.1.1.1. Card Payments
- 7.1.1.2. Digital Wallet
- 7.1.1.3. Cash
- 7.1.1.4. Other Point of Sales
- 7.1.2. By Online Sale
- 7.1.2.1. Other Online Sales
- 7.1.1. By Point of Sale
- 7.2. Market Analysis, Insights and Forecast - by End-user Industry
- 7.2.1. Retail
- 7.2.2. Entertainment
- 7.2.3. Healthcare
- 7.2.4. Hospitality
- 7.2.5. Other End-user Industries
- 7.1. Market Analysis, Insights and Forecast - by Mode of Payment
- 8. South America Hong Kong Payment Industry Analysis, Insights and Forecast, 2020-2032
- 8.1. Market Analysis, Insights and Forecast - by Mode of Payment
- 8.1.1. By Point of Sale
- 8.1.1.1. Card Payments
- 8.1.1.2. Digital Wallet
- 8.1.1.3. Cash
- 8.1.1.4. Other Point of Sales
- 8.1.2. By Online Sale
- 8.1.2.1. Other Online Sales
- 8.1.1. By Point of Sale
- 8.2. Market Analysis, Insights and Forecast - by End-user Industry
- 8.2.1. Retail
- 8.2.2. Entertainment
- 8.2.3. Healthcare
- 8.2.4. Hospitality
- 8.2.5. Other End-user Industries
- 8.1. Market Analysis, Insights and Forecast - by Mode of Payment
- 9. Europe Hong Kong Payment Industry Analysis, Insights and Forecast, 2020-2032
- 9.1. Market Analysis, Insights and Forecast - by Mode of Payment
- 9.1.1. By Point of Sale
- 9.1.1.1. Card Payments
- 9.1.1.2. Digital Wallet
- 9.1.1.3. Cash
- 9.1.1.4. Other Point of Sales
- 9.1.2. By Online Sale
- 9.1.2.1. Other Online Sales
- 9.1.1. By Point of Sale
- 9.2. Market Analysis, Insights and Forecast - by End-user Industry
- 9.2.1. Retail
- 9.2.2. Entertainment
- 9.2.3. Healthcare
- 9.2.4. Hospitality
- 9.2.5. Other End-user Industries
- 9.1. Market Analysis, Insights and Forecast - by Mode of Payment
- 10. Middle East & Africa Hong Kong Payment Industry Analysis, Insights and Forecast, 2020-2032
- 10.1. Market Analysis, Insights and Forecast - by Mode of Payment
- 10.1.1. By Point of Sale
- 10.1.1.1. Card Payments
- 10.1.1.2. Digital Wallet
- 10.1.1.3. Cash
- 10.1.1.4. Other Point of Sales
- 10.1.2. By Online Sale
- 10.1.2.1. Other Online Sales
- 10.1.1. By Point of Sale
- 10.2. Market Analysis, Insights and Forecast - by End-user Industry
- 10.2.1. Retail
- 10.2.2. Entertainment
- 10.2.3. Healthcare
- 10.2.4. Hospitality
- 10.2.5. Other End-user Industries
- 10.1. Market Analysis, Insights and Forecast - by Mode of Payment
- 11. Asia Pacific Hong Kong Payment Industry Analysis, Insights and Forecast, 2020-2032
- 11.1. Market Analysis, Insights and Forecast - by Mode of Payment
- 11.1.1. By Point of Sale
- 11.1.1.1. Card Payments
- 11.1.1.2. Digital Wallet
- 11.1.1.3. Cash
- 11.1.1.4. Other Point of Sales
- 11.1.2. By Online Sale
- 11.1.2.1. Other Online Sales
- 11.1.1. By Point of Sale
- 11.2. Market Analysis, Insights and Forecast - by End-user Industry
- 11.2.1. Retail
- 11.2.2. Entertainment
- 11.2.3. Healthcare
- 11.2.4. Hospitality
- 11.2.5. Other End-user Industries
- 11.1. Market Analysis, Insights and Forecast - by Mode of Payment
- 12. Competitive Analysis
- 12.1. Company Profiles
- 12.1.1 Diners Club Internationa
- 12.1.1.1. Company Overview
- 12.1.1.2. Products
- 12.1.1.3. Company Financials
- 12.1.1.4. SWOT Analysis
- 12.1.2 Visa Inc
- 12.1.2.1. Company Overview
- 12.1.2.2. Products
- 12.1.2.3. Company Financials
- 12.1.2.4. SWOT Analysis
- 12.1.3 Standard Chartered Bank (HK) Limited
- 12.1.3.1. Company Overview
- 12.1.3.2. Products
- 12.1.3.3. Company Financials
- 12.1.3.4. SWOT Analysis
- 12.1.4 Citibank
- 12.1.4.1. Company Overview
- 12.1.4.2. Products
- 12.1.4.3. Company Financials
- 12.1.4.4. SWOT Analysis
- 12.1.5 HSBC
- 12.1.5.1. Company Overview
- 12.1.5.2. Products
- 12.1.5.3. Company Financials
- 12.1.5.4. SWOT Analysis
- 12.1.6 Bank of China
- 12.1.6.1. Company Overview
- 12.1.6.2. Products
- 12.1.6.3. Company Financials
- 12.1.6.4. SWOT Analysis
- 12.1.7 American Express Company
- 12.1.7.1. Company Overview
- 12.1.7.2. Products
- 12.1.7.3. Company Financials
- 12.1.7.4. SWOT Analysis
- 12.1.8 The Bank of East Asia Limited (BEA)
- 12.1.8.1. Company Overview
- 12.1.8.2. Products
- 12.1.8.3. Company Financials
- 12.1.8.4. SWOT Analysis
- 12.1.9 Mastercard Incorporated
- 12.1.9.1. Company Overview
- 12.1.9.2. Products
- 12.1.9.3. Company Financials
- 12.1.9.4. SWOT Analysis
- 12.1.10 EPS Company
- 12.1.10.1. Company Overview
- 12.1.10.2. Products
- 12.1.10.3. Company Financials
- 12.1.10.4. SWOT Analysis
- 12.1.1 Diners Club Internationa
- 12.2. Market Entropy
- 12.2.1 Company's Key Areas Served
- 12.2.2 Recent Developments
- 12.3. Company Market Share Analysis 2025
- 12.3.1 Top 5 Companies Market Share Analysis
- 12.3.2 Top 3 Companies Market Share Analysis
- 12.4. List of Potential Customers
- 13. Research Methodology
List of Figures
- Figure 1: Global Hong Kong Payment Industry Revenue Breakdown (Million, %) by Region 2025 & 2033
- Figure 2: North America Hong Kong Payment Industry Revenue (Million), by Mode of Payment 2025 & 2033
- Figure 3: North America Hong Kong Payment Industry Revenue Share (%), by Mode of Payment 2025 & 2033
- Figure 4: North America Hong Kong Payment Industry Revenue (Million), by End-user Industry 2025 & 2033
- Figure 5: North America Hong Kong Payment Industry Revenue Share (%), by End-user Industry 2025 & 2033
- Figure 6: North America Hong Kong Payment Industry Revenue (Million), by Country 2025 & 2033
- Figure 7: North America Hong Kong Payment Industry Revenue Share (%), by Country 2025 & 2033
- Figure 8: South America Hong Kong Payment Industry Revenue (Million), by Mode of Payment 2025 & 2033
- Figure 9: South America Hong Kong Payment Industry Revenue Share (%), by Mode of Payment 2025 & 2033
- Figure 10: South America Hong Kong Payment Industry Revenue (Million), by End-user Industry 2025 & 2033
- Figure 11: South America Hong Kong Payment Industry Revenue Share (%), by End-user Industry 2025 & 2033
- Figure 12: South America Hong Kong Payment Industry Revenue (Million), by Country 2025 & 2033
- Figure 13: South America Hong Kong Payment Industry Revenue Share (%), by Country 2025 & 2033
- Figure 14: Europe Hong Kong Payment Industry Revenue (Million), by Mode of Payment 2025 & 2033
- Figure 15: Europe Hong Kong Payment Industry Revenue Share (%), by Mode of Payment 2025 & 2033
- Figure 16: Europe Hong Kong Payment Industry Revenue (Million), by End-user Industry 2025 & 2033
- Figure 17: Europe Hong Kong Payment Industry Revenue Share (%), by End-user Industry 2025 & 2033
- Figure 18: Europe Hong Kong Payment Industry Revenue (Million), by Country 2025 & 2033
- Figure 19: Europe Hong Kong Payment Industry Revenue Share (%), by Country 2025 & 2033
- Figure 20: Middle East & Africa Hong Kong Payment Industry Revenue (Million), by Mode of Payment 2025 & 2033
- Figure 21: Middle East & Africa Hong Kong Payment Industry Revenue Share (%), by Mode of Payment 2025 & 2033
- Figure 22: Middle East & Africa Hong Kong Payment Industry Revenue (Million), by End-user Industry 2025 & 2033
- Figure 23: Middle East & Africa Hong Kong Payment Industry Revenue Share (%), by End-user Industry 2025 & 2033
- Figure 24: Middle East & Africa Hong Kong Payment Industry Revenue (Million), by Country 2025 & 2033
- Figure 25: Middle East & Africa Hong Kong Payment Industry Revenue Share (%), by Country 2025 & 2033
- Figure 26: Asia Pacific Hong Kong Payment Industry Revenue (Million), by Mode of Payment 2025 & 2033
- Figure 27: Asia Pacific Hong Kong Payment Industry Revenue Share (%), by Mode of Payment 2025 & 2033
- Figure 28: Asia Pacific Hong Kong Payment Industry Revenue (Million), by End-user Industry 2025 & 2033
- Figure 29: Asia Pacific Hong Kong Payment Industry Revenue Share (%), by End-user Industry 2025 & 2033
- Figure 30: Asia Pacific Hong Kong Payment Industry Revenue (Million), by Country 2025 & 2033
- Figure 31: Asia Pacific Hong Kong Payment Industry Revenue Share (%), by Country 2025 & 2033
List of Tables
- Table 1: Global Hong Kong Payment Industry Revenue Million Forecast, by Mode of Payment 2020 & 2033
- Table 2: Global Hong Kong Payment Industry Revenue Million Forecast, by End-user Industry 2020 & 2033
- Table 3: Global Hong Kong Payment Industry Revenue Million Forecast, by Region 2020 & 2033
- Table 4: Global Hong Kong Payment Industry Revenue Million Forecast, by Mode of Payment 2020 & 2033
- Table 5: Global Hong Kong Payment Industry Revenue Million Forecast, by End-user Industry 2020 & 2033
- Table 6: Global Hong Kong Payment Industry Revenue Million Forecast, by Country 2020 & 2033
- Table 7: United States Hong Kong Payment Industry Revenue (Million) Forecast, by Application 2020 & 2033
- Table 8: Canada Hong Kong Payment Industry Revenue (Million) Forecast, by Application 2020 & 2033
- Table 9: Mexico Hong Kong Payment Industry Revenue (Million) Forecast, by Application 2020 & 2033
- Table 10: Global Hong Kong Payment Industry Revenue Million Forecast, by Mode of Payment 2020 & 2033
- Table 11: Global Hong Kong Payment Industry Revenue Million Forecast, by End-user Industry 2020 & 2033
- Table 12: Global Hong Kong Payment Industry Revenue Million Forecast, by Country 2020 & 2033
- Table 13: Brazil Hong Kong Payment Industry Revenue (Million) Forecast, by Application 2020 & 2033
- Table 14: Argentina Hong Kong Payment Industry Revenue (Million) Forecast, by Application 2020 & 2033
- Table 15: Rest of South America Hong Kong Payment Industry Revenue (Million) Forecast, by Application 2020 & 2033
- Table 16: Global Hong Kong Payment Industry Revenue Million Forecast, by Mode of Payment 2020 & 2033
- Table 17: Global Hong Kong Payment Industry Revenue Million Forecast, by End-user Industry 2020 & 2033
- Table 18: Global Hong Kong Payment Industry Revenue Million Forecast, by Country 2020 & 2033
- Table 19: United Kingdom Hong Kong Payment Industry Revenue (Million) Forecast, by Application 2020 & 2033
- Table 20: Germany Hong Kong Payment Industry Revenue (Million) Forecast, by Application 2020 & 2033
- Table 21: France Hong Kong Payment Industry Revenue (Million) Forecast, by Application 2020 & 2033
- Table 22: Italy Hong Kong Payment Industry Revenue (Million) Forecast, by Application 2020 & 2033
- Table 23: Spain Hong Kong Payment Industry Revenue (Million) Forecast, by Application 2020 & 2033
- Table 24: Russia Hong Kong Payment Industry Revenue (Million) Forecast, by Application 2020 & 2033
- Table 25: Benelux Hong Kong Payment Industry Revenue (Million) Forecast, by Application 2020 & 2033
- Table 26: Nordics Hong Kong Payment Industry Revenue (Million) Forecast, by Application 2020 & 2033
- Table 27: Rest of Europe Hong Kong Payment Industry Revenue (Million) Forecast, by Application 2020 & 2033
- Table 28: Global Hong Kong Payment Industry Revenue Million Forecast, by Mode of Payment 2020 & 2033
- Table 29: Global Hong Kong Payment Industry Revenue Million Forecast, by End-user Industry 2020 & 2033
- Table 30: Global Hong Kong Payment Industry Revenue Million Forecast, by Country 2020 & 2033
- Table 31: Turkey Hong Kong Payment Industry Revenue (Million) Forecast, by Application 2020 & 2033
- Table 32: Israel Hong Kong Payment Industry Revenue (Million) Forecast, by Application 2020 & 2033
- Table 33: GCC Hong Kong Payment Industry Revenue (Million) Forecast, by Application 2020 & 2033
- Table 34: North Africa Hong Kong Payment Industry Revenue (Million) Forecast, by Application 2020 & 2033
- Table 35: South Africa Hong Kong Payment Industry Revenue (Million) Forecast, by Application 2020 & 2033
- Table 36: Rest of Middle East & Africa Hong Kong Payment Industry Revenue (Million) Forecast, by Application 2020 & 2033
- Table 37: Global Hong Kong Payment Industry Revenue Million Forecast, by Mode of Payment 2020 & 2033
- Table 38: Global Hong Kong Payment Industry Revenue Million Forecast, by End-user Industry 2020 & 2033
- Table 39: Global Hong Kong Payment Industry Revenue Million Forecast, by Country 2020 & 2033
- Table 40: China Hong Kong Payment Industry Revenue (Million) Forecast, by Application 2020 & 2033
- Table 41: India Hong Kong Payment Industry Revenue (Million) Forecast, by Application 2020 & 2033
- Table 42: Japan Hong Kong Payment Industry Revenue (Million) Forecast, by Application 2020 & 2033
- Table 43: South Korea Hong Kong Payment Industry Revenue (Million) Forecast, by Application 2020 & 2033
- Table 44: ASEAN Hong Kong Payment Industry Revenue (Million) Forecast, by Application 2020 & 2033
- Table 45: Oceania Hong Kong Payment Industry Revenue (Million) Forecast, by Application 2020 & 2033
- Table 46: Rest of Asia Pacific Hong Kong Payment Industry Revenue (Million) Forecast, by Application 2020 & 2033
Frequently Asked Questions
1. What is the projected Compound Annual Growth Rate (CAGR) of the Hong Kong Payment Industry?
The projected CAGR is approximately 5.66%.
2. Which companies are prominent players in the Hong Kong Payment Industry?
Key companies in the market include Diners Club Internationa, Visa Inc, Standard Chartered Bank (HK) Limited, Citibank, HSBC, Bank of China, American Express Company, The Bank of East Asia Limited (BEA), Mastercard Incorporated, EPS Company.
3. What are the main segments of the Hong Kong Payment Industry?
The market segments include Mode of Payment, End-user Industry.
4. Can you provide details about the market size?
The market size is estimated to be USD 146.17 Million as of 2022.
5. What are some drivers contributing to market growth?
Integration of Payment Gateways; Initiatives by the Government to Advance in Digital Payments.
6. What are the notable trends driving market growth?
Card Payments to Hold Significant Share in Online Payment Sector.
7. Are there any restraints impacting market growth?
Rising Concern Regarding e-Waste.
8. Can you provide examples of recent developments in the market?
November 2023 - JCB and Stripe Expanded their Partnership to Europe, Singapore, and Hong Kong. As part of this expansion, Stripe added JCB to its default payment scheme for merchants in the United Kingdom and Ireland in August and for merchants in other European countries, Singapore and Hong Kong.
9. What pricing options are available for accessing the report?
Pricing options include single-user, multi-user, and enterprise licenses priced at USD 3800, USD 4500, and USD 5800 respectively.
10. Is the market size provided in terms of value or volume?
The market size is provided in terms of value, measured in Million.
11. Are there any specific market keywords associated with the report?
Yes, the market keyword associated with the report is "Hong Kong Payment Industry," which aids in identifying and referencing the specific market segment covered.
12. How do I determine which pricing option suits my needs best?
The pricing options vary based on user requirements and access needs. Individual users may opt for single-user licenses, while businesses requiring broader access may choose multi-user or enterprise licenses for cost-effective access to the report.
13. Are there any additional resources or data provided in the Hong Kong Payment Industry report?
While the report offers comprehensive insights, it's advisable to review the specific contents or supplementary materials provided to ascertain if additional resources or data are available.
14. How can I stay updated on further developments or reports in the Hong Kong Payment Industry?
To stay informed about further developments, trends, and reports in the Hong Kong Payment Industry, consider subscribing to industry newsletters, following relevant companies and organizations, or regularly checking reputable industry news sources and publications.
Methodology
Step 1 - Identification of Relevant Samples Size from Population Database


Step 2 - Approaches for Defining Global Market Size (Value, Volume* & Price*)

Note*: In applicable scenarios
Step 3 - Data Sources
Primary Research
- Web Analytics
- Survey Reports
- Research Institute
- Latest Research Reports
- Opinion Leaders
Secondary Research
- Annual Reports
- White Paper
- Latest Press Release
- Industry Association
- Paid Database
- Investor Presentations

Step 4 - Data Triangulation
Involves using different sources of information in order to increase the validity of a study
These sources are likely to be stakeholders in a program - participants, other researchers, program staff, other community members, and so on.
Then we put all data in single framework & apply various statistical tools to find out the dynamic on the market.
During the analysis stage, feedback from the stakeholder groups would be compared to determine areas of agreement as well as areas of divergence