

Key Insights
The industrial radiography equipment market, projected to reach $1.35 billion by 2025, is set to witness significant expansion with a compound annual growth rate (CAGR) of 8.6% from 2025 to 2033. This growth is propelled by escalating demand for non-destructive testing (NDT) solutions across critical sectors including aerospace, automotive, and energy. Stringent safety and quality assurance mandates across these industries necessitate advanced inspection techniques, directly fueling the market for radiography equipment. Technological innovations in digital radiography, such as computed tomography (CT) and direct radiography, are enhancing image fidelity, reducing inspection durations, and improving operational efficacy, thereby accelerating adoption. The increasing integration of automation and digitization within industrial workflows further supports market expansion, facilitating seamless data analysis and reporting when integrated with radiography systems. Moreover, burgeoning global infrastructure development, particularly in emerging economies, presents substantial opportunities for industrial radiography equipment manufacturers.
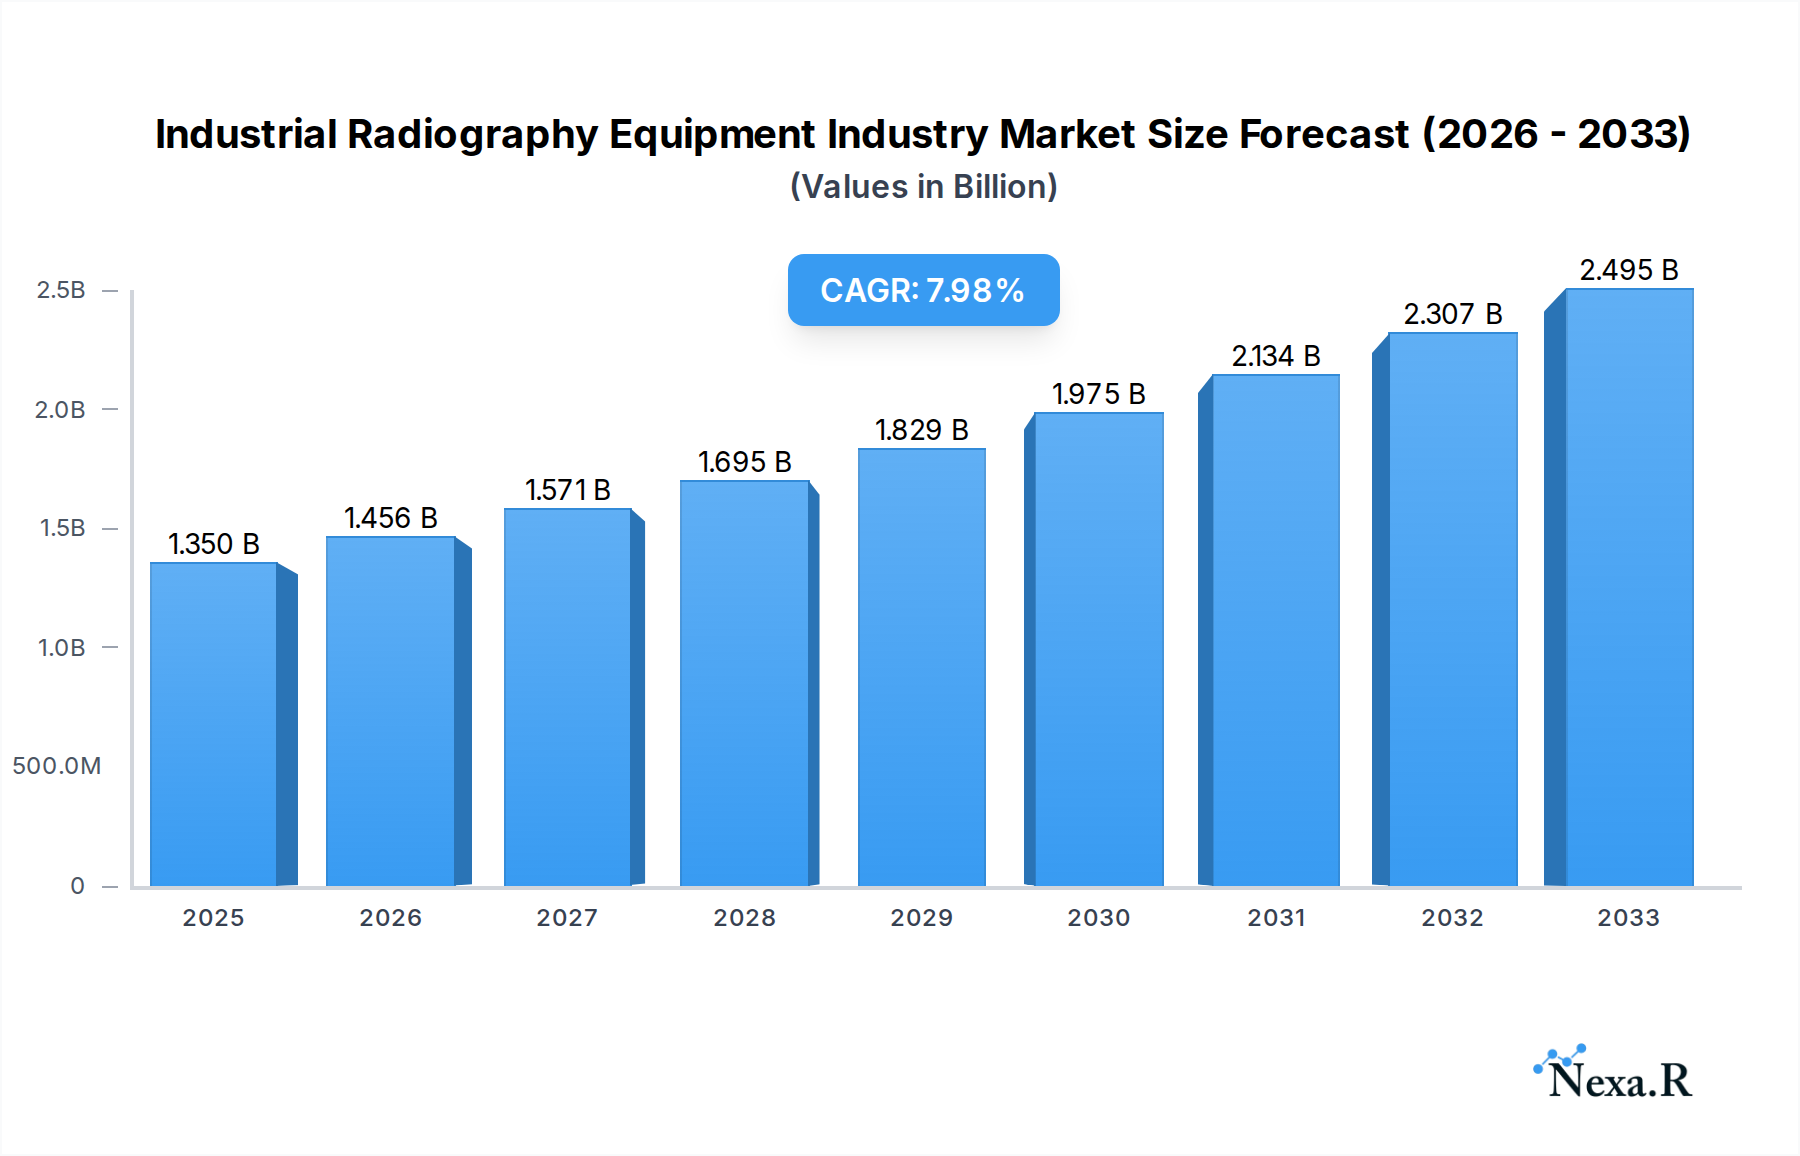
Industrial Radiography Equipment Industry Market Size (In Billion)
Despite positive growth prospects, the market faces hurdles. Substantial upfront investment for sophisticated radiography systems may deter smaller enterprises. Additionally, the requirement for skilled professionals to operate and interpret radiographic imagery poses a potential skills deficit that could impede widespread adoption. However, the persistent focus on safety and the inherent long-term advantages of proactive NDT are anticipated to counterbalance these challenges, ensuring sustained market growth throughout the forecast period. Market segmentation indicates a clear preference for digital radiography over traditional film-based methods, underscoring the industry's shift towards enhanced efficiency and precision. Geographically, North America and Europe currently dominate the market, though the Asia-Pacific region is poised for rapid expansion, driven by industrial growth and infrastructure initiatives in economies like China and India.

Industrial Radiography Equipment Industry Company Market Share
Industrial Radiography Equipment Market Report: 2019-2033
This comprehensive report provides a detailed analysis of the Industrial Radiography Equipment market, encompassing market size, growth trends, competitive landscape, and future outlook. The study period covers 2019-2033, with 2025 as the base year and a forecast period of 2025-2033. This report is essential for industry professionals, investors, and anyone seeking to understand the dynamics of this vital sector. The parent market is the Industrial Inspection Equipment market and the child market is the NDT Equipment market.
Industrial Radiography Equipment Industry Market Dynamics & Structure
The industrial radiography equipment market exhibits a moderately concentrated structure, with key players holding significant market share. Technological innovation, particularly in digital radiography and computed tomography (CT), is a primary growth driver. Stringent safety regulations and quality standards influence market dynamics, while the availability of alternative non-destructive testing (NDT) methods presents competitive pressure. End-user demographics are diverse, encompassing aerospace, energy, automotive, and manufacturing sectors. M&A activity has been moderate, with strategic acquisitions aimed at expanding product portfolios and geographic reach.
- Market Concentration: Moderately concentrated, with top 5 players holding approximately xx% market share in 2024.
- Technological Innovation: Rapid advancements in digital radiography, CT, and AI-powered image analysis are key drivers.
- Regulatory Framework: Stringent safety and quality standards (e.g., ISO, ASTM) influence equipment design and adoption.
- Competitive Substitutes: Ultrasonic testing, magnetic particle inspection, and liquid penetrant testing offer alternative NDT solutions.
- End-User Demographics: Diverse, including aerospace & defense (xx%), energy & power (xx%), automotive (xx%), and manufacturing (xx%).
- M&A Trends: Moderate activity, with xx major deals recorded between 2019 and 2024, primarily focused on technology integration and market expansion.
Industrial Radiography Equipment Industry Growth Trends & Insights
The industrial radiography equipment market has witnessed steady growth over the historical period (2019-2024), driven by increasing demand for quality control and safety across various industries. The market size in 2024 was estimated at xx Million units, exhibiting a CAGR of xx% during this period. Adoption rates are increasing, particularly in sectors with stringent regulatory requirements. Technological disruptions, such as the transition from film-based to digital radiography, are reshaping the market landscape. Consumer behavior shifts are evident, with a growing preference for faster, more efficient, and user-friendly systems. The projected market size in 2033 is xx Million units, with a forecast CAGR of xx% during 2025-2033. This growth is fueled by increasing investments in infrastructure projects, rising demand for advanced materials, and the ongoing adoption of advanced NDT technologies.
Dominant Regions, Countries, or Segments in Industrial Radiography Equipment Industry
North America and Europe currently dominate the industrial radiography equipment market, driven by robust industrial sectors, stringent regulatory standards, and high investments in infrastructure. Within technology segments, direct radiography and computed tomography are experiencing rapid growth due to their superior image quality and efficiency. In end-user industries, aerospace and defense, along with energy and power, show the highest adoption rates due to critical safety requirements. Asia-Pacific is emerging as a key growth region, fueled by rapid industrialization and infrastructure development.
- Key Drivers: Stringent safety regulations (North America, Europe), increasing infrastructure spending (Asia-Pacific), rising demand for advanced materials (globally).
- Dominant Regions: North America and Europe (xx% combined market share in 2024), followed by Asia-Pacific.
- Dominant Segments (Technology): Direct radiography and computed tomography are experiencing the fastest growth.
- Dominant Segments (End-user): Aerospace & defense, and energy & power show the highest market penetration.
Industrial Radiography Equipment Industry Product Landscape
The industrial radiography equipment market offers a diverse range of products, including film radiography systems, computed radiography (CR) systems, direct radiography (DR) systems, and computed tomography (CT) scanners. Recent innovations focus on improving image quality, enhancing speed and efficiency, and integrating advanced features like AI-powered image analysis. Unique selling propositions include portability, ease of use, high-resolution imaging, and advanced data analytics capabilities. Technological advancements are centered around digital detectors, advanced software algorithms, and improved radiation shielding.
Key Drivers, Barriers & Challenges in Industrial Radiography Equipment Industry
Key Drivers:
- Increasing demand for quality control and safety in various industries.
- Stringent regulatory requirements for non-destructive testing.
- Advancements in digital radiography and computed tomography technologies.
- Growing investments in infrastructure projects globally.
Key Challenges and Restraints:
- High initial investment costs for advanced systems.
- The need for skilled operators and technicians.
- Potential risks associated with ionizing radiation.
- Competition from alternative NDT methods.
- Supply chain disruptions impacting component availability. These disruptions resulted in a xx% increase in equipment costs in 2022.
Emerging Opportunities in Industrial Radiography Equipment Industry
- Growing adoption of advanced imaging techniques, like AI-powered image analysis.
- Expansion into new and emerging markets, particularly in developing economies.
- Development of portable and lightweight systems for field applications.
- Growing demand for specialized radiography solutions for specific industries (e.g., 3D printing inspection).
Growth Accelerators in the Industrial Radiography Equipment Industry
Long-term growth is propelled by continuous technological advancements, strategic partnerships between equipment manufacturers and NDT service providers, and expansion into new applications and geographic markets. The integration of AI and machine learning for automated defect detection presents a significant growth opportunity. Government initiatives promoting advanced manufacturing and infrastructure development will also play a crucial role.
Key Players Shaping the Industrial Radiography Equipment Market
- L3Harris Technologies Inc
- Baker Hughes
- Vidisco Ltd (Aran Electronics Ltd )
- Hitachi Ltd
- Comet Holding AG
- Canon Medical Systems Corporation (Canon Inc )
- Rigaku Corporation (Carlyle Group)
- North Star Imaging Inc
- Carestream Health
- Carl Zeiss AG
- Evident Corporation (Bain Capital)
- Hamamatsu Photonics K K
- Durr NDT GmbH & Co Kg
- Teledyne Dalsa Inc (Teledyne Technologies)
- Fujifilm Corporation (Fujifilm Holdings Corporation)
- Nikon Metrology NV (Nikon Corporation)
Notable Milestones in Industrial Radiography Equipment Industry Sector
- July 2023: Canon Inc. launched the Zexirai9 digital X-ray RF system, a significant advancement in digital radiography technology, expected to increase market share for Canon.
- May 2023: Nikon Metrology launched its next-generation VOXLS CT inspection systems, expanding its presence in high-growth markets such as automotive and aerospace.
In-Depth Industrial Radiography Equipment Industry Market Outlook
The industrial radiography equipment market is poised for sustained growth, driven by technological innovation, increasing adoption across various industries, and expansion into new geographic regions. Strategic partnerships, focused investments in R&D, and the development of more user-friendly and cost-effective solutions will be crucial in capturing the significant market potential in the coming years. The market will likely experience consolidation, with larger players acquiring smaller firms to enhance technological capabilities and market presence.
Industrial Radiography Equipment Industry Segmentation
-
1. Technology
- 1.1. Film Radiography
- 1.2. Computed Radiography
- 1.3. Direct Radiography
- 1.4. Computed Tomography
-
2. End-User Industry
- 2.1. Aerospace and Defense
- 2.2. Petrochemical and Gas
- 2.3. Energy and Power
- 2.4. Construction
- 2.5. Automotive and Transportation
- 2.6. Manufacturing
- 2.7. Other End-User Industries
Industrial Radiography Equipment Industry Segmentation By Geography
- 1. North America
- 2. Europe
- 3. Asia
- 4. Australia and New Zealand
- 5. Latin America
- 6. Middle East and Africa
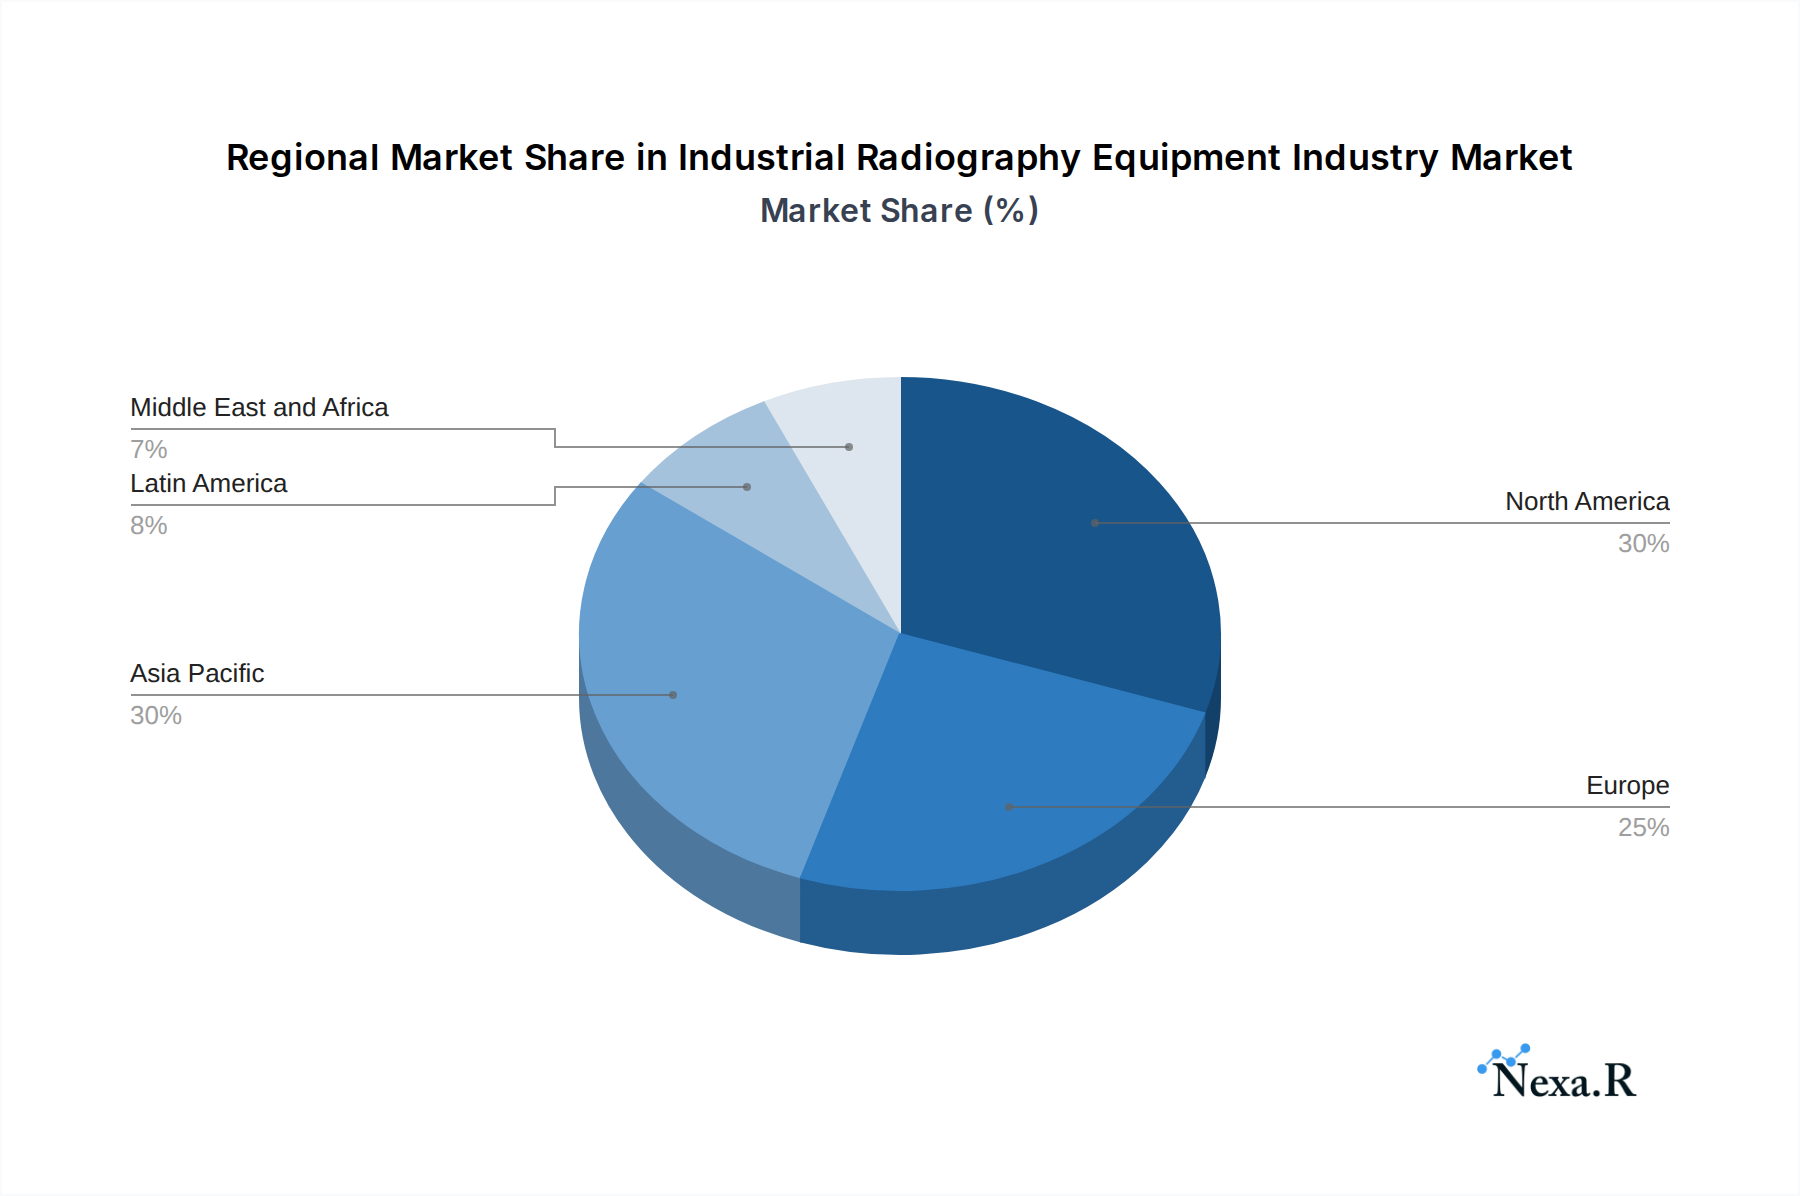
Industrial Radiography Equipment Industry Regional Market Share
Geographic Coverage of Industrial Radiography Equipment Industry
Industrial Radiography Equipment Industry REPORT HIGHLIGHTS
| Aspects | Details |
|---|---|
| Study Period | 2020-2034 |
| Base Year | 2025 |
| Estimated Year | 2026 |
| Forecast Period | 2026-2034 |
| Historical Period | 2020-2025 |
| Growth Rate | CAGR of 8.6% from 2020-2034 |
| Segmentation |
|
Table of Contents
- 1. Introduction
- 1.1. Research Scope
- 1.2. Market Segmentation
- 1.3. Research Objective
- 1.4. Definitions and Assumptions
- 2. Executive Summary
- 2.1. Market Snapshot
- 3. Market Dynamics
- 3.1. Market Drivers
- 3.2. Market Restrains
- 3.3. Market Trends
- 3.4. Market Opportunities
- 4. Market Factor Analysis
- 4.1. Porters Five Forces
- 4.1.1. Bargaining Power of Suppliers
- 4.1.2. Bargaining Power of Buyers
- 4.1.3. Threat of New Entrants
- 4.1.4. Threat of Substitutes
- 4.1.5. Competitive Rivalry
- 4.2. PESTEL analysis
- 4.3. BCG Analysis
- 4.3.1. Stars (High Growth, High Market Share)
- 4.3.2. Cash Cows (Low Growth, High Market Share)
- 4.3.3. Question Mark (High Growth, Low Market Share)
- 4.3.4. Dogs (Low Growth, Low Market Share)
- 4.4. Ansoff Matrix Analysis
- 4.5. Supply Chain Analysis
- 4.6. Regulatory Landscape
- 4.7. Current Market Potential and Opportunity Assessment (TAM–SAM–SOM Framework)
- 4.8. NRP Analyst Note
- 4.1. Porters Five Forces
- 5. Market Analysis, Insights and Forecast 2021-2033
- 5.1. Market Analysis, Insights and Forecast - by Technology
- 5.1.1. Film Radiography
- 5.1.2. Computed Radiography
- 5.1.3. Direct Radiography
- 5.1.4. Computed Tomography
- 5.2. Market Analysis, Insights and Forecast - by End-User Industry
- 5.2.1. Aerospace and Defense
- 5.2.2. Petrochemical and Gas
- 5.2.3. Energy and Power
- 5.2.4. Construction
- 5.2.5. Automotive and Transportation
- 5.2.6. Manufacturing
- 5.2.7. Other End-User Industries
- 5.3. Market Analysis, Insights and Forecast - by Region
- 5.3.1. North America
- 5.3.2. Europe
- 5.3.3. Asia
- 5.3.4. Australia and New Zealand
- 5.3.5. Latin America
- 5.3.6. Middle East and Africa
- 5.1. Market Analysis, Insights and Forecast - by Technology
- 6. Global Industrial Radiography Equipment Industry Analysis, Insights and Forecast, 2021-2033
- 6.1. Market Analysis, Insights and Forecast - by Technology
- 6.1.1. Film Radiography
- 6.1.2. Computed Radiography
- 6.1.3. Direct Radiography
- 6.1.4. Computed Tomography
- 6.2. Market Analysis, Insights and Forecast - by End-User Industry
- 6.2.1. Aerospace and Defense
- 6.2.2. Petrochemical and Gas
- 6.2.3. Energy and Power
- 6.2.4. Construction
- 6.2.5. Automotive and Transportation
- 6.2.6. Manufacturing
- 6.2.7. Other End-User Industries
- 6.1. Market Analysis, Insights and Forecast - by Technology
- 7. North America Industrial Radiography Equipment Industry Analysis, Insights and Forecast, 2020-2032
- 7.1. Market Analysis, Insights and Forecast - by Technology
- 7.1.1. Film Radiography
- 7.1.2. Computed Radiography
- 7.1.3. Direct Radiography
- 7.1.4. Computed Tomography
- 7.2. Market Analysis, Insights and Forecast - by End-User Industry
- 7.2.1. Aerospace and Defense
- 7.2.2. Petrochemical and Gas
- 7.2.3. Energy and Power
- 7.2.4. Construction
- 7.2.5. Automotive and Transportation
- 7.2.6. Manufacturing
- 7.2.7. Other End-User Industries
- 7.1. Market Analysis, Insights and Forecast - by Technology
- 8. Europe Industrial Radiography Equipment Industry Analysis, Insights and Forecast, 2020-2032
- 8.1. Market Analysis, Insights and Forecast - by Technology
- 8.1.1. Film Radiography
- 8.1.2. Computed Radiography
- 8.1.3. Direct Radiography
- 8.1.4. Computed Tomography
- 8.2. Market Analysis, Insights and Forecast - by End-User Industry
- 8.2.1. Aerospace and Defense
- 8.2.2. Petrochemical and Gas
- 8.2.3. Energy and Power
- 8.2.4. Construction
- 8.2.5. Automotive and Transportation
- 8.2.6. Manufacturing
- 8.2.7. Other End-User Industries
- 8.1. Market Analysis, Insights and Forecast - by Technology
- 9. Asia Industrial Radiography Equipment Industry Analysis, Insights and Forecast, 2020-2032
- 9.1. Market Analysis, Insights and Forecast - by Technology
- 9.1.1. Film Radiography
- 9.1.2. Computed Radiography
- 9.1.3. Direct Radiography
- 9.1.4. Computed Tomography
- 9.2. Market Analysis, Insights and Forecast - by End-User Industry
- 9.2.1. Aerospace and Defense
- 9.2.2. Petrochemical and Gas
- 9.2.3. Energy and Power
- 9.2.4. Construction
- 9.2.5. Automotive and Transportation
- 9.2.6. Manufacturing
- 9.2.7. Other End-User Industries
- 9.1. Market Analysis, Insights and Forecast - by Technology
- 10. Australia and New Zealand Industrial Radiography Equipment Industry Analysis, Insights and Forecast, 2020-2032
- 10.1. Market Analysis, Insights and Forecast - by Technology
- 10.1.1. Film Radiography
- 10.1.2. Computed Radiography
- 10.1.3. Direct Radiography
- 10.1.4. Computed Tomography
- 10.2. Market Analysis, Insights and Forecast - by End-User Industry
- 10.2.1. Aerospace and Defense
- 10.2.2. Petrochemical and Gas
- 10.2.3. Energy and Power
- 10.2.4. Construction
- 10.2.5. Automotive and Transportation
- 10.2.6. Manufacturing
- 10.2.7. Other End-User Industries
- 10.1. Market Analysis, Insights and Forecast - by Technology
- 11. Latin America Industrial Radiography Equipment Industry Analysis, Insights and Forecast, 2020-2032
- 11.1. Market Analysis, Insights and Forecast - by Technology
- 11.1.1. Film Radiography
- 11.1.2. Computed Radiography
- 11.1.3. Direct Radiography
- 11.1.4. Computed Tomography
- 11.2. Market Analysis, Insights and Forecast - by End-User Industry
- 11.2.1. Aerospace and Defense
- 11.2.2. Petrochemical and Gas
- 11.2.3. Energy and Power
- 11.2.4. Construction
- 11.2.5. Automotive and Transportation
- 11.2.6. Manufacturing
- 11.2.7. Other End-User Industries
- 11.1. Market Analysis, Insights and Forecast - by Technology
- 12. Middle East and Africa Industrial Radiography Equipment Industry Analysis, Insights and Forecast, 2020-2032
- 12.1. Market Analysis, Insights and Forecast - by Technology
- 12.1.1. Film Radiography
- 12.1.2. Computed Radiography
- 12.1.3. Direct Radiography
- 12.1.4. Computed Tomography
- 12.2. Market Analysis, Insights and Forecast - by End-User Industry
- 12.2.1. Aerospace and Defense
- 12.2.2. Petrochemical and Gas
- 12.2.3. Energy and Power
- 12.2.4. Construction
- 12.2.5. Automotive and Transportation
- 12.2.6. Manufacturing
- 12.2.7. Other End-User Industries
- 12.1. Market Analysis, Insights and Forecast - by Technology
- 13. Competitive Analysis
- 13.1. Company Profiles
- 13.1.1 L3Harris Technologies Inc
- 13.1.1.1. Company Overview
- 13.1.1.2. Products
- 13.1.1.3. Company Financials
- 13.1.1.4. SWOT Analysis
- 13.1.2 Baker Hughes
- 13.1.2.1. Company Overview
- 13.1.2.2. Products
- 13.1.2.3. Company Financials
- 13.1.2.4. SWOT Analysis
- 13.1.3 Vidisco Ltd (Aran Electronics Ltd )
- 13.1.3.1. Company Overview
- 13.1.3.2. Products
- 13.1.3.3. Company Financials
- 13.1.3.4. SWOT Analysis
- 13.1.4 Hitachi Ltd
- 13.1.4.1. Company Overview
- 13.1.4.2. Products
- 13.1.4.3. Company Financials
- 13.1.4.4. SWOT Analysis
- 13.1.5 Comet Holding AG
- 13.1.5.1. Company Overview
- 13.1.5.2. Products
- 13.1.5.3. Company Financials
- 13.1.5.4. SWOT Analysis
- 13.1.6 Canon Medical Systems Corporation (Canon Inc )
- 13.1.6.1. Company Overview
- 13.1.6.2. Products
- 13.1.6.3. Company Financials
- 13.1.6.4. SWOT Analysis
- 13.1.7 Rigaku Corporation (Carlyle Group)
- 13.1.7.1. Company Overview
- 13.1.7.2. Products
- 13.1.7.3. Company Financials
- 13.1.7.4. SWOT Analysis
- 13.1.8 North Star Imaging Inc
- 13.1.8.1. Company Overview
- 13.1.8.2. Products
- 13.1.8.3. Company Financials
- 13.1.8.4. SWOT Analysis
- 13.1.9 Carestream Health
- 13.1.9.1. Company Overview
- 13.1.9.2. Products
- 13.1.9.3. Company Financials
- 13.1.9.4. SWOT Analysis
- 13.1.10 Carl Zeiss AG
- 13.1.10.1. Company Overview
- 13.1.10.2. Products
- 13.1.10.3. Company Financials
- 13.1.10.4. SWOT Analysis
- 13.1.11 Evident Corporation (Bain Capital)
- 13.1.11.1. Company Overview
- 13.1.11.2. Products
- 13.1.11.3. Company Financials
- 13.1.11.4. SWOT Analysis
- 13.1.12 Hamamatsu Photonics K K
- 13.1.12.1. Company Overview
- 13.1.12.2. Products
- 13.1.12.3. Company Financials
- 13.1.12.4. SWOT Analysis
- 13.1.13 Durr NDT GmbH & Co Kg
- 13.1.13.1. Company Overview
- 13.1.13.2. Products
- 13.1.13.3. Company Financials
- 13.1.13.4. SWOT Analysis
- 13.1.14 Teledyne Dalsa Inc (Teledyne Technologies)
- 13.1.14.1. Company Overview
- 13.1.14.2. Products
- 13.1.14.3. Company Financials
- 13.1.14.4. SWOT Analysis
- 13.1.15 Fujifilm Corporation (Fujifilm Holdings Corporation)
- 13.1.15.1. Company Overview
- 13.1.15.2. Products
- 13.1.15.3. Company Financials
- 13.1.15.4. SWOT Analysis
- 13.1.16 Nikon Metrology NV (Nikon Corporation)
- 13.1.16.1. Company Overview
- 13.1.16.2. Products
- 13.1.16.3. Company Financials
- 13.1.16.4. SWOT Analysis
- 13.1.1 L3Harris Technologies Inc
- 13.2. Market Entropy
- 13.2.1 Company's Key Areas Served
- 13.2.2 Recent Developments
- 13.3. Company Market Share Analysis 2025
- 13.3.1 Top 5 Companies Market Share Analysis
- 13.3.2 Top 3 Companies Market Share Analysis
- 13.4. List of Potential Customers
- 14. Research Methodology
List of Figures
- Figure 1: Global Industrial Radiography Equipment Industry Revenue Breakdown (billion, %) by Region 2025 & 2033
- Figure 2: Global Industrial Radiography Equipment Industry Volume Breakdown (K Unit, %) by Region 2025 & 2033
- Figure 3: North America Industrial Radiography Equipment Industry Revenue (billion), by Technology 2025 & 2033
- Figure 4: North America Industrial Radiography Equipment Industry Volume (K Unit), by Technology 2025 & 2033
- Figure 5: North America Industrial Radiography Equipment Industry Revenue Share (%), by Technology 2025 & 2033
- Figure 6: North America Industrial Radiography Equipment Industry Volume Share (%), by Technology 2025 & 2033
- Figure 7: North America Industrial Radiography Equipment Industry Revenue (billion), by End-User Industry 2025 & 2033
- Figure 8: North America Industrial Radiography Equipment Industry Volume (K Unit), by End-User Industry 2025 & 2033
- Figure 9: North America Industrial Radiography Equipment Industry Revenue Share (%), by End-User Industry 2025 & 2033
- Figure 10: North America Industrial Radiography Equipment Industry Volume Share (%), by End-User Industry 2025 & 2033
- Figure 11: North America Industrial Radiography Equipment Industry Revenue (billion), by Country 2025 & 2033
- Figure 12: North America Industrial Radiography Equipment Industry Volume (K Unit), by Country 2025 & 2033
- Figure 13: North America Industrial Radiography Equipment Industry Revenue Share (%), by Country 2025 & 2033
- Figure 14: North America Industrial Radiography Equipment Industry Volume Share (%), by Country 2025 & 2033
- Figure 15: Europe Industrial Radiography Equipment Industry Revenue (billion), by Technology 2025 & 2033
- Figure 16: Europe Industrial Radiography Equipment Industry Volume (K Unit), by Technology 2025 & 2033
- Figure 17: Europe Industrial Radiography Equipment Industry Revenue Share (%), by Technology 2025 & 2033
- Figure 18: Europe Industrial Radiography Equipment Industry Volume Share (%), by Technology 2025 & 2033
- Figure 19: Europe Industrial Radiography Equipment Industry Revenue (billion), by End-User Industry 2025 & 2033
- Figure 20: Europe Industrial Radiography Equipment Industry Volume (K Unit), by End-User Industry 2025 & 2033
- Figure 21: Europe Industrial Radiography Equipment Industry Revenue Share (%), by End-User Industry 2025 & 2033
- Figure 22: Europe Industrial Radiography Equipment Industry Volume Share (%), by End-User Industry 2025 & 2033
- Figure 23: Europe Industrial Radiography Equipment Industry Revenue (billion), by Country 2025 & 2033
- Figure 24: Europe Industrial Radiography Equipment Industry Volume (K Unit), by Country 2025 & 2033
- Figure 25: Europe Industrial Radiography Equipment Industry Revenue Share (%), by Country 2025 & 2033
- Figure 26: Europe Industrial Radiography Equipment Industry Volume Share (%), by Country 2025 & 2033
- Figure 27: Asia Industrial Radiography Equipment Industry Revenue (billion), by Technology 2025 & 2033
- Figure 28: Asia Industrial Radiography Equipment Industry Volume (K Unit), by Technology 2025 & 2033
- Figure 29: Asia Industrial Radiography Equipment Industry Revenue Share (%), by Technology 2025 & 2033
- Figure 30: Asia Industrial Radiography Equipment Industry Volume Share (%), by Technology 2025 & 2033
- Figure 31: Asia Industrial Radiography Equipment Industry Revenue (billion), by End-User Industry 2025 & 2033
- Figure 32: Asia Industrial Radiography Equipment Industry Volume (K Unit), by End-User Industry 2025 & 2033
- Figure 33: Asia Industrial Radiography Equipment Industry Revenue Share (%), by End-User Industry 2025 & 2033
- Figure 34: Asia Industrial Radiography Equipment Industry Volume Share (%), by End-User Industry 2025 & 2033
- Figure 35: Asia Industrial Radiography Equipment Industry Revenue (billion), by Country 2025 & 2033
- Figure 36: Asia Industrial Radiography Equipment Industry Volume (K Unit), by Country 2025 & 2033
- Figure 37: Asia Industrial Radiography Equipment Industry Revenue Share (%), by Country 2025 & 2033
- Figure 38: Asia Industrial Radiography Equipment Industry Volume Share (%), by Country 2025 & 2033
- Figure 39: Australia and New Zealand Industrial Radiography Equipment Industry Revenue (billion), by Technology 2025 & 2033
- Figure 40: Australia and New Zealand Industrial Radiography Equipment Industry Volume (K Unit), by Technology 2025 & 2033
- Figure 41: Australia and New Zealand Industrial Radiography Equipment Industry Revenue Share (%), by Technology 2025 & 2033
- Figure 42: Australia and New Zealand Industrial Radiography Equipment Industry Volume Share (%), by Technology 2025 & 2033
- Figure 43: Australia and New Zealand Industrial Radiography Equipment Industry Revenue (billion), by End-User Industry 2025 & 2033
- Figure 44: Australia and New Zealand Industrial Radiography Equipment Industry Volume (K Unit), by End-User Industry 2025 & 2033
- Figure 45: Australia and New Zealand Industrial Radiography Equipment Industry Revenue Share (%), by End-User Industry 2025 & 2033
- Figure 46: Australia and New Zealand Industrial Radiography Equipment Industry Volume Share (%), by End-User Industry 2025 & 2033
- Figure 47: Australia and New Zealand Industrial Radiography Equipment Industry Revenue (billion), by Country 2025 & 2033
- Figure 48: Australia and New Zealand Industrial Radiography Equipment Industry Volume (K Unit), by Country 2025 & 2033
- Figure 49: Australia and New Zealand Industrial Radiography Equipment Industry Revenue Share (%), by Country 2025 & 2033
- Figure 50: Australia and New Zealand Industrial Radiography Equipment Industry Volume Share (%), by Country 2025 & 2033
- Figure 51: Latin America Industrial Radiography Equipment Industry Revenue (billion), by Technology 2025 & 2033
- Figure 52: Latin America Industrial Radiography Equipment Industry Volume (K Unit), by Technology 2025 & 2033
- Figure 53: Latin America Industrial Radiography Equipment Industry Revenue Share (%), by Technology 2025 & 2033
- Figure 54: Latin America Industrial Radiography Equipment Industry Volume Share (%), by Technology 2025 & 2033
- Figure 55: Latin America Industrial Radiography Equipment Industry Revenue (billion), by End-User Industry 2025 & 2033
- Figure 56: Latin America Industrial Radiography Equipment Industry Volume (K Unit), by End-User Industry 2025 & 2033
- Figure 57: Latin America Industrial Radiography Equipment Industry Revenue Share (%), by End-User Industry 2025 & 2033
- Figure 58: Latin America Industrial Radiography Equipment Industry Volume Share (%), by End-User Industry 2025 & 2033
- Figure 59: Latin America Industrial Radiography Equipment Industry Revenue (billion), by Country 2025 & 2033
- Figure 60: Latin America Industrial Radiography Equipment Industry Volume (K Unit), by Country 2025 & 2033
- Figure 61: Latin America Industrial Radiography Equipment Industry Revenue Share (%), by Country 2025 & 2033
- Figure 62: Latin America Industrial Radiography Equipment Industry Volume Share (%), by Country 2025 & 2033
- Figure 63: Middle East and Africa Industrial Radiography Equipment Industry Revenue (billion), by Technology 2025 & 2033
- Figure 64: Middle East and Africa Industrial Radiography Equipment Industry Volume (K Unit), by Technology 2025 & 2033
- Figure 65: Middle East and Africa Industrial Radiography Equipment Industry Revenue Share (%), by Technology 2025 & 2033
- Figure 66: Middle East and Africa Industrial Radiography Equipment Industry Volume Share (%), by Technology 2025 & 2033
- Figure 67: Middle East and Africa Industrial Radiography Equipment Industry Revenue (billion), by End-User Industry 2025 & 2033
- Figure 68: Middle East and Africa Industrial Radiography Equipment Industry Volume (K Unit), by End-User Industry 2025 & 2033
- Figure 69: Middle East and Africa Industrial Radiography Equipment Industry Revenue Share (%), by End-User Industry 2025 & 2033
- Figure 70: Middle East and Africa Industrial Radiography Equipment Industry Volume Share (%), by End-User Industry 2025 & 2033
- Figure 71: Middle East and Africa Industrial Radiography Equipment Industry Revenue (billion), by Country 2025 & 2033
- Figure 72: Middle East and Africa Industrial Radiography Equipment Industry Volume (K Unit), by Country 2025 & 2033
- Figure 73: Middle East and Africa Industrial Radiography Equipment Industry Revenue Share (%), by Country 2025 & 2033
- Figure 74: Middle East and Africa Industrial Radiography Equipment Industry Volume Share (%), by Country 2025 & 2033
List of Tables
- Table 1: Global Industrial Radiography Equipment Industry Revenue billion Forecast, by Technology 2020 & 2033
- Table 2: Global Industrial Radiography Equipment Industry Volume K Unit Forecast, by Technology 2020 & 2033
- Table 3: Global Industrial Radiography Equipment Industry Revenue billion Forecast, by End-User Industry 2020 & 2033
- Table 4: Global Industrial Radiography Equipment Industry Volume K Unit Forecast, by End-User Industry 2020 & 2033
- Table 5: Global Industrial Radiography Equipment Industry Revenue billion Forecast, by Region 2020 & 2033
- Table 6: Global Industrial Radiography Equipment Industry Volume K Unit Forecast, by Region 2020 & 2033
- Table 7: Global Industrial Radiography Equipment Industry Revenue billion Forecast, by Technology 2020 & 2033
- Table 8: Global Industrial Radiography Equipment Industry Volume K Unit Forecast, by Technology 2020 & 2033
- Table 9: Global Industrial Radiography Equipment Industry Revenue billion Forecast, by End-User Industry 2020 & 2033
- Table 10: Global Industrial Radiography Equipment Industry Volume K Unit Forecast, by End-User Industry 2020 & 2033
- Table 11: Global Industrial Radiography Equipment Industry Revenue billion Forecast, by Country 2020 & 2033
- Table 12: Global Industrial Radiography Equipment Industry Volume K Unit Forecast, by Country 2020 & 2033
- Table 13: Global Industrial Radiography Equipment Industry Revenue billion Forecast, by Technology 2020 & 2033
- Table 14: Global Industrial Radiography Equipment Industry Volume K Unit Forecast, by Technology 2020 & 2033
- Table 15: Global Industrial Radiography Equipment Industry Revenue billion Forecast, by End-User Industry 2020 & 2033
- Table 16: Global Industrial Radiography Equipment Industry Volume K Unit Forecast, by End-User Industry 2020 & 2033
- Table 17: Global Industrial Radiography Equipment Industry Revenue billion Forecast, by Country 2020 & 2033
- Table 18: Global Industrial Radiography Equipment Industry Volume K Unit Forecast, by Country 2020 & 2033
- Table 19: Global Industrial Radiography Equipment Industry Revenue billion Forecast, by Technology 2020 & 2033
- Table 20: Global Industrial Radiography Equipment Industry Volume K Unit Forecast, by Technology 2020 & 2033
- Table 21: Global Industrial Radiography Equipment Industry Revenue billion Forecast, by End-User Industry 2020 & 2033
- Table 22: Global Industrial Radiography Equipment Industry Volume K Unit Forecast, by End-User Industry 2020 & 2033
- Table 23: Global Industrial Radiography Equipment Industry Revenue billion Forecast, by Country 2020 & 2033
- Table 24: Global Industrial Radiography Equipment Industry Volume K Unit Forecast, by Country 2020 & 2033
- Table 25: Global Industrial Radiography Equipment Industry Revenue billion Forecast, by Technology 2020 & 2033
- Table 26: Global Industrial Radiography Equipment Industry Volume K Unit Forecast, by Technology 2020 & 2033
- Table 27: Global Industrial Radiography Equipment Industry Revenue billion Forecast, by End-User Industry 2020 & 2033
- Table 28: Global Industrial Radiography Equipment Industry Volume K Unit Forecast, by End-User Industry 2020 & 2033
- Table 29: Global Industrial Radiography Equipment Industry Revenue billion Forecast, by Country 2020 & 2033
- Table 30: Global Industrial Radiography Equipment Industry Volume K Unit Forecast, by Country 2020 & 2033
- Table 31: Global Industrial Radiography Equipment Industry Revenue billion Forecast, by Technology 2020 & 2033
- Table 32: Global Industrial Radiography Equipment Industry Volume K Unit Forecast, by Technology 2020 & 2033
- Table 33: Global Industrial Radiography Equipment Industry Revenue billion Forecast, by End-User Industry 2020 & 2033
- Table 34: Global Industrial Radiography Equipment Industry Volume K Unit Forecast, by End-User Industry 2020 & 2033
- Table 35: Global Industrial Radiography Equipment Industry Revenue billion Forecast, by Country 2020 & 2033
- Table 36: Global Industrial Radiography Equipment Industry Volume K Unit Forecast, by Country 2020 & 2033
- Table 37: Global Industrial Radiography Equipment Industry Revenue billion Forecast, by Technology 2020 & 2033
- Table 38: Global Industrial Radiography Equipment Industry Volume K Unit Forecast, by Technology 2020 & 2033
- Table 39: Global Industrial Radiography Equipment Industry Revenue billion Forecast, by End-User Industry 2020 & 2033
- Table 40: Global Industrial Radiography Equipment Industry Volume K Unit Forecast, by End-User Industry 2020 & 2033
- Table 41: Global Industrial Radiography Equipment Industry Revenue billion Forecast, by Country 2020 & 2033
- Table 42: Global Industrial Radiography Equipment Industry Volume K Unit Forecast, by Country 2020 & 2033
Frequently Asked Questions
1. What is the projected Compound Annual Growth Rate (CAGR) of the Industrial Radiography Equipment Industry?
The projected CAGR is approximately 8.6%.
2. Which companies are prominent players in the Industrial Radiography Equipment Industry?
Key companies in the market include L3Harris Technologies Inc, Baker Hughes, Vidisco Ltd (Aran Electronics Ltd ), Hitachi Ltd, Comet Holding AG, Canon Medical Systems Corporation (Canon Inc ), Rigaku Corporation (Carlyle Group), North Star Imaging Inc, Carestream Health, Carl Zeiss AG, Evident Corporation (Bain Capital), Hamamatsu Photonics K K, Durr NDT GmbH & Co Kg, Teledyne Dalsa Inc (Teledyne Technologies), Fujifilm Corporation (Fujifilm Holdings Corporation), Nikon Metrology NV (Nikon Corporation).
3. What are the main segments of the Industrial Radiography Equipment Industry?
The market segments include Technology, End-User Industry.
4. Can you provide details about the market size?
The market size is estimated to be USD 1.35 billion as of 2022.
5. What are some drivers contributing to market growth?
Rising Demand From Automotive and Aerospace Industry; Augmented Accuracy of Inspection With the Integration of Advanced Software.
6. What are the notable trends driving market growth?
Aerospace and Defense to be the Largest End User.
7. Are there any restraints impacting market growth?
High Risk of Radiation Since it uses Gamma Rays. X-Rays; High Deployment Costs.
8. Can you provide examples of recent developments in the market?
July 2023: Canon Inc. launched the Zexirai9 digital X-ray RF system, a multi-purpose fluoroscopic table with many new functions and a compact design. Zexirai9 is a new digital X-ray RF system equipped with Canon's flat panel detector (FPD) and a newly developed image processing technology; the system has been developed in consultation with medical staff, referring physicians, and engineers.
9. What pricing options are available for accessing the report?
Pricing options include single-user, multi-user, and enterprise licenses priced at USD 4750, USD 5250, and USD 8750 respectively.
10. Is the market size provided in terms of value or volume?
The market size is provided in terms of value, measured in billion and volume, measured in K Unit.
11. Are there any specific market keywords associated with the report?
Yes, the market keyword associated with the report is "Industrial Radiography Equipment Industry," which aids in identifying and referencing the specific market segment covered.
12. How do I determine which pricing option suits my needs best?
The pricing options vary based on user requirements and access needs. Individual users may opt for single-user licenses, while businesses requiring broader access may choose multi-user or enterprise licenses for cost-effective access to the report.
13. Are there any additional resources or data provided in the Industrial Radiography Equipment Industry report?
While the report offers comprehensive insights, it's advisable to review the specific contents or supplementary materials provided to ascertain if additional resources or data are available.
14. How can I stay updated on further developments or reports in the Industrial Radiography Equipment Industry?
To stay informed about further developments, trends, and reports in the Industrial Radiography Equipment Industry, consider subscribing to industry newsletters, following relevant companies and organizations, or regularly checking reputable industry news sources and publications.
Methodology
Step 1 - Identification of Relevant Samples Size from Population Database


Step 2 - Approaches for Defining Global Market Size (Value, Volume* & Price*)

Note*: In applicable scenarios
Step 3 - Data Sources
Primary Research
- Web Analytics
- Survey Reports
- Research Institute
- Latest Research Reports
- Opinion Leaders
Secondary Research
- Annual Reports
- White Paper
- Latest Press Release
- Industry Association
- Paid Database
- Investor Presentations

Step 4 - Data Triangulation
Involves using different sources of information in order to increase the validity of a study
These sources are likely to be stakeholders in a program - participants, other researchers, program staff, other community members, and so on.
Then we put all data in single framework & apply various statistical tools to find out the dynamic on the market.
During the analysis stage, feedback from the stakeholder groups would be compared to determine areas of agreement as well as areas of divergence