

Key Insights
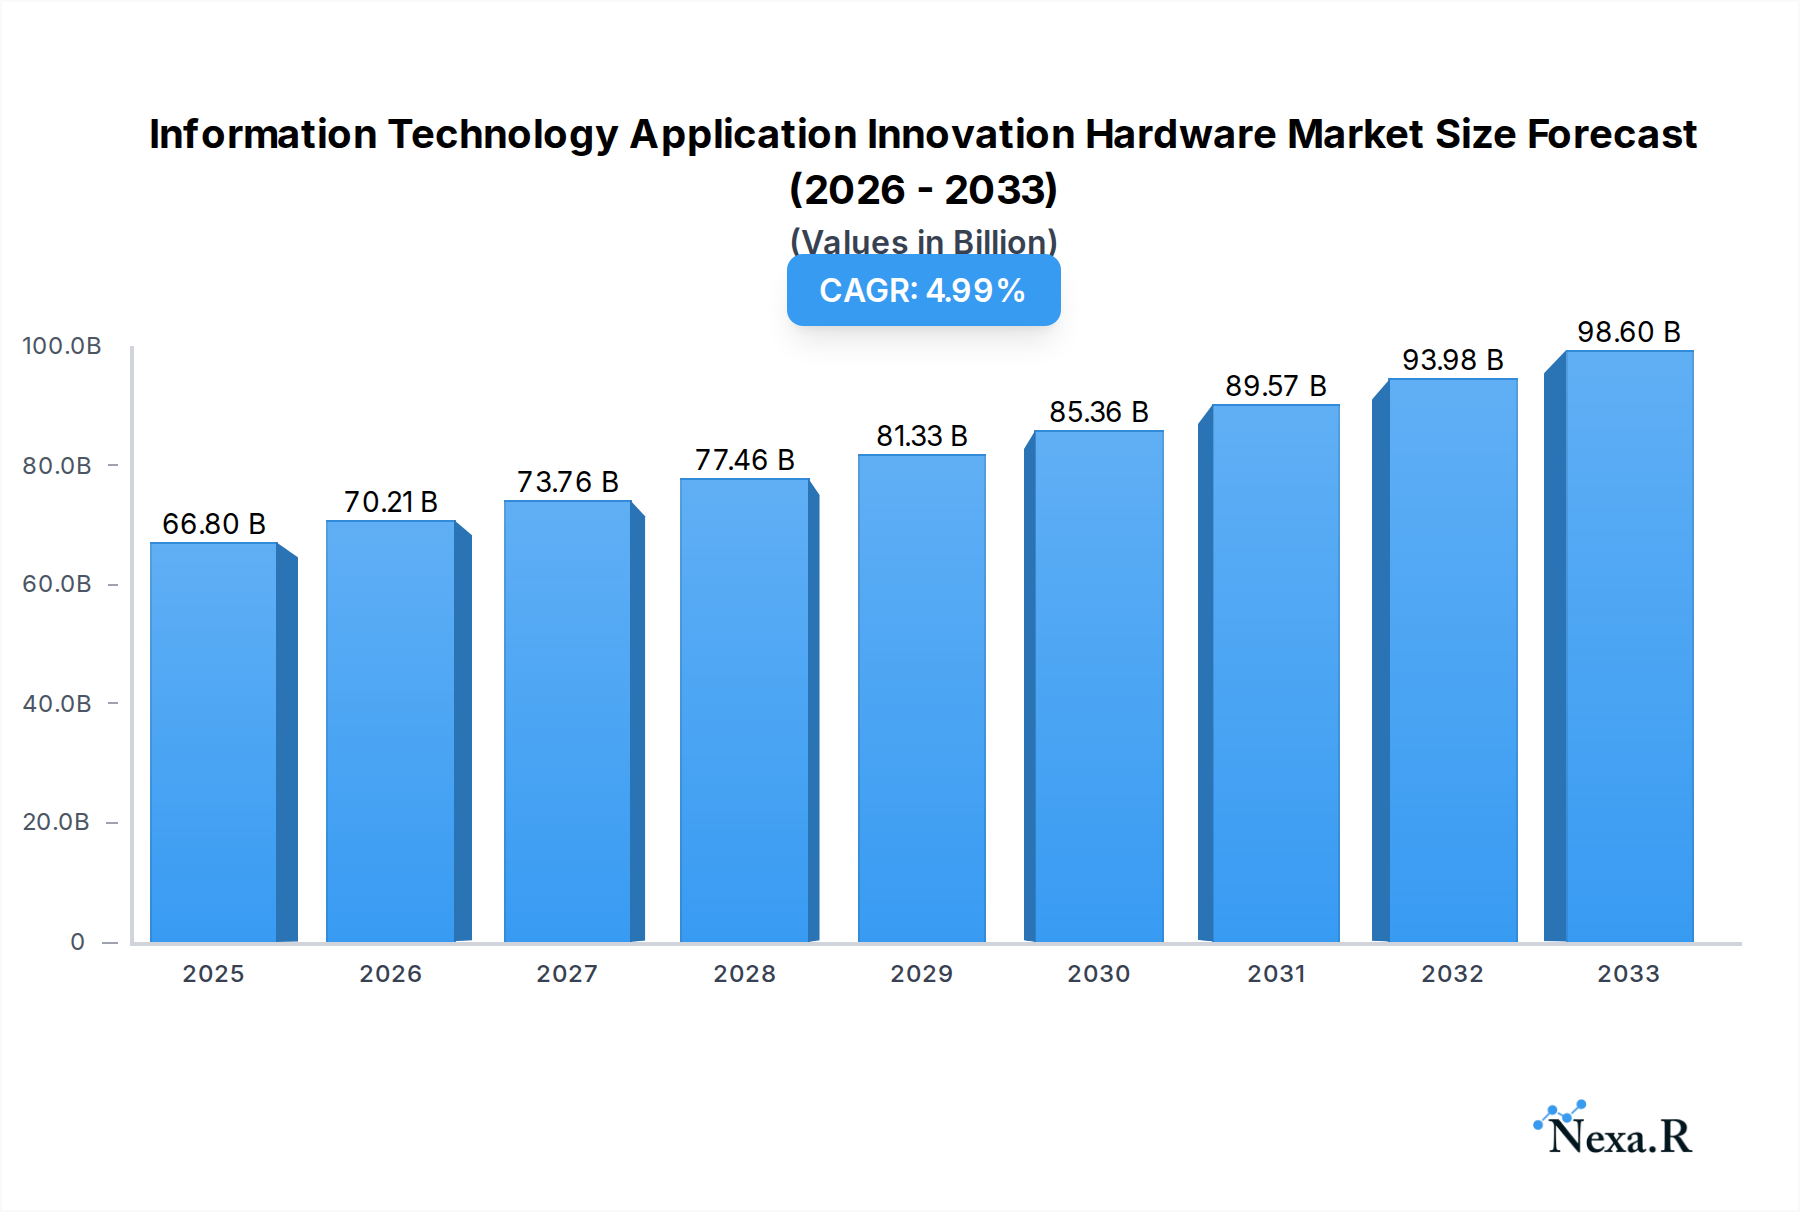
The Information Technology Application Innovation Hardware market is poised for substantial growth, projected to reach an estimated $66.8 billion in 2025. This expansion is fueled by a robust Compound Annual Growth Rate (CAGR) of 5.2% anticipated over the forecast period. This upward trajectory is primarily driven by the increasing demand for advanced computing power across various sectors, including smart government initiatives, stringent information security requirements, and the pervasive digitalization of industries. The ongoing digital industrialization and the development of novel applications are creating a significant need for high-performance CPUs, robust servers, and advanced storage solutions. Companies are investing heavily in upgrading their IT infrastructure to support the growing complexities of data processing, artificial intelligence, and cloud computing, all of which rely on innovative hardware. This escalating demand for performance and efficiency underscores the critical role of application innovation hardware in shaping the future of technology and business operations globally.

Information Technology Application Innovation Hardware Market Size (In Billion)
Key trends shaping this market include the continuous miniaturization and increased power efficiency of processors, advancements in solid-state storage technologies, and the integration of specialized hardware accelerators for AI and machine learning workloads. The rise of edge computing also necessitates innovative hardware solutions that can operate efficiently in distributed environments. However, the market faces certain restraints, including the high cost of advanced hardware components and the ongoing global semiconductor supply chain challenges, which can impact production volumes and lead times. Despite these hurdles, the overwhelming demand from burgeoning sectors and the relentless pace of technological advancement are expected to propel the Information Technology Application Innovation Hardware market forward. The competitive landscape features established global players alongside emerging regional innovators, particularly in Asia Pacific, highlighting a dynamic and evolving market environment.
Information Technology Application Innovation Hardware Company Market Share
Information Technology Application Innovation Hardware Market Dynamics & Structure
The Information Technology Application Innovation Hardware market is characterized by a dynamic and evolving structure, driven by relentless technological advancements and increasing demand for sophisticated digital solutions. Market concentration varies across different segments, with the CPU market exhibiting a moderate level of concentration due to the dominance of a few major players like Intel and AMD, alongside emerging domestic contenders such as Phytium Technology and Hygon. The server and storage device segments, however, show a more fragmented landscape with a wider array of global and regional providers, including HP, Dell, IBM, Oracle, Fujitsu, Cisco, NEC, SGI, and Lenovo, alongside significant Chinese entities like Inspur Electronic Information Industry and Dawning Information Industry.
Technological innovation is the primary driver, fueled by the pursuit of higher processing power, enhanced energy efficiency, and advanced functionalities for applications ranging from Smart Government Affairs and Information Security to Industry Digitalization and Digital Industrialization. The continuous evolution of AI, IoT, and 5G necessitates hardware capable of handling massive data volumes and complex computations. Regulatory frameworks, particularly in regions like China, are increasingly influencing market dynamics, with policies often promoting domestic technological self-sufficiency and setting standards for performance and security.
Competitive product substitutes are emerging, particularly in specialized areas, challenging established hardware manufacturers. For instance, specialized ASICs are being developed for specific AI workloads, offering performance advantages over general-purpose CPUs. End-user demographics are shifting towards enterprises and governments demanding more robust, secure, and scalable IT infrastructure. Mergers and acquisitions (M&A) trends are significant, with major players actively acquiring innovative startups or consolidating to gain market share and technological prowess. For example, the historical period (2019-2024) saw several strategic acquisitions aimed at bolstering AI capabilities and expanding product portfolios, with an estimated XX M&A deals in billions. The interplay of these factors creates a competitive yet innovation-rich environment.
- Market Concentration: Moderate in CPUs, fragmented in Servers and Storage.
- Innovation Drivers: AI, IoT, 5G, demand for higher performance and efficiency.
- Regulatory Frameworks: Influencing domestic production and security standards, especially in China.
- Competitive Substitutes: Specialized ASICs, cloud-based hardware solutions.
- End-User Demographics: Growing demand from enterprises and governments.
- M&A Trends: Strategic acquisitions for technological advancement and market consolidation.
Information Technology Application Innovation Hardware Growth Trends & Insights
The Information Technology Application Innovation Hardware market is poised for substantial growth, driven by an unprecedented surge in digital transformation initiatives across all sectors. The market size evolution is projected to witness a significant upward trajectory, expanding from approximately $XXX billion in the historical period (2019-2024) to an estimated $XXX billion by 2033. This expansion is underpinned by escalating adoption rates of advanced hardware solutions essential for enabling cutting-edge applications. Technological disruptions, such as the advent of specialized AI accelerators and the increasing demand for high-performance computing (HPC) in research and development, are fundamentally reshaping the market. The continuous push for greater processing power, reduced latency, and enhanced energy efficiency is driving innovation in CPU architecture, server design, and storage technologies.
Consumer behavior shifts, particularly in the enterprise realm, are characterized by an increasing reliance on cloud-native infrastructure, edge computing, and the integration of intelligent automation. This necessitates hardware that can support these distributed and data-intensive environments. The penetration of digital industrialization initiatives globally is a key growth catalyst, with industries leveraging advanced hardware for smart manufacturing, predictive maintenance, and supply chain optimization. Similarly, the drive towards Smart Government Affairs and enhanced Information Security is creating significant demand for secure, high-capacity, and resilient IT infrastructure. The base year of 2025, valued at an estimated $XXX billion, serves as a critical reference point for understanding the ongoing momentum. The Compound Annual Growth Rate (CAGR) for the forecast period (2025–2033) is conservatively estimated at XX%, reflecting the robust demand and ongoing technological advancements.
The integration of technologies like quantum computing, although in its nascent stages, represents a future frontier that will undoubtedly spur further hardware innovation. The growing importance of data analytics and machine learning in decision-making across businesses and governments is a constant impetus for more powerful and efficient hardware. The market's trajectory is also influenced by the increasing adoption of heterogeneous computing, where different types of processors (CPUs, GPUs, TPUs) are combined to optimize performance for specific workloads. This trend fuels demand for versatile hardware platforms capable of supporting diverse processing needs. Furthermore, the global emphasis on digital resilience and cybersecurity mandates hardware solutions with built-in security features and advanced threat detection capabilities, contributing to a sustained demand for innovation and upgrades. The market is not merely about incremental improvements but about transformative shifts driven by the ever-expanding scope of digital applications and the fundamental need for more sophisticated and capable computing hardware.
Dominant Regions, Countries, or Segments in Information Technology Application Innovation Hardware
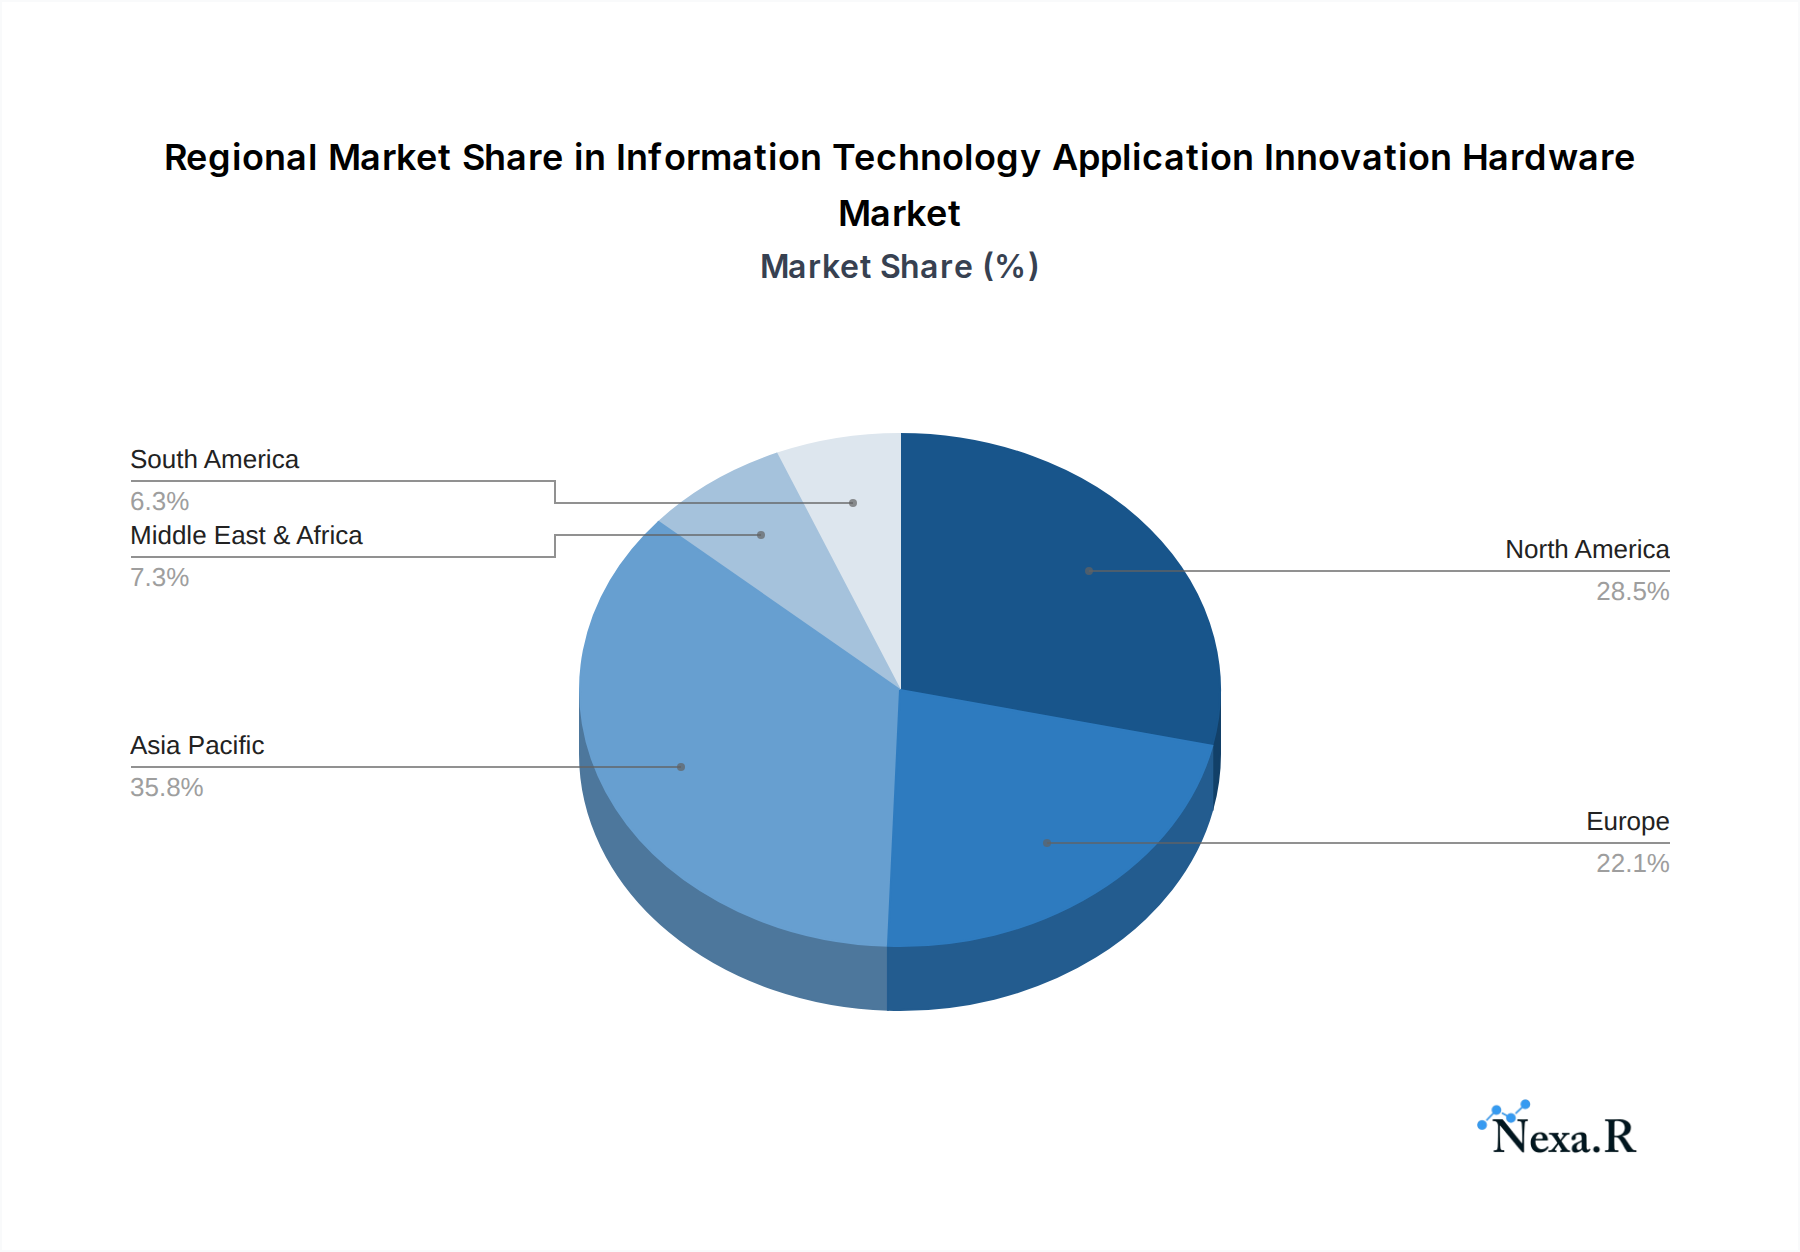
North America, particularly the United States, is emerging as a dominant region in the Information Technology Application Innovation Hardware market, driven by its robust ecosystem of technology giants, extensive research and development capabilities, and significant investments in digital transformation across both government and private sectors. The region's leadership is particularly pronounced in the CPU segment, with companies like Intel and AMD at the forefront of innovation, pushing the boundaries of performance and efficiency. The widespread adoption of advanced computing in sectors such as cloud computing, artificial intelligence, and big data analytics fuels the demand for high-performance CPUs. Furthermore, the strong presence of leading server manufacturers like HP, Dell, and IBM solidifies North America's dominance in the Servers segment.
Key drivers for this dominance include substantial government funding for R&D, a highly skilled workforce, and a conducive regulatory environment that fosters technological innovation. The proliferation of data centers and the increasing demand for sophisticated IT infrastructure to support emerging applications like autonomous vehicles and advanced cybersecurity solutions further bolster the region's market share. The United States' leadership in areas such as AI development and its strategic focus on maintaining a competitive edge in semiconductor manufacturing are critical factors.
In terms of Application, Industry Digitalization is a primary growth driver across all major regions, but its advanced implementation and early adoption in North America contribute significantly to its dominance. This includes the widespread integration of IoT, AI, and advanced analytics in manufacturing, healthcare, and logistics, all requiring cutting-edge hardware. The Information Security segment also sees substantial investment and innovation, driven by the increasing sophistication of cyber threats and the need for robust hardware-based security solutions. Countries within North America are leading in the development of secure enclaves, hardware root of trust technologies, and advanced encryption capabilities.
China, on the other hand, is rapidly asserting its influence, particularly in the CPU segment with companies like Phytium Technology, Hygon, and Zhaoxin, supported by strong government initiatives and a massive domestic market. Their focus on indigenous innovation and reducing reliance on foreign technology is a significant factor in their growth. The Servers and Storage Devices segments in China are also experiencing rapid expansion, with players like Inspur Electronic Information Industry, Dawning Information Industry, and Lenovo contributing significantly. The Chinese market's sheer size and the government's aggressive push for digital industrialization and smart government affairs are creating immense opportunities.
The dominance factors in North America include:
- High R&D Expenditure: Significant investments by leading tech companies and research institutions.
- Strong Venture Capital Ecosystem: Facilitating innovation and startup growth.
- Advanced Infrastructure: Widespread availability of high-speed networks and data centers.
- Demand for Cutting-Edge Technologies: Early adoption of AI, IoT, and cloud solutions.
- Government Support: Funding for research and initiatives in critical technology sectors.
Information Technology Application Innovation Hardware Product Landscape
The product landscape for Information Technology Application Innovation Hardware is defined by continuous advancements in performance, efficiency, and specialized capabilities. CPUs are evolving with increased core counts, higher clock speeds, and integrated AI acceleration features, exemplified by Intel's latest architectures and AMD's Ryzen and EPYC processors, as well as emerging domestic CPUs from Phytium and Hygon designed for specific national initiatives. Server hardware is becoming more modular, scalable, and power-efficient, accommodating dense computing needs for AI workloads and large-scale data processing, with innovations from HP, Dell, and IBM. Storage devices are witnessing a paradigm shift towards NVMe SSDs, petabyte-scale solutions, and intelligent storage management, enhancing data access speeds and capacity for applications like smart government affairs and industry digitalization. Specialty hardware, including AI accelerators from Broadcom Corporation and specialized computing platforms from Institute of Computing Technology, Chinese Academy of Sciences, are catering to niche but high-growth application demands.
Key Drivers, Barriers & Challenges in Information Technology Application Innovation Hardware
The Information Technology Application Innovation Hardware market is propelled by several key drivers. The relentless demand for higher processing power to fuel advancements in Artificial Intelligence, Machine Learning, and Big Data analytics is a primary catalyst. The global push for digital transformation across industries, from manufacturing to healthcare, necessitates robust and innovative hardware solutions. Furthermore, the expansion of 5G infrastructure and the proliferation of IoT devices are creating new opportunities for specialized hardware designed for edge computing and enhanced connectivity. Government initiatives promoting indigenous technology development and cybersecurity are also significant drivers.
However, the market faces considerable barriers and challenges. The intricate and often lengthy semiconductor manufacturing process, coupled with supply chain vulnerabilities, presents a significant hurdle, as evidenced by recent global chip shortages. The high cost of research and development for cutting-edge hardware, particularly in areas like advanced chip design and manufacturing, can be a deterrent for smaller players. Intense competition from established giants and the rapid pace of technological obsolescence also pose challenges. Regulatory complexities and trade restrictions, especially in the geopolitical landscape, can impact market access and collaboration. Overcoming these challenges requires strategic investment, innovation in manufacturing processes, and resilient supply chain management.
Emerging Opportunities in Information Technology Application Innovation Hardware
Emerging opportunities in the Information Technology Application Innovation Hardware sector are abundant, driven by the expanding frontiers of digital technology. The growth of the metaverse and augmented reality (AR)/virtual reality (VR) applications presents a substantial demand for specialized, high-performance processors and graphics hardware capable of delivering immersive experiences. The ongoing advancements in quantum computing, while still nascent, promise a future where entirely new categories of hardware will be required for complex problem-solving. Furthermore, the increasing focus on sustainable technology and energy-efficient computing offers opportunities for hardware manufacturers to develop eco-friendly solutions that reduce power consumption and environmental impact. The continuous evolution of edge computing, driven by the need for real-time data processing closer to the source, opens avenues for compact, powerful, and specialized edge devices and accelerators.
Growth Accelerators in the Information Technology Application Innovation Hardware Industry
Several factors are acting as significant growth accelerators within the Information Technology Application Innovation Hardware industry. The pervasive adoption of Artificial Intelligence and Machine Learning across virtually every sector is a primary catalyst, driving demand for specialized hardware like AI accelerators and high-performance CPUs. The global rollout of 5G networks is another major accelerator, enabling a new wave of connected devices and applications that require sophisticated edge computing hardware and low-latency processing capabilities. Strategic partnerships between chip manufacturers, cloud providers, and application developers are fostering co-innovation and accelerating the deployment of optimized hardware solutions. Moreover, government investments in digital infrastructure and national technology initiatives, particularly in areas like smart cities and industrial automation, are creating substantial market opportunities and driving demand for advanced hardware.
Key Players Shaping the Information Technology Application Innovation Hardware Market
- Intel
- AMD
- Phytium Technology
- Apple
- Samsung
- Huawei
- Broadcom Corporation
- Institute of Computing Technology, Chinese Academy of Sciences
- Hygon
- Zhaoxin
- Jiangnan Institute of Computing Technology
- Inspur Electronic Information Industry
- Jiangsu Ruiji Boyun Network Technology Group
- Dawning Information Industry
- Digital China Group
- DHC Software
- Unisplendour Corporation
- ArcherMind Technology
- China National Software and Service Company Limited
- NavInfo
- Tongfang Youyun Technology
- HP
- Dell
- IBM
- Oracle
- Fujitsu
- Cisco
- NEC
- SGI
- Lenovo
Notable Milestones in Information Technology Application Innovation Hardware Sector
- 2019: Launch of Intel's 10th Gen Core processors, enhancing integrated graphics and AI capabilities.
- 2019: AMD's EPYC Rome processors set new benchmarks for server performance.
- 2020: Apple's M1 chip debut, marking a significant shift towards in-house ARM-based silicon for its Mac lineup.
- 2020: Phytium Technology's Dhyana series processors gain traction in the Chinese market, emphasizing domestic innovation.
- 2021: Nvidia's Ampere architecture GPUs continue to dominate the AI and HPC markets.
- 2021: Samsung's advancements in HBM (High Bandwidth Memory) for high-performance computing.
- 2022: Intel announces its ambitious "IDM 2.0" strategy, focusing on foundry services and next-generation manufacturing.
- 2022: Hygon Technology launches its new generation of CPUs targeting server and enterprise applications.
- 2023: Continued growth in specialized AI accelerator market with new offerings from Broadcom and other players.
- 2023: Increased focus on sustainable hardware solutions with improved power efficiency from major vendors.
- 2024: Further integration of AI capabilities into mainstream CPUs and server platforms.
- 2024: Advancements in liquid cooling technologies for high-density server deployments.
- 2025: Anticipated release of next-generation CPUs with significantly enhanced performance and efficiency.
- 2025: Continued expansion of the high-performance computing market driven by scientific research and AI development.
In-Depth Information Technology Application Innovation Hardware Market Outlook
The Information Technology Application Innovation Hardware market outlook remains exceptionally strong, fueled by the foundational role of advanced hardware in enabling global digital transformation and technological advancement. Growth accelerators such as the escalating demand for AI/ML processing power, the pervasive expansion of 5G and IoT ecosystems, and strategic government investments in digital infrastructure will continue to drive market expansion. Strategic partnerships and co-innovation will foster accelerated development and deployment of optimized hardware solutions across various application segments, including Smart Government Affairs, Information Security, Industry Digitalization, and Digital Industrialization. The sustained focus on enhancing processing capabilities, improving energy efficiency, and ensuring robust security will define the product innovation roadmap. This creates a fertile ground for both established players and emerging innovators to capture significant market share and contribute to the evolution of computing.
Information Technology Application Innovation Hardware Segmentation
-
1. Application
- 1.1. Smart Government Affairs
- 1.2. Information Security
- 1.3. Industry Digitalization
- 1.4. Digital Industrialization
- 1.5. Others
-
2. Type
- 2.1. CPU
- 2.2. Servers
- 2.3. Storage Devices
- 2.4. Others
Information Technology Application Innovation Hardware Segmentation By Geography
-
1. North America
- 1.1. United States
- 1.2. Canada
- 1.3. Mexico
-
2. South America
- 2.1. Brazil
- 2.2. Argentina
- 2.3. Rest of South America
-
3. Europe
- 3.1. United Kingdom
- 3.2. Germany
- 3.3. France
- 3.4. Italy
- 3.5. Spain
- 3.6. Russia
- 3.7. Benelux
- 3.8. Nordics
- 3.9. Rest of Europe
-
4. Middle East & Africa
- 4.1. Turkey
- 4.2. Israel
- 4.3. GCC
- 4.4. North Africa
- 4.5. South Africa
- 4.6. Rest of Middle East & Africa
-
5. Asia Pacific
- 5.1. China
- 5.2. India
- 5.3. Japan
- 5.4. South Korea
- 5.5. ASEAN
- 5.6. Oceania
- 5.7. Rest of Asia Pacific
Information Technology Application Innovation Hardware Regional Market Share
Geographic Coverage of Information Technology Application Innovation Hardware
Information Technology Application Innovation Hardware REPORT HIGHLIGHTS
| Aspects | Details |
|---|---|
| Study Period | 2020-2034 |
| Base Year | 2025 |
| Estimated Year | 2026 |
| Forecast Period | 2026-2034 |
| Historical Period | 2020-2025 |
| Growth Rate | CAGR of 5.2% from 2020-2034 |
| Segmentation |
|
Table of Contents
- 1. Introduction
- 1.1. Research Scope
- 1.2. Market Segmentation
- 1.3. Research Objective
- 1.4. Definitions and Assumptions
- 2. Executive Summary
- 2.1. Market Snapshot
- 3. Market Dynamics
- 3.1. Market Drivers
- 3.2. Market Restrains
- 3.3. Market Trends
- 3.4. Market Opportunities
- 4. Market Factor Analysis
- 4.1. Porters Five Forces
- 4.1.1. Bargaining Power of Suppliers
- 4.1.2. Bargaining Power of Buyers
- 4.1.3. Threat of New Entrants
- 4.1.4. Threat of Substitutes
- 4.1.5. Competitive Rivalry
- 4.2. PESTEL analysis
- 4.3. BCG Analysis
- 4.3.1. Stars (High Growth, High Market Share)
- 4.3.2. Cash Cows (Low Growth, High Market Share)
- 4.3.3. Question Mark (High Growth, Low Market Share)
- 4.3.4. Dogs (Low Growth, Low Market Share)
- 4.4. Ansoff Matrix Analysis
- 4.5. Supply Chain Analysis
- 4.6. Regulatory Landscape
- 4.7. Current Market Potential and Opportunity Assessment (TAM–SAM–SOM Framework)
- 4.8. NRP Analyst Note
- 4.1. Porters Five Forces
- 5. Market Analysis, Insights and Forecast 2021-2033
- 5.1. Market Analysis, Insights and Forecast - by Application
- 5.1.1. Smart Government Affairs
- 5.1.2. Information Security
- 5.1.3. Industry Digitalization
- 5.1.4. Digital Industrialization
- 5.1.5. Others
- 5.2. Market Analysis, Insights and Forecast - by Type
- 5.2.1. CPU
- 5.2.2. Servers
- 5.2.3. Storage Devices
- 5.2.4. Others
- 5.3. Market Analysis, Insights and Forecast - by Region
- 5.3.1. North America
- 5.3.2. South America
- 5.3.3. Europe
- 5.3.4. Middle East & Africa
- 5.3.5. Asia Pacific
- 5.1. Market Analysis, Insights and Forecast - by Application
- 6. Global Information Technology Application Innovation Hardware Analysis, Insights and Forecast, 2021-2033
- 6.1. Market Analysis, Insights and Forecast - by Application
- 6.1.1. Smart Government Affairs
- 6.1.2. Information Security
- 6.1.3. Industry Digitalization
- 6.1.4. Digital Industrialization
- 6.1.5. Others
- 6.2. Market Analysis, Insights and Forecast - by Type
- 6.2.1. CPU
- 6.2.2. Servers
- 6.2.3. Storage Devices
- 6.2.4. Others
- 6.1. Market Analysis, Insights and Forecast - by Application
- 7. North America Information Technology Application Innovation Hardware Analysis, Insights and Forecast, 2020-2032
- 7.1. Market Analysis, Insights and Forecast - by Application
- 7.1.1. Smart Government Affairs
- 7.1.2. Information Security
- 7.1.3. Industry Digitalization
- 7.1.4. Digital Industrialization
- 7.1.5. Others
- 7.2. Market Analysis, Insights and Forecast - by Type
- 7.2.1. CPU
- 7.2.2. Servers
- 7.2.3. Storage Devices
- 7.2.4. Others
- 7.1. Market Analysis, Insights and Forecast - by Application
- 8. South America Information Technology Application Innovation Hardware Analysis, Insights and Forecast, 2020-2032
- 8.1. Market Analysis, Insights and Forecast - by Application
- 8.1.1. Smart Government Affairs
- 8.1.2. Information Security
- 8.1.3. Industry Digitalization
- 8.1.4. Digital Industrialization
- 8.1.5. Others
- 8.2. Market Analysis, Insights and Forecast - by Type
- 8.2.1. CPU
- 8.2.2. Servers
- 8.2.3. Storage Devices
- 8.2.4. Others
- 8.1. Market Analysis, Insights and Forecast - by Application
- 9. Europe Information Technology Application Innovation Hardware Analysis, Insights and Forecast, 2020-2032
- 9.1. Market Analysis, Insights and Forecast - by Application
- 9.1.1. Smart Government Affairs
- 9.1.2. Information Security
- 9.1.3. Industry Digitalization
- 9.1.4. Digital Industrialization
- 9.1.5. Others
- 9.2. Market Analysis, Insights and Forecast - by Type
- 9.2.1. CPU
- 9.2.2. Servers
- 9.2.3. Storage Devices
- 9.2.4. Others
- 9.1. Market Analysis, Insights and Forecast - by Application
- 10. Middle East & Africa Information Technology Application Innovation Hardware Analysis, Insights and Forecast, 2020-2032
- 10.1. Market Analysis, Insights and Forecast - by Application
- 10.1.1. Smart Government Affairs
- 10.1.2. Information Security
- 10.1.3. Industry Digitalization
- 10.1.4. Digital Industrialization
- 10.1.5. Others
- 10.2. Market Analysis, Insights and Forecast - by Type
- 10.2.1. CPU
- 10.2.2. Servers
- 10.2.3. Storage Devices
- 10.2.4. Others
- 10.1. Market Analysis, Insights and Forecast - by Application
- 11. Asia Pacific Information Technology Application Innovation Hardware Analysis, Insights and Forecast, 2020-2032
- 11.1. Market Analysis, Insights and Forecast - by Application
- 11.1.1. Smart Government Affairs
- 11.1.2. Information Security
- 11.1.3. Industry Digitalization
- 11.1.4. Digital Industrialization
- 11.1.5. Others
- 11.2. Market Analysis, Insights and Forecast - by Type
- 11.2.1. CPU
- 11.2.2. Servers
- 11.2.3. Storage Devices
- 11.2.4. Others
- 11.1. Market Analysis, Insights and Forecast - by Application
- 12. Competitive Analysis
- 12.1. Company Profiles
- 12.1.1 Intel
- 12.1.1.1. Company Overview
- 12.1.1.2. Products
- 12.1.1.3. Company Financials
- 12.1.1.4. SWOT Analysis
- 12.1.2 AMD
- 12.1.2.1. Company Overview
- 12.1.2.2. Products
- 12.1.2.3. Company Financials
- 12.1.2.4. SWOT Analysis
- 12.1.3 Phytium Technology
- 12.1.3.1. Company Overview
- 12.1.3.2. Products
- 12.1.3.3. Company Financials
- 12.1.3.4. SWOT Analysis
- 12.1.4 Apple
- 12.1.4.1. Company Overview
- 12.1.4.2. Products
- 12.1.4.3. Company Financials
- 12.1.4.4. SWOT Analysis
- 12.1.5 Samsung
- 12.1.5.1. Company Overview
- 12.1.5.2. Products
- 12.1.5.3. Company Financials
- 12.1.5.4. SWOT Analysis
- 12.1.6 Huawei
- 12.1.6.1. Company Overview
- 12.1.6.2. Products
- 12.1.6.3. Company Financials
- 12.1.6.4. SWOT Analysis
- 12.1.7 Broadcom Corporation
- 12.1.7.1. Company Overview
- 12.1.7.2. Products
- 12.1.7.3. Company Financials
- 12.1.7.4. SWOT Analysis
- 12.1.8 Institute of Computing Technology Chinese Academy of Sciences
- 12.1.8.1. Company Overview
- 12.1.8.2. Products
- 12.1.8.3. Company Financials
- 12.1.8.4. SWOT Analysis
- 12.1.9 Hygon
- 12.1.9.1. Company Overview
- 12.1.9.2. Products
- 12.1.9.3. Company Financials
- 12.1.9.4. SWOT Analysis
- 12.1.10 Zhaoxin
- 12.1.10.1. Company Overview
- 12.1.10.2. Products
- 12.1.10.3. Company Financials
- 12.1.10.4. SWOT Analysis
- 12.1.11 Jiangnan Institute of Computing Technology
- 12.1.11.1. Company Overview
- 12.1.11.2. Products
- 12.1.11.3. Company Financials
- 12.1.11.4. SWOT Analysis
- 12.1.12 Inspur Electronic Information Industry
- 12.1.12.1. Company Overview
- 12.1.12.2. Products
- 12.1.12.3. Company Financials
- 12.1.12.4. SWOT Analysis
- 12.1.13 Jiangsu Ruiji Boyun Network Technology Group
- 12.1.13.1. Company Overview
- 12.1.13.2. Products
- 12.1.13.3. Company Financials
- 12.1.13.4. SWOT Analysis
- 12.1.14 Dawning Information Industry
- 12.1.14.1. Company Overview
- 12.1.14.2. Products
- 12.1.14.3. Company Financials
- 12.1.14.4. SWOT Analysis
- 12.1.15 Digital China Group
- 12.1.15.1. Company Overview
- 12.1.15.2. Products
- 12.1.15.3. Company Financials
- 12.1.15.4. SWOT Analysis
- 12.1.16 DHC Software
- 12.1.16.1. Company Overview
- 12.1.16.2. Products
- 12.1.16.3. Company Financials
- 12.1.16.4. SWOT Analysis
- 12.1.17 Unisplendour Corporation
- 12.1.17.1. Company Overview
- 12.1.17.2. Products
- 12.1.17.3. Company Financials
- 12.1.17.4. SWOT Analysis
- 12.1.18 ArcherMind Technology
- 12.1.18.1. Company Overview
- 12.1.18.2. Products
- 12.1.18.3. Company Financials
- 12.1.18.4. SWOT Analysis
- 12.1.19 China National Software and Service Company Limited
- 12.1.19.1. Company Overview
- 12.1.19.2. Products
- 12.1.19.3. Company Financials
- 12.1.19.4. SWOT Analysis
- 12.1.20 NavInfo
- 12.1.20.1. Company Overview
- 12.1.20.2. Products
- 12.1.20.3. Company Financials
- 12.1.20.4. SWOT Analysis
- 12.1.21 Tongfang Youyun Technology
- 12.1.21.1. Company Overview
- 12.1.21.2. Products
- 12.1.21.3. Company Financials
- 12.1.21.4. SWOT Analysis
- 12.1.22 HP
- 12.1.22.1. Company Overview
- 12.1.22.2. Products
- 12.1.22.3. Company Financials
- 12.1.22.4. SWOT Analysis
- 12.1.23 Dell
- 12.1.23.1. Company Overview
- 12.1.23.2. Products
- 12.1.23.3. Company Financials
- 12.1.23.4. SWOT Analysis
- 12.1.24 IBM
- 12.1.24.1. Company Overview
- 12.1.24.2. Products
- 12.1.24.3. Company Financials
- 12.1.24.4. SWOT Analysis
- 12.1.25 Oracle
- 12.1.25.1. Company Overview
- 12.1.25.2. Products
- 12.1.25.3. Company Financials
- 12.1.25.4. SWOT Analysis
- 12.1.26 Fujitsu
- 12.1.26.1. Company Overview
- 12.1.26.2. Products
- 12.1.26.3. Company Financials
- 12.1.26.4. SWOT Analysis
- 12.1.27 Cisco
- 12.1.27.1. Company Overview
- 12.1.27.2. Products
- 12.1.27.3. Company Financials
- 12.1.27.4. SWOT Analysis
- 12.1.28 NEC
- 12.1.28.1. Company Overview
- 12.1.28.2. Products
- 12.1.28.3. Company Financials
- 12.1.28.4. SWOT Analysis
- 12.1.29 SGI
- 12.1.29.1. Company Overview
- 12.1.29.2. Products
- 12.1.29.3. Company Financials
- 12.1.29.4. SWOT Analysis
- 12.1.30 Lenovo
- 12.1.30.1. Company Overview
- 12.1.30.2. Products
- 12.1.30.3. Company Financials
- 12.1.30.4. SWOT Analysis
- 12.1.1 Intel
- 12.2. Market Entropy
- 12.2.1 Company's Key Areas Served
- 12.2.2 Recent Developments
- 12.3. Company Market Share Analysis 2025
- 12.3.1 Top 5 Companies Market Share Analysis
- 12.3.2 Top 3 Companies Market Share Analysis
- 12.4. List of Potential Customers
- 13. Research Methodology
List of Figures
- Figure 1: Global Information Technology Application Innovation Hardware Revenue Breakdown (undefined, %) by Region 2025 & 2033
- Figure 2: Global Information Technology Application Innovation Hardware Volume Breakdown (K, %) by Region 2025 & 2033
- Figure 3: North America Information Technology Application Innovation Hardware Revenue (undefined), by Application 2025 & 2033
- Figure 4: North America Information Technology Application Innovation Hardware Volume (K), by Application 2025 & 2033
- Figure 5: North America Information Technology Application Innovation Hardware Revenue Share (%), by Application 2025 & 2033
- Figure 6: North America Information Technology Application Innovation Hardware Volume Share (%), by Application 2025 & 2033
- Figure 7: North America Information Technology Application Innovation Hardware Revenue (undefined), by Type 2025 & 2033
- Figure 8: North America Information Technology Application Innovation Hardware Volume (K), by Type 2025 & 2033
- Figure 9: North America Information Technology Application Innovation Hardware Revenue Share (%), by Type 2025 & 2033
- Figure 10: North America Information Technology Application Innovation Hardware Volume Share (%), by Type 2025 & 2033
- Figure 11: North America Information Technology Application Innovation Hardware Revenue (undefined), by Country 2025 & 2033
- Figure 12: North America Information Technology Application Innovation Hardware Volume (K), by Country 2025 & 2033
- Figure 13: North America Information Technology Application Innovation Hardware Revenue Share (%), by Country 2025 & 2033
- Figure 14: North America Information Technology Application Innovation Hardware Volume Share (%), by Country 2025 & 2033
- Figure 15: South America Information Technology Application Innovation Hardware Revenue (undefined), by Application 2025 & 2033
- Figure 16: South America Information Technology Application Innovation Hardware Volume (K), by Application 2025 & 2033
- Figure 17: South America Information Technology Application Innovation Hardware Revenue Share (%), by Application 2025 & 2033
- Figure 18: South America Information Technology Application Innovation Hardware Volume Share (%), by Application 2025 & 2033
- Figure 19: South America Information Technology Application Innovation Hardware Revenue (undefined), by Type 2025 & 2033
- Figure 20: South America Information Technology Application Innovation Hardware Volume (K), by Type 2025 & 2033
- Figure 21: South America Information Technology Application Innovation Hardware Revenue Share (%), by Type 2025 & 2033
- Figure 22: South America Information Technology Application Innovation Hardware Volume Share (%), by Type 2025 & 2033
- Figure 23: South America Information Technology Application Innovation Hardware Revenue (undefined), by Country 2025 & 2033
- Figure 24: South America Information Technology Application Innovation Hardware Volume (K), by Country 2025 & 2033
- Figure 25: South America Information Technology Application Innovation Hardware Revenue Share (%), by Country 2025 & 2033
- Figure 26: South America Information Technology Application Innovation Hardware Volume Share (%), by Country 2025 & 2033
- Figure 27: Europe Information Technology Application Innovation Hardware Revenue (undefined), by Application 2025 & 2033
- Figure 28: Europe Information Technology Application Innovation Hardware Volume (K), by Application 2025 & 2033
- Figure 29: Europe Information Technology Application Innovation Hardware Revenue Share (%), by Application 2025 & 2033
- Figure 30: Europe Information Technology Application Innovation Hardware Volume Share (%), by Application 2025 & 2033
- Figure 31: Europe Information Technology Application Innovation Hardware Revenue (undefined), by Type 2025 & 2033
- Figure 32: Europe Information Technology Application Innovation Hardware Volume (K), by Type 2025 & 2033
- Figure 33: Europe Information Technology Application Innovation Hardware Revenue Share (%), by Type 2025 & 2033
- Figure 34: Europe Information Technology Application Innovation Hardware Volume Share (%), by Type 2025 & 2033
- Figure 35: Europe Information Technology Application Innovation Hardware Revenue (undefined), by Country 2025 & 2033
- Figure 36: Europe Information Technology Application Innovation Hardware Volume (K), by Country 2025 & 2033
- Figure 37: Europe Information Technology Application Innovation Hardware Revenue Share (%), by Country 2025 & 2033
- Figure 38: Europe Information Technology Application Innovation Hardware Volume Share (%), by Country 2025 & 2033
- Figure 39: Middle East & Africa Information Technology Application Innovation Hardware Revenue (undefined), by Application 2025 & 2033
- Figure 40: Middle East & Africa Information Technology Application Innovation Hardware Volume (K), by Application 2025 & 2033
- Figure 41: Middle East & Africa Information Technology Application Innovation Hardware Revenue Share (%), by Application 2025 & 2033
- Figure 42: Middle East & Africa Information Technology Application Innovation Hardware Volume Share (%), by Application 2025 & 2033
- Figure 43: Middle East & Africa Information Technology Application Innovation Hardware Revenue (undefined), by Type 2025 & 2033
- Figure 44: Middle East & Africa Information Technology Application Innovation Hardware Volume (K), by Type 2025 & 2033
- Figure 45: Middle East & Africa Information Technology Application Innovation Hardware Revenue Share (%), by Type 2025 & 2033
- Figure 46: Middle East & Africa Information Technology Application Innovation Hardware Volume Share (%), by Type 2025 & 2033
- Figure 47: Middle East & Africa Information Technology Application Innovation Hardware Revenue (undefined), by Country 2025 & 2033
- Figure 48: Middle East & Africa Information Technology Application Innovation Hardware Volume (K), by Country 2025 & 2033
- Figure 49: Middle East & Africa Information Technology Application Innovation Hardware Revenue Share (%), by Country 2025 & 2033
- Figure 50: Middle East & Africa Information Technology Application Innovation Hardware Volume Share (%), by Country 2025 & 2033
- Figure 51: Asia Pacific Information Technology Application Innovation Hardware Revenue (undefined), by Application 2025 & 2033
- Figure 52: Asia Pacific Information Technology Application Innovation Hardware Volume (K), by Application 2025 & 2033
- Figure 53: Asia Pacific Information Technology Application Innovation Hardware Revenue Share (%), by Application 2025 & 2033
- Figure 54: Asia Pacific Information Technology Application Innovation Hardware Volume Share (%), by Application 2025 & 2033
- Figure 55: Asia Pacific Information Technology Application Innovation Hardware Revenue (undefined), by Type 2025 & 2033
- Figure 56: Asia Pacific Information Technology Application Innovation Hardware Volume (K), by Type 2025 & 2033
- Figure 57: Asia Pacific Information Technology Application Innovation Hardware Revenue Share (%), by Type 2025 & 2033
- Figure 58: Asia Pacific Information Technology Application Innovation Hardware Volume Share (%), by Type 2025 & 2033
- Figure 59: Asia Pacific Information Technology Application Innovation Hardware Revenue (undefined), by Country 2025 & 2033
- Figure 60: Asia Pacific Information Technology Application Innovation Hardware Volume (K), by Country 2025 & 2033
- Figure 61: Asia Pacific Information Technology Application Innovation Hardware Revenue Share (%), by Country 2025 & 2033
- Figure 62: Asia Pacific Information Technology Application Innovation Hardware Volume Share (%), by Country 2025 & 2033
List of Tables
- Table 1: Global Information Technology Application Innovation Hardware Revenue undefined Forecast, by Application 2020 & 2033
- Table 2: Global Information Technology Application Innovation Hardware Volume K Forecast, by Application 2020 & 2033
- Table 3: Global Information Technology Application Innovation Hardware Revenue undefined Forecast, by Type 2020 & 2033
- Table 4: Global Information Technology Application Innovation Hardware Volume K Forecast, by Type 2020 & 2033
- Table 5: Global Information Technology Application Innovation Hardware Revenue undefined Forecast, by Region 2020 & 2033
- Table 6: Global Information Technology Application Innovation Hardware Volume K Forecast, by Region 2020 & 2033
- Table 7: Global Information Technology Application Innovation Hardware Revenue undefined Forecast, by Application 2020 & 2033
- Table 8: Global Information Technology Application Innovation Hardware Volume K Forecast, by Application 2020 & 2033
- Table 9: Global Information Technology Application Innovation Hardware Revenue undefined Forecast, by Type 2020 & 2033
- Table 10: Global Information Technology Application Innovation Hardware Volume K Forecast, by Type 2020 & 2033
- Table 11: Global Information Technology Application Innovation Hardware Revenue undefined Forecast, by Country 2020 & 2033
- Table 12: Global Information Technology Application Innovation Hardware Volume K Forecast, by Country 2020 & 2033
- Table 13: United States Information Technology Application Innovation Hardware Revenue (undefined) Forecast, by Application 2020 & 2033
- Table 14: United States Information Technology Application Innovation Hardware Volume (K) Forecast, by Application 2020 & 2033
- Table 15: Canada Information Technology Application Innovation Hardware Revenue (undefined) Forecast, by Application 2020 & 2033
- Table 16: Canada Information Technology Application Innovation Hardware Volume (K) Forecast, by Application 2020 & 2033
- Table 17: Mexico Information Technology Application Innovation Hardware Revenue (undefined) Forecast, by Application 2020 & 2033
- Table 18: Mexico Information Technology Application Innovation Hardware Volume (K) Forecast, by Application 2020 & 2033
- Table 19: Global Information Technology Application Innovation Hardware Revenue undefined Forecast, by Application 2020 & 2033
- Table 20: Global Information Technology Application Innovation Hardware Volume K Forecast, by Application 2020 & 2033
- Table 21: Global Information Technology Application Innovation Hardware Revenue undefined Forecast, by Type 2020 & 2033
- Table 22: Global Information Technology Application Innovation Hardware Volume K Forecast, by Type 2020 & 2033
- Table 23: Global Information Technology Application Innovation Hardware Revenue undefined Forecast, by Country 2020 & 2033
- Table 24: Global Information Technology Application Innovation Hardware Volume K Forecast, by Country 2020 & 2033
- Table 25: Brazil Information Technology Application Innovation Hardware Revenue (undefined) Forecast, by Application 2020 & 2033
- Table 26: Brazil Information Technology Application Innovation Hardware Volume (K) Forecast, by Application 2020 & 2033
- Table 27: Argentina Information Technology Application Innovation Hardware Revenue (undefined) Forecast, by Application 2020 & 2033
- Table 28: Argentina Information Technology Application Innovation Hardware Volume (K) Forecast, by Application 2020 & 2033
- Table 29: Rest of South America Information Technology Application Innovation Hardware Revenue (undefined) Forecast, by Application 2020 & 2033
- Table 30: Rest of South America Information Technology Application Innovation Hardware Volume (K) Forecast, by Application 2020 & 2033
- Table 31: Global Information Technology Application Innovation Hardware Revenue undefined Forecast, by Application 2020 & 2033
- Table 32: Global Information Technology Application Innovation Hardware Volume K Forecast, by Application 2020 & 2033
- Table 33: Global Information Technology Application Innovation Hardware Revenue undefined Forecast, by Type 2020 & 2033
- Table 34: Global Information Technology Application Innovation Hardware Volume K Forecast, by Type 2020 & 2033
- Table 35: Global Information Technology Application Innovation Hardware Revenue undefined Forecast, by Country 2020 & 2033
- Table 36: Global Information Technology Application Innovation Hardware Volume K Forecast, by Country 2020 & 2033
- Table 37: United Kingdom Information Technology Application Innovation Hardware Revenue (undefined) Forecast, by Application 2020 & 2033
- Table 38: United Kingdom Information Technology Application Innovation Hardware Volume (K) Forecast, by Application 2020 & 2033
- Table 39: Germany Information Technology Application Innovation Hardware Revenue (undefined) Forecast, by Application 2020 & 2033
- Table 40: Germany Information Technology Application Innovation Hardware Volume (K) Forecast, by Application 2020 & 2033
- Table 41: France Information Technology Application Innovation Hardware Revenue (undefined) Forecast, by Application 2020 & 2033
- Table 42: France Information Technology Application Innovation Hardware Volume (K) Forecast, by Application 2020 & 2033
- Table 43: Italy Information Technology Application Innovation Hardware Revenue (undefined) Forecast, by Application 2020 & 2033
- Table 44: Italy Information Technology Application Innovation Hardware Volume (K) Forecast, by Application 2020 & 2033
- Table 45: Spain Information Technology Application Innovation Hardware Revenue (undefined) Forecast, by Application 2020 & 2033
- Table 46: Spain Information Technology Application Innovation Hardware Volume (K) Forecast, by Application 2020 & 2033
- Table 47: Russia Information Technology Application Innovation Hardware Revenue (undefined) Forecast, by Application 2020 & 2033
- Table 48: Russia Information Technology Application Innovation Hardware Volume (K) Forecast, by Application 2020 & 2033
- Table 49: Benelux Information Technology Application Innovation Hardware Revenue (undefined) Forecast, by Application 2020 & 2033
- Table 50: Benelux Information Technology Application Innovation Hardware Volume (K) Forecast, by Application 2020 & 2033
- Table 51: Nordics Information Technology Application Innovation Hardware Revenue (undefined) Forecast, by Application 2020 & 2033
- Table 52: Nordics Information Technology Application Innovation Hardware Volume (K) Forecast, by Application 2020 & 2033
- Table 53: Rest of Europe Information Technology Application Innovation Hardware Revenue (undefined) Forecast, by Application 2020 & 2033
- Table 54: Rest of Europe Information Technology Application Innovation Hardware Volume (K) Forecast, by Application 2020 & 2033
- Table 55: Global Information Technology Application Innovation Hardware Revenue undefined Forecast, by Application 2020 & 2033
- Table 56: Global Information Technology Application Innovation Hardware Volume K Forecast, by Application 2020 & 2033
- Table 57: Global Information Technology Application Innovation Hardware Revenue undefined Forecast, by Type 2020 & 2033
- Table 58: Global Information Technology Application Innovation Hardware Volume K Forecast, by Type 2020 & 2033
- Table 59: Global Information Technology Application Innovation Hardware Revenue undefined Forecast, by Country 2020 & 2033
- Table 60: Global Information Technology Application Innovation Hardware Volume K Forecast, by Country 2020 & 2033
- Table 61: Turkey Information Technology Application Innovation Hardware Revenue (undefined) Forecast, by Application 2020 & 2033
- Table 62: Turkey Information Technology Application Innovation Hardware Volume (K) Forecast, by Application 2020 & 2033
- Table 63: Israel Information Technology Application Innovation Hardware Revenue (undefined) Forecast, by Application 2020 & 2033
- Table 64: Israel Information Technology Application Innovation Hardware Volume (K) Forecast, by Application 2020 & 2033
- Table 65: GCC Information Technology Application Innovation Hardware Revenue (undefined) Forecast, by Application 2020 & 2033
- Table 66: GCC Information Technology Application Innovation Hardware Volume (K) Forecast, by Application 2020 & 2033
- Table 67: North Africa Information Technology Application Innovation Hardware Revenue (undefined) Forecast, by Application 2020 & 2033
- Table 68: North Africa Information Technology Application Innovation Hardware Volume (K) Forecast, by Application 2020 & 2033
- Table 69: South Africa Information Technology Application Innovation Hardware Revenue (undefined) Forecast, by Application 2020 & 2033
- Table 70: South Africa Information Technology Application Innovation Hardware Volume (K) Forecast, by Application 2020 & 2033
- Table 71: Rest of Middle East & Africa Information Technology Application Innovation Hardware Revenue (undefined) Forecast, by Application 2020 & 2033
- Table 72: Rest of Middle East & Africa Information Technology Application Innovation Hardware Volume (K) Forecast, by Application 2020 & 2033
- Table 73: Global Information Technology Application Innovation Hardware Revenue undefined Forecast, by Application 2020 & 2033
- Table 74: Global Information Technology Application Innovation Hardware Volume K Forecast, by Application 2020 & 2033
- Table 75: Global Information Technology Application Innovation Hardware Revenue undefined Forecast, by Type 2020 & 2033
- Table 76: Global Information Technology Application Innovation Hardware Volume K Forecast, by Type 2020 & 2033
- Table 77: Global Information Technology Application Innovation Hardware Revenue undefined Forecast, by Country 2020 & 2033
- Table 78: Global Information Technology Application Innovation Hardware Volume K Forecast, by Country 2020 & 2033
- Table 79: China Information Technology Application Innovation Hardware Revenue (undefined) Forecast, by Application 2020 & 2033
- Table 80: China Information Technology Application Innovation Hardware Volume (K) Forecast, by Application 2020 & 2033
- Table 81: India Information Technology Application Innovation Hardware Revenue (undefined) Forecast, by Application 2020 & 2033
- Table 82: India Information Technology Application Innovation Hardware Volume (K) Forecast, by Application 2020 & 2033
- Table 83: Japan Information Technology Application Innovation Hardware Revenue (undefined) Forecast, by Application 2020 & 2033
- Table 84: Japan Information Technology Application Innovation Hardware Volume (K) Forecast, by Application 2020 & 2033
- Table 85: South Korea Information Technology Application Innovation Hardware Revenue (undefined) Forecast, by Application 2020 & 2033
- Table 86: South Korea Information Technology Application Innovation Hardware Volume (K) Forecast, by Application 2020 & 2033
- Table 87: ASEAN Information Technology Application Innovation Hardware Revenue (undefined) Forecast, by Application 2020 & 2033
- Table 88: ASEAN Information Technology Application Innovation Hardware Volume (K) Forecast, by Application 2020 & 2033
- Table 89: Oceania Information Technology Application Innovation Hardware Revenue (undefined) Forecast, by Application 2020 & 2033
- Table 90: Oceania Information Technology Application Innovation Hardware Volume (K) Forecast, by Application 2020 & 2033
- Table 91: Rest of Asia Pacific Information Technology Application Innovation Hardware Revenue (undefined) Forecast, by Application 2020 & 2033
- Table 92: Rest of Asia Pacific Information Technology Application Innovation Hardware Volume (K) Forecast, by Application 2020 & 2033
Frequently Asked Questions
1. What is the projected Compound Annual Growth Rate (CAGR) of the Information Technology Application Innovation Hardware?
The projected CAGR is approximately 5.2%.
2. Which companies are prominent players in the Information Technology Application Innovation Hardware?
Key companies in the market include Intel, AMD, Phytium Technology, Apple, Samsung, Huawei, Broadcom Corporation, Institute of Computing Technology, Chinese Academy of Sciences, Hygon, Zhaoxin, Jiangnan Institute of Computing Technology, Inspur Electronic Information Industry, Jiangsu Ruiji Boyun Network Technology Group, Dawning Information Industry, Digital China Group, DHC Software, Unisplendour Corporation, ArcherMind Technology, China National Software and Service Company Limited, NavInfo, Tongfang Youyun Technology, HP, Dell, IBM, Oracle, Fujitsu, Cisco, NEC, SGI, Lenovo.
3. What are the main segments of the Information Technology Application Innovation Hardware?
The market segments include Application, Type.
4. Can you provide details about the market size?
The market size is estimated to be USD XXX N/A as of 2022.
5. What are some drivers contributing to market growth?
N/A
6. What are the notable trends driving market growth?
N/A
7. Are there any restraints impacting market growth?
N/A
8. Can you provide examples of recent developments in the market?
N/A
9. What pricing options are available for accessing the report?
Pricing options include single-user, multi-user, and enterprise licenses priced at USD 3950.00, USD 5925.00, and USD 7900.00 respectively.
10. Is the market size provided in terms of value or volume?
The market size is provided in terms of value, measured in N/A and volume, measured in K.
11. Are there any specific market keywords associated with the report?
Yes, the market keyword associated with the report is "Information Technology Application Innovation Hardware," which aids in identifying and referencing the specific market segment covered.
12. How do I determine which pricing option suits my needs best?
The pricing options vary based on user requirements and access needs. Individual users may opt for single-user licenses, while businesses requiring broader access may choose multi-user or enterprise licenses for cost-effective access to the report.
13. Are there any additional resources or data provided in the Information Technology Application Innovation Hardware report?
While the report offers comprehensive insights, it's advisable to review the specific contents or supplementary materials provided to ascertain if additional resources or data are available.
14. How can I stay updated on further developments or reports in the Information Technology Application Innovation Hardware?
To stay informed about further developments, trends, and reports in the Information Technology Application Innovation Hardware, consider subscribing to industry newsletters, following relevant companies and organizations, or regularly checking reputable industry news sources and publications.
Methodology
Step 1 - Identification of Relevant Samples Size from Population Database


Step 2 - Approaches for Defining Global Market Size (Value, Volume* & Price*)

Note*: In applicable scenarios
Step 3 - Data Sources
Primary Research
- Web Analytics
- Survey Reports
- Research Institute
- Latest Research Reports
- Opinion Leaders
Secondary Research
- Annual Reports
- White Paper
- Latest Press Release
- Industry Association
- Paid Database
- Investor Presentations

Step 4 - Data Triangulation
Involves using different sources of information in order to increase the validity of a study
These sources are likely to be stakeholders in a program - participants, other researchers, program staff, other community members, and so on.
Then we put all data in single framework & apply various statistical tools to find out the dynamic on the market.
During the analysis stage, feedback from the stakeholder groups would be compared to determine areas of agreement as well as areas of divergence