

Key Insights
The Middle East and Africa (MEA) payments market is projected for significant expansion, forecasted to reach approximately $20,672.1 million by 2030, exhibiting a Compound Annual Growth Rate (CAGR) of 7.1%. This robust growth is underpinned by several key factors: the accelerating adoption of digital payment solutions, a youthful and technologically adept demographic, increased smartphone penetration, and government-driven initiatives promoting financial inclusion and digital economies. The transition from cash to secure and convenient digital payment methods, including card transactions and mobile wallets, is a primary market driver. The burgeoning e-commerce sector and evolving online retail capabilities are also fostering innovation in payment technologies and services.
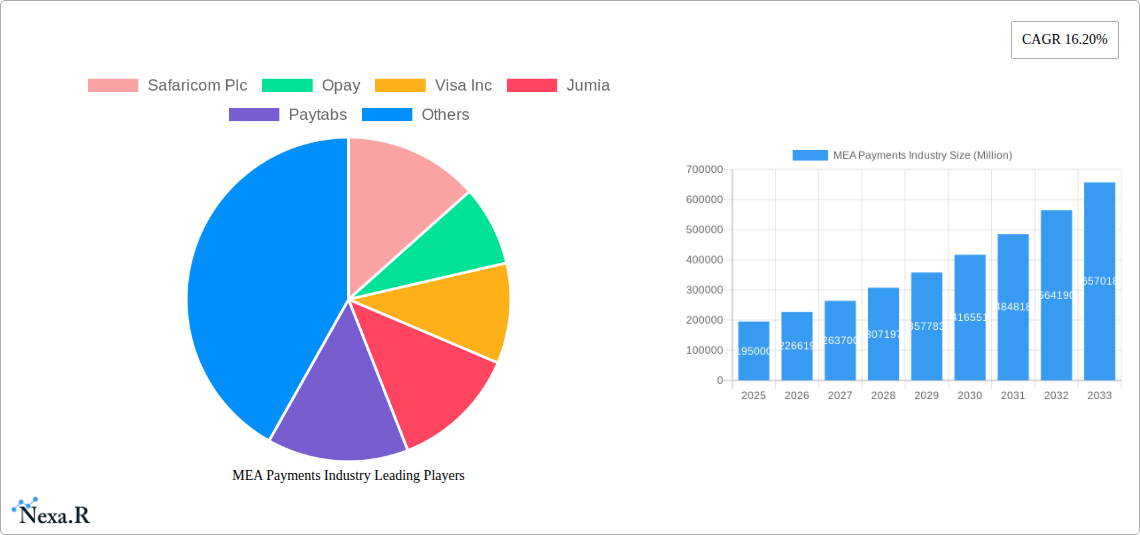
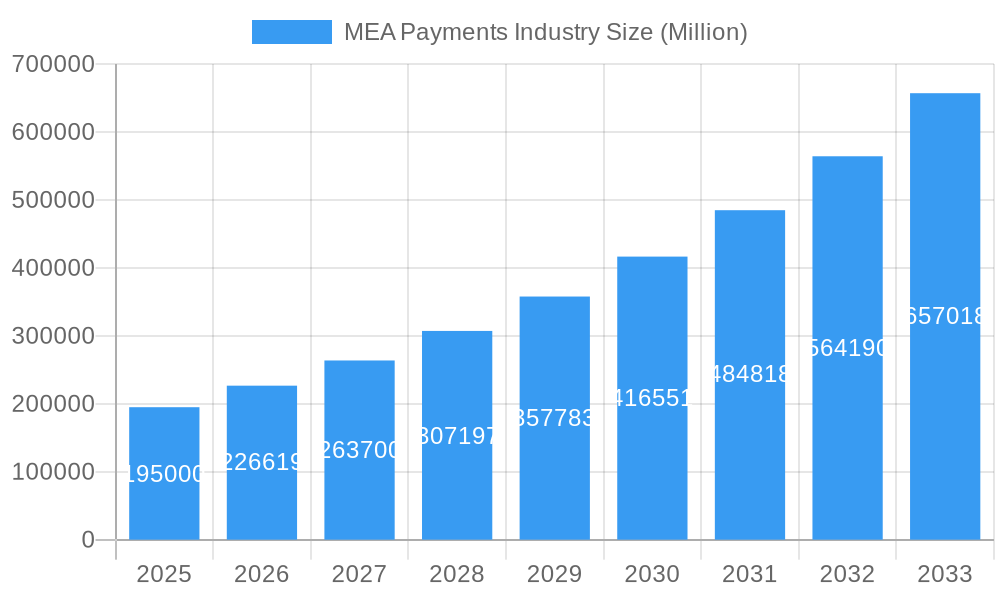
MEA Payments Industry Market Size (In Billion)
Key trends influencing the MEA payments sector include the widespread adoption of digital wallets, enhancing transaction convenience and accessibility. Innovations in Point-of-Sale (POS) systems, particularly contactless payment solutions, are improving in-store purchasing experiences. The growth of online sales across retail, entertainment, and healthcare sectors is boosting transaction volumes. Emerging challenges involve disparities in digital literacy and infrastructure development, potential cybersecurity risks, and the necessity for comprehensive regulatory frameworks to build consumer confidence and ensure data privacy. Despite these considerations, the MEA payments market is on a strong growth path, propelled by technological advancements and escalating demand for integrated digital financial services.
MEA Payments Industry Company Market Share
MEA Payments Industry Report: Unlocking Growth in a Digital Frontier (2019-2033)
This comprehensive report provides an in-depth analysis of the Middle East and Africa (MEA) payments industry, a rapidly evolving landscape driven by digital transformation and increasing consumer adoption of electronic transactions. With a study period spanning 2019-2033, including a base year of 2025 and a forecast period of 2025-2033, this report offers critical insights into market dynamics, growth trends, regional dominance, product innovation, and the strategic imperatives for stakeholders. We delve into the parent and child market segments, exploring the intricate web of payment modes, end-user industries, and key players shaping this dynamic sector. All monetary values are presented in Million units.
MEA Payments Industry Market Dynamics & Structure
The MEA payments industry is characterized by a dynamic interplay of market concentration, rapid technological innovation, and evolving regulatory frameworks. While some established global players hold significant market share, the region also witnesses the rise of agile local fintech companies, fostering a competitive environment. Technological advancements, particularly in mobile payments and digital wallets, are acting as key drivers, democratizing access to financial services and pushing the boundaries of transaction convenience. The competitive landscape includes a mix of traditional financial institutions, payment processors, and digital platforms, with significant competition arising from innovative payment substitutes. End-user demographics are increasingly tech-savvy, demanding seamless and secure payment experiences across various platforms. Mergers and acquisitions (M&A) activity is expected to continue as companies seek to expand their reach, acquire new technologies, and consolidate their market positions.
- Market Concentration: Moderate to high in established digital payment segments, with increasing fragmentation due to new fintech entrants.
- Technological Innovation Drivers: Proliferation of smartphones, increasing internet penetration, and the demand for contactless and instant payment solutions.
- Regulatory Frameworks: Varying across countries, with a growing emphasis on consumer protection, data security, and interoperability to foster a more unified payment ecosystem.
- Competitive Product Substitutes: Mobile money, buy-now-pay-later (BNPL) solutions, and peer-to-peer (P2P) payment apps are challenging traditional card-based and cash transactions.
- End-User Demographics: A young and increasingly urbanized population, receptive to digital adoption and seeking convenience.
- M&A Trends: Strategic acquisitions targeting innovative technologies, customer bases, and geographical expansion are prevalent. The report anticipates significant M&A volumes in the coming years as companies aim for scale and synergy.
MEA Payments Industry Growth Trends & Insights
The MEA payments industry is on an accelerated growth trajectory, projected to witness robust expansion driven by a confluence of factors. The market size is evolving rapidly, with significant increases anticipated in transaction volumes and values. Adoption rates for digital payment methods are surging, propelled by government initiatives promoting financial inclusion, increasing smartphone penetration, and a growing consumer preference for convenience and security. Technological disruptions are reshaping the industry at an unprecedented pace; advancements in Artificial Intelligence (AI) for fraud detection, blockchain for secure transactions, and the continued evolution of mobile payment technologies are pivotal. Consumer behavior shifts are clearly indicative of a move away from traditional cash transactions towards digital alternatives. This is fueled by a desire for speed, ease of use, and access to a wider range of financial services, including e-commerce, digital remittances, and online bill payments. The market is expected to experience a Compound Annual Growth Rate (CAGR) of xx% during the forecast period, a testament to its dynamic nature. Market penetration for digital payments, currently at xx% for online transactions and xx% for point-of-sale, is projected to climb steadily, indicating substantial untapped potential. The increasing acceptance of various payment methods, including QR codes, contactless cards, and integrated digital wallets, further solidifies the industry's upward trend. The base year, 2025, serves as a critical benchmark for understanding the current market landscape and projecting future performance. The estimated year of 2025 will provide a snapshot of market value at xx Million units.
Dominant Regions, Countries, or Segments in MEA Payments Industry
The MEA payments industry's growth is not uniform, with certain regions, countries, and segments exhibiting particular dominance. Digital Wallets (Includes Mobile Wallets) within the Point of Sale mode of payment are emerging as a leading segment, driven by their widespread adoption and ease of use across diverse demographics, particularly in countries with high mobile penetration rates. The Retail end-user industry also stands out as a significant driver, owing to the rapid growth of e-commerce and the increasing adoption of digital payment solutions by both online and brick-and-mortar retailers to cater to evolving consumer demands.
Leading Segment: Digital Wallets (Includes Mobile Wallets) at Point of Sale.
- Market Share: Projected to capture xx% of the POS payment market by 2033.
- Growth Potential: High, fueled by increasing smartphone ownership and the demand for contactless transactions.
- Key Drivers: Convenience, speed, and accessibility, especially for unbanked and underbanked populations.
Dominant End-User Industry: Retail.
- Market Share: Accounts for an estimated xx% of all payment transactions.
- Growth Potential: Substantial, driven by the expanding e-commerce sector and the digitalization of traditional retail.
- Key Drivers: Increased online shopping, the need for omnichannel payment solutions, and the integration of payment gateways into e-commerce platforms.
Key Country Dominance: While specific country data varies, Kenya stands out for its pioneering role in mobile money adoption, significantly influencing the broader African payments landscape. Other countries exhibiting strong growth include the United Arab Emirates (UAE) for its advanced digital infrastructure and high per capita spending, and South Africa for its developed financial services sector.
- Economic Policies: Favorable government initiatives promoting digital payments and financial inclusion in countries like Kenya and Nigeria are critical growth catalysts.
- Infrastructure: Robust telecommunications networks and internet connectivity are paramount for the success of digital payment solutions. The partnership between LINX and IXAfrica in Nairobi underscores the growing importance of data center infrastructure in the region.
- Consumer Behavior: The increasing comfort and preference for digital transactions among consumers, influenced by global trends and local innovations, is a universal driver of dominance.
MEA Payments Industry Product Landscape
The MEA payments industry is witnessing a vibrant array of product innovations, enhancing both functionality and user experience. The landscape is dominated by the proliferation of user-friendly Digital Wallets, offering seamless integration with e-commerce platforms, P2P transfers, and bill payments. Card Pay solutions are evolving with the integration of contactless technology and enhanced security features, catering to a more sophisticated consumer base. Online sales are increasingly supported by diverse payment gateways, including Others encompassing innovative solutions like Buy Now Pay Later (BNPL) and localized payment methods. Product performance is measured by transaction speed, security, cost-effectiveness, and user adoption rates. Unique selling propositions often lie in localized features, competitive fee structures, and robust security protocols. Technological advancements such as tokenization and biometric authentication are increasingly being embedded into payment products to bolster trust and reduce fraud.
Key Drivers, Barriers & Challenges in MEA Payments Industry
Key Drivers:
- Technological Advancements: Rapid adoption of smartphones, increasing internet penetration, and innovation in mobile payment solutions.
- Economic Growth & Urbanization: Rising disposable incomes and a growing urban population demanding convenient and digital payment options.
- Government Initiatives: Policies promoting financial inclusion, digitalization of economies, and the development of robust payment infrastructures.
- E-commerce Boom: The exponential growth of online retail necessitates efficient and secure digital payment solutions.
Barriers & Challenges:
- Infrastructure Gaps: Uneven internet connectivity and limited access to banking services in certain remote areas can hinder widespread adoption.
- Regulatory Hurdles: Diverse and sometimes restrictive regulatory frameworks across different countries can complicate market entry and expansion.
- Cybersecurity Threats: The increasing sophistication of cyberattacks poses a significant risk to user data and transaction integrity, requiring continuous investment in security measures.
- Digital Literacy: A segment of the population still requires education and training to confidently adopt and utilize digital payment methods.
- Cash Dominance: Despite the digital shift, cash remains a prevalent mode of transaction in certain segments and regions, presenting a persistent challenge.
Emerging Opportunities in MEA Payments Industry
Emerging opportunities within the MEA payments industry are manifold, particularly in untapped markets and evolving consumer preferences. The continued growth of e-commerce presents a fertile ground for innovative payment solutions, including BNPL services and localized payment gateways that cater to specific regional buying habits. The unbanked and underbanked populations represent a significant opportunity for financial inclusion through accessible and low-cost mobile money solutions. Furthermore, the increasing demand for integrated payment experiences within the Hospitality and Healthcare sectors offers avenues for specialized payment solutions. The adoption of cross-border payment solutions is also a key area for growth, facilitating trade and remittances within the region and beyond.
Growth Accelerators in the MEA Payments Industry Industry
Long-term growth in the MEA payments industry will be significantly accelerated by continued technological breakthroughs, strategic partnerships, and ambitious market expansion strategies. The refinement of AI and machine learning for personalized financial services and enhanced fraud detection will foster greater user trust and efficiency. Strategic alliances between fintech companies, traditional banks, and telecommunication providers are crucial for expanding reach and leveraging existing customer bases. For instance, collaborations similar to Visa's efforts in Sudan, as detailed in the notable milestones, will be instrumental. Furthermore, expansion into underserved rural areas and the development of interoperable payment systems across different countries will unlock substantial growth potential. The report projects these accelerators to drive sustained market expansion throughout the forecast period.
Key Players Shaping the MEA Payments Industry Market
- Safaricom Plc
- Opay
- Visa Inc
- Jumia
- Paytabs
- PalmPay Technology Co Ltd
- Interswitch Ltd
- Amazon com Inc
- Apple Inc
- Network International Holdings Plc
Notable Milestones in MEA Payments Industry Sector
- June 2022: The London Internet Exchange (LINX) partners with IXAfrica to establish a new interconnection facility in Nairobi, enhancing the region's digital infrastructure critical for payment processing and data management.
- August 2021: Visa becomes the first firm to introduce digital payments in Sudan, collaborating with eight licensed partners to extend payment technology benefits to cardholders and retailers, significantly boosting digital payment adoption in the country.
In-Depth MEA Payments Industry Market Outlook
The MEA payments industry is poised for remarkable future growth, driven by a confluence of strategic imperatives. The report's outlook emphasizes the continued expansion of digital payment ecosystems, fueled by ongoing technological innovation and a growing appetite for seamless financial transactions among consumers. Key opportunities lie in further penetrating emerging markets, particularly in Sub-Saharan Africa, where financial inclusion remains a critical objective. The evolution of e-commerce, coupled with the rise of new consumer segments like Gen Z, will necessitate agile and personalized payment solutions. Strategic partnerships and acquisitions will continue to play a pivotal role in consolidating market share and expanding service offerings. The overall market potential is substantial, with the industry expected to transform economies by fostering greater financial participation and driving economic development across the region.
MEA Payments Industry Segmentation
-
1. Mode of Payment
-
1.1. Point of Sale
- 1.1.1. Card Pay
- 1.1.2. Digital Wallet (Includes Mobile Wallets)
- 1.1.3. Cash
- 1.1.4. Others
-
1.2. Online Sale
- 1.2.1. Others (
-
1.1. Point of Sale
-
2. End-user Industry
- 2.1. Retail
- 2.2. Entertainment
- 2.3. Healthcare
- 2.4. Hospitality
- 2.5. Other End-user Industries
MEA Payments Industry Segmentation By Geography
-
1. North America
- 1.1. United States
- 1.2. Canada
- 1.3. Mexico
-
2. South America
- 2.1. Brazil
- 2.2. Argentina
- 2.3. Rest of South America
-
3. Europe
- 3.1. United Kingdom
- 3.2. Germany
- 3.3. France
- 3.4. Italy
- 3.5. Spain
- 3.6. Russia
- 3.7. Benelux
- 3.8. Nordics
- 3.9. Rest of Europe
-
4. Middle East & Africa
- 4.1. Turkey
- 4.2. Israel
- 4.3. GCC
- 4.4. North Africa
- 4.5. South Africa
- 4.6. Rest of Middle East & Africa
-
5. Asia Pacific
- 5.1. China
- 5.2. India
- 5.3. Japan
- 5.4. South Korea
- 5.5. ASEAN
- 5.6. Oceania
- 5.7. Rest of Asia Pacific
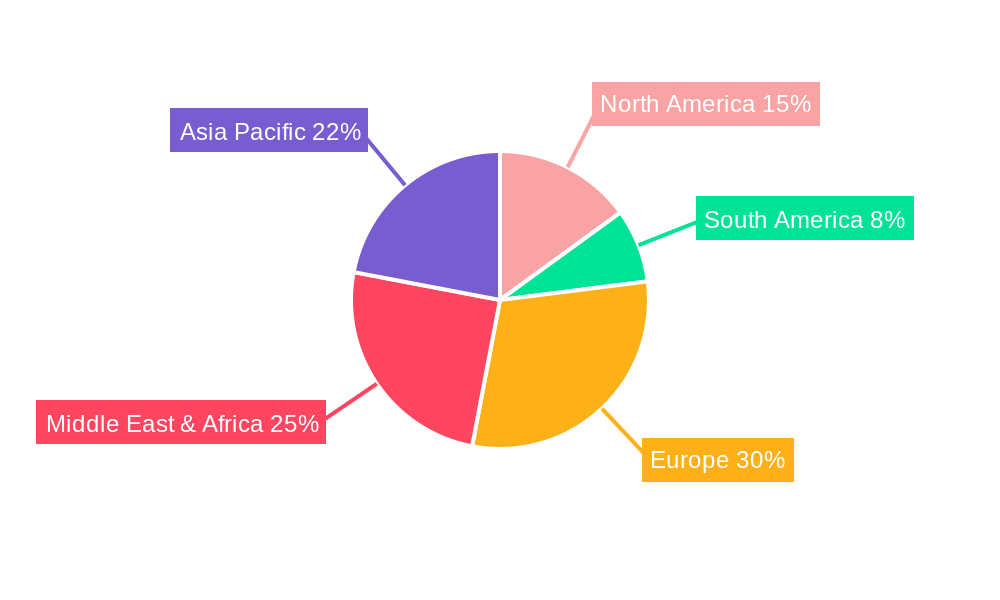
MEA Payments Industry Regional Market Share
Geographic Coverage of MEA Payments Industry
MEA Payments Industry REPORT HIGHLIGHTS
| Aspects | Details |
|---|---|
| Study Period | 2020-2034 |
| Base Year | 2025 |
| Estimated Year | 2026 |
| Forecast Period | 2026-2034 |
| Historical Period | 2020-2025 |
| Growth Rate | CAGR of 7.1% from 2020-2034 |
| Segmentation |
|
Table of Contents
- 1. Introduction
- 1.1. Research Scope
- 1.2. Market Segmentation
- 1.3. Research Objective
- 1.4. Definitions and Assumptions
- 2. Executive Summary
- 2.1. Market Snapshot
- 3. Market Dynamics
- 3.1. Market Drivers
- 3.2. Market Restrains
- 3.3. Market Trends
- 3.4. Market Opportunities
- 4. Market Factor Analysis
- 4.1. Porters Five Forces
- 4.1.1. Bargaining Power of Suppliers
- 4.1.2. Bargaining Power of Buyers
- 4.1.3. Threat of New Entrants
- 4.1.4. Threat of Substitutes
- 4.1.5. Competitive Rivalry
- 4.2. PESTEL analysis
- 4.3. BCG Analysis
- 4.3.1. Stars (High Growth, High Market Share)
- 4.3.2. Cash Cows (Low Growth, High Market Share)
- 4.3.3. Question Mark (High Growth, Low Market Share)
- 4.3.4. Dogs (Low Growth, Low Market Share)
- 4.4. Ansoff Matrix Analysis
- 4.5. Supply Chain Analysis
- 4.6. Regulatory Landscape
- 4.7. Current Market Potential and Opportunity Assessment (TAM–SAM–SOM Framework)
- 4.8. NRP Analyst Note
- 4.1. Porters Five Forces
- 5. Market Analysis, Insights and Forecast 2021-2033
- 5.1. Market Analysis, Insights and Forecast - by Mode of Payment
- 5.1.1. Point of Sale
- 5.1.1.1. Card Pay
- 5.1.1.2. Digital Wallet (Includes Mobile Wallets)
- 5.1.1.3. Cash
- 5.1.1.4. Others
- 5.1.2. Online Sale
- 5.1.2.1. Others (
- 5.1.1. Point of Sale
- 5.2. Market Analysis, Insights and Forecast - by End-user Industry
- 5.2.1. Retail
- 5.2.2. Entertainment
- 5.2.3. Healthcare
- 5.2.4. Hospitality
- 5.2.5. Other End-user Industries
- 5.3. Market Analysis, Insights and Forecast - by Region
- 5.3.1. North America
- 5.3.2. South America
- 5.3.3. Europe
- 5.3.4. Middle East & Africa
- 5.3.5. Asia Pacific
- 5.1. Market Analysis, Insights and Forecast - by Mode of Payment
- 6. Global MEA Payments Industry Analysis, Insights and Forecast, 2021-2033
- 6.1. Market Analysis, Insights and Forecast - by Mode of Payment
- 6.1.1. Point of Sale
- 6.1.1.1. Card Pay
- 6.1.1.2. Digital Wallet (Includes Mobile Wallets)
- 6.1.1.3. Cash
- 6.1.1.4. Others
- 6.1.2. Online Sale
- 6.1.2.1. Others (
- 6.1.1. Point of Sale
- 6.2. Market Analysis, Insights and Forecast - by End-user Industry
- 6.2.1. Retail
- 6.2.2. Entertainment
- 6.2.3. Healthcare
- 6.2.4. Hospitality
- 6.2.5. Other End-user Industries
- 6.1. Market Analysis, Insights and Forecast - by Mode of Payment
- 7. North America MEA Payments Industry Analysis, Insights and Forecast, 2020-2032
- 7.1. Market Analysis, Insights and Forecast - by Mode of Payment
- 7.1.1. Point of Sale
- 7.1.1.1. Card Pay
- 7.1.1.2. Digital Wallet (Includes Mobile Wallets)
- 7.1.1.3. Cash
- 7.1.1.4. Others
- 7.1.2. Online Sale
- 7.1.2.1. Others (
- 7.1.1. Point of Sale
- 7.2. Market Analysis, Insights and Forecast - by End-user Industry
- 7.2.1. Retail
- 7.2.2. Entertainment
- 7.2.3. Healthcare
- 7.2.4. Hospitality
- 7.2.5. Other End-user Industries
- 7.1. Market Analysis, Insights and Forecast - by Mode of Payment
- 8. South America MEA Payments Industry Analysis, Insights and Forecast, 2020-2032
- 8.1. Market Analysis, Insights and Forecast - by Mode of Payment
- 8.1.1. Point of Sale
- 8.1.1.1. Card Pay
- 8.1.1.2. Digital Wallet (Includes Mobile Wallets)
- 8.1.1.3. Cash
- 8.1.1.4. Others
- 8.1.2. Online Sale
- 8.1.2.1. Others (
- 8.1.1. Point of Sale
- 8.2. Market Analysis, Insights and Forecast - by End-user Industry
- 8.2.1. Retail
- 8.2.2. Entertainment
- 8.2.3. Healthcare
- 8.2.4. Hospitality
- 8.2.5. Other End-user Industries
- 8.1. Market Analysis, Insights and Forecast - by Mode of Payment
- 9. Europe MEA Payments Industry Analysis, Insights and Forecast, 2020-2032
- 9.1. Market Analysis, Insights and Forecast - by Mode of Payment
- 9.1.1. Point of Sale
- 9.1.1.1. Card Pay
- 9.1.1.2. Digital Wallet (Includes Mobile Wallets)
- 9.1.1.3. Cash
- 9.1.1.4. Others
- 9.1.2. Online Sale
- 9.1.2.1. Others (
- 9.1.1. Point of Sale
- 9.2. Market Analysis, Insights and Forecast - by End-user Industry
- 9.2.1. Retail
- 9.2.2. Entertainment
- 9.2.3. Healthcare
- 9.2.4. Hospitality
- 9.2.5. Other End-user Industries
- 9.1. Market Analysis, Insights and Forecast - by Mode of Payment
- 10. Middle East & Africa MEA Payments Industry Analysis, Insights and Forecast, 2020-2032
- 10.1. Market Analysis, Insights and Forecast - by Mode of Payment
- 10.1.1. Point of Sale
- 10.1.1.1. Card Pay
- 10.1.1.2. Digital Wallet (Includes Mobile Wallets)
- 10.1.1.3. Cash
- 10.1.1.4. Others
- 10.1.2. Online Sale
- 10.1.2.1. Others (
- 10.1.1. Point of Sale
- 10.2. Market Analysis, Insights and Forecast - by End-user Industry
- 10.2.1. Retail
- 10.2.2. Entertainment
- 10.2.3. Healthcare
- 10.2.4. Hospitality
- 10.2.5. Other End-user Industries
- 10.1. Market Analysis, Insights and Forecast - by Mode of Payment
- 11. Asia Pacific MEA Payments Industry Analysis, Insights and Forecast, 2020-2032
- 11.1. Market Analysis, Insights and Forecast - by Mode of Payment
- 11.1.1. Point of Sale
- 11.1.1.1. Card Pay
- 11.1.1.2. Digital Wallet (Includes Mobile Wallets)
- 11.1.1.3. Cash
- 11.1.1.4. Others
- 11.1.2. Online Sale
- 11.1.2.1. Others (
- 11.1.1. Point of Sale
- 11.2. Market Analysis, Insights and Forecast - by End-user Industry
- 11.2.1. Retail
- 11.2.2. Entertainment
- 11.2.3. Healthcare
- 11.2.4. Hospitality
- 11.2.5. Other End-user Industries
- 11.1. Market Analysis, Insights and Forecast - by Mode of Payment
- 12. Competitive Analysis
- 12.1. Company Profiles
- 12.1.1 Safaricom Plc
- 12.1.1.1. Company Overview
- 12.1.1.2. Products
- 12.1.1.3. Company Financials
- 12.1.1.4. SWOT Analysis
- 12.1.2 Opay
- 12.1.2.1. Company Overview
- 12.1.2.2. Products
- 12.1.2.3. Company Financials
- 12.1.2.4. SWOT Analysis
- 12.1.3 Visa Inc
- 12.1.3.1. Company Overview
- 12.1.3.2. Products
- 12.1.3.3. Company Financials
- 12.1.3.4. SWOT Analysis
- 12.1.4 Jumia
- 12.1.4.1. Company Overview
- 12.1.4.2. Products
- 12.1.4.3. Company Financials
- 12.1.4.4. SWOT Analysis
- 12.1.5 Paytabs
- 12.1.5.1. Company Overview
- 12.1.5.2. Products
- 12.1.5.3. Company Financials
- 12.1.5.4. SWOT Analysis
- 12.1.6 PalmPay Technology Co Ltd
- 12.1.6.1. Company Overview
- 12.1.6.2. Products
- 12.1.6.3. Company Financials
- 12.1.6.4. SWOT Analysis
- 12.1.7 Interswitch Ltd
- 12.1.7.1. Company Overview
- 12.1.7.2. Products
- 12.1.7.3. Company Financials
- 12.1.7.4. SWOT Analysis
- 12.1.8 Amazon com Inc *List Not Exhaustive
- 12.1.8.1. Company Overview
- 12.1.8.2. Products
- 12.1.8.3. Company Financials
- 12.1.8.4. SWOT Analysis
- 12.1.9 Apple Inc
- 12.1.9.1. Company Overview
- 12.1.9.2. Products
- 12.1.9.3. Company Financials
- 12.1.9.4. SWOT Analysis
- 12.1.10 Network International Holdings Plc
- 12.1.10.1. Company Overview
- 12.1.10.2. Products
- 12.1.10.3. Company Financials
- 12.1.10.4. SWOT Analysis
- 12.1.1 Safaricom Plc
- 12.2. Market Entropy
- 12.2.1 Company's Key Areas Served
- 12.2.2 Recent Developments
- 12.3. Company Market Share Analysis 2025
- 12.3.1 Top 5 Companies Market Share Analysis
- 12.3.2 Top 3 Companies Market Share Analysis
- 12.4. List of Potential Customers
- 13. Research Methodology
List of Figures
- Figure 1: Global MEA Payments Industry Revenue Breakdown (million, %) by Region 2025 & 2033
- Figure 2: North America MEA Payments Industry Revenue (million), by Mode of Payment 2025 & 2033
- Figure 3: North America MEA Payments Industry Revenue Share (%), by Mode of Payment 2025 & 2033
- Figure 4: North America MEA Payments Industry Revenue (million), by End-user Industry 2025 & 2033
- Figure 5: North America MEA Payments Industry Revenue Share (%), by End-user Industry 2025 & 2033
- Figure 6: North America MEA Payments Industry Revenue (million), by Country 2025 & 2033
- Figure 7: North America MEA Payments Industry Revenue Share (%), by Country 2025 & 2033
- Figure 8: South America MEA Payments Industry Revenue (million), by Mode of Payment 2025 & 2033
- Figure 9: South America MEA Payments Industry Revenue Share (%), by Mode of Payment 2025 & 2033
- Figure 10: South America MEA Payments Industry Revenue (million), by End-user Industry 2025 & 2033
- Figure 11: South America MEA Payments Industry Revenue Share (%), by End-user Industry 2025 & 2033
- Figure 12: South America MEA Payments Industry Revenue (million), by Country 2025 & 2033
- Figure 13: South America MEA Payments Industry Revenue Share (%), by Country 2025 & 2033
- Figure 14: Europe MEA Payments Industry Revenue (million), by Mode of Payment 2025 & 2033
- Figure 15: Europe MEA Payments Industry Revenue Share (%), by Mode of Payment 2025 & 2033
- Figure 16: Europe MEA Payments Industry Revenue (million), by End-user Industry 2025 & 2033
- Figure 17: Europe MEA Payments Industry Revenue Share (%), by End-user Industry 2025 & 2033
- Figure 18: Europe MEA Payments Industry Revenue (million), by Country 2025 & 2033
- Figure 19: Europe MEA Payments Industry Revenue Share (%), by Country 2025 & 2033
- Figure 20: Middle East & Africa MEA Payments Industry Revenue (million), by Mode of Payment 2025 & 2033
- Figure 21: Middle East & Africa MEA Payments Industry Revenue Share (%), by Mode of Payment 2025 & 2033
- Figure 22: Middle East & Africa MEA Payments Industry Revenue (million), by End-user Industry 2025 & 2033
- Figure 23: Middle East & Africa MEA Payments Industry Revenue Share (%), by End-user Industry 2025 & 2033
- Figure 24: Middle East & Africa MEA Payments Industry Revenue (million), by Country 2025 & 2033
- Figure 25: Middle East & Africa MEA Payments Industry Revenue Share (%), by Country 2025 & 2033
- Figure 26: Asia Pacific MEA Payments Industry Revenue (million), by Mode of Payment 2025 & 2033
- Figure 27: Asia Pacific MEA Payments Industry Revenue Share (%), by Mode of Payment 2025 & 2033
- Figure 28: Asia Pacific MEA Payments Industry Revenue (million), by End-user Industry 2025 & 2033
- Figure 29: Asia Pacific MEA Payments Industry Revenue Share (%), by End-user Industry 2025 & 2033
- Figure 30: Asia Pacific MEA Payments Industry Revenue (million), by Country 2025 & 2033
- Figure 31: Asia Pacific MEA Payments Industry Revenue Share (%), by Country 2025 & 2033
List of Tables
- Table 1: Global MEA Payments Industry Revenue million Forecast, by Mode of Payment 2020 & 2033
- Table 2: Global MEA Payments Industry Revenue million Forecast, by End-user Industry 2020 & 2033
- Table 3: Global MEA Payments Industry Revenue million Forecast, by Region 2020 & 2033
- Table 4: Global MEA Payments Industry Revenue million Forecast, by Mode of Payment 2020 & 2033
- Table 5: Global MEA Payments Industry Revenue million Forecast, by End-user Industry 2020 & 2033
- Table 6: Global MEA Payments Industry Revenue million Forecast, by Country 2020 & 2033
- Table 7: United States MEA Payments Industry Revenue (million) Forecast, by Application 2020 & 2033
- Table 8: Canada MEA Payments Industry Revenue (million) Forecast, by Application 2020 & 2033
- Table 9: Mexico MEA Payments Industry Revenue (million) Forecast, by Application 2020 & 2033
- Table 10: Global MEA Payments Industry Revenue million Forecast, by Mode of Payment 2020 & 2033
- Table 11: Global MEA Payments Industry Revenue million Forecast, by End-user Industry 2020 & 2033
- Table 12: Global MEA Payments Industry Revenue million Forecast, by Country 2020 & 2033
- Table 13: Brazil MEA Payments Industry Revenue (million) Forecast, by Application 2020 & 2033
- Table 14: Argentina MEA Payments Industry Revenue (million) Forecast, by Application 2020 & 2033
- Table 15: Rest of South America MEA Payments Industry Revenue (million) Forecast, by Application 2020 & 2033
- Table 16: Global MEA Payments Industry Revenue million Forecast, by Mode of Payment 2020 & 2033
- Table 17: Global MEA Payments Industry Revenue million Forecast, by End-user Industry 2020 & 2033
- Table 18: Global MEA Payments Industry Revenue million Forecast, by Country 2020 & 2033
- Table 19: United Kingdom MEA Payments Industry Revenue (million) Forecast, by Application 2020 & 2033
- Table 20: Germany MEA Payments Industry Revenue (million) Forecast, by Application 2020 & 2033
- Table 21: France MEA Payments Industry Revenue (million) Forecast, by Application 2020 & 2033
- Table 22: Italy MEA Payments Industry Revenue (million) Forecast, by Application 2020 & 2033
- Table 23: Spain MEA Payments Industry Revenue (million) Forecast, by Application 2020 & 2033
- Table 24: Russia MEA Payments Industry Revenue (million) Forecast, by Application 2020 & 2033
- Table 25: Benelux MEA Payments Industry Revenue (million) Forecast, by Application 2020 & 2033
- Table 26: Nordics MEA Payments Industry Revenue (million) Forecast, by Application 2020 & 2033
- Table 27: Rest of Europe MEA Payments Industry Revenue (million) Forecast, by Application 2020 & 2033
- Table 28: Global MEA Payments Industry Revenue million Forecast, by Mode of Payment 2020 & 2033
- Table 29: Global MEA Payments Industry Revenue million Forecast, by End-user Industry 2020 & 2033
- Table 30: Global MEA Payments Industry Revenue million Forecast, by Country 2020 & 2033
- Table 31: Turkey MEA Payments Industry Revenue (million) Forecast, by Application 2020 & 2033
- Table 32: Israel MEA Payments Industry Revenue (million) Forecast, by Application 2020 & 2033
- Table 33: GCC MEA Payments Industry Revenue (million) Forecast, by Application 2020 & 2033
- Table 34: North Africa MEA Payments Industry Revenue (million) Forecast, by Application 2020 & 2033
- Table 35: South Africa MEA Payments Industry Revenue (million) Forecast, by Application 2020 & 2033
- Table 36: Rest of Middle East & Africa MEA Payments Industry Revenue (million) Forecast, by Application 2020 & 2033
- Table 37: Global MEA Payments Industry Revenue million Forecast, by Mode of Payment 2020 & 2033
- Table 38: Global MEA Payments Industry Revenue million Forecast, by End-user Industry 2020 & 2033
- Table 39: Global MEA Payments Industry Revenue million Forecast, by Country 2020 & 2033
- Table 40: China MEA Payments Industry Revenue (million) Forecast, by Application 2020 & 2033
- Table 41: India MEA Payments Industry Revenue (million) Forecast, by Application 2020 & 2033
- Table 42: Japan MEA Payments Industry Revenue (million) Forecast, by Application 2020 & 2033
- Table 43: South Korea MEA Payments Industry Revenue (million) Forecast, by Application 2020 & 2033
- Table 44: ASEAN MEA Payments Industry Revenue (million) Forecast, by Application 2020 & 2033
- Table 45: Oceania MEA Payments Industry Revenue (million) Forecast, by Application 2020 & 2033
- Table 46: Rest of Asia Pacific MEA Payments Industry Revenue (million) Forecast, by Application 2020 & 2033
Frequently Asked Questions
1. What is the projected Compound Annual Growth Rate (CAGR) of the MEA Payments Industry?
The projected CAGR is approximately 7.1%.
2. Which companies are prominent players in the MEA Payments Industry?
Key companies in the market include Safaricom Plc, Opay, Visa Inc, Jumia, Paytabs, PalmPay Technology Co Ltd, Interswitch Ltd, Amazon com Inc *List Not Exhaustive, Apple Inc, Network International Holdings Plc.
3. What are the main segments of the MEA Payments Industry?
The market segments include Mode of Payment, End-user Industry.
4. Can you provide details about the market size?
The market size is estimated to be USD 20672.1 million as of 2022.
5. What are some drivers contributing to market growth?
Digital adoption is Accelerating the Payments Market in Middle East and Africa; Key Retailers and the Government are Promoting Market Digitization Through Activation Programs; Increase in Real-Time Payments. Particularly Buy Now Pay Later.
6. What are the notable trends driving market growth?
Digital adoption is Accelerating the Payments Market in Middle East and Africa.
7. Are there any restraints impacting market growth?
Lack of Standards in Applications and Initial Costs.
8. Can you provide examples of recent developments in the market?
June 2022 - The London Internet Exchange (LINX), one of the world's largest internet exchange points (IXPs), has announced a strategic partnership with IXAfrica, a Nairobi-based hyperscale data center provider. As part of the agreement, LINX will open a new interconnection facility in Nairobi, marking the company's first physical presence on the African continent.
9. What pricing options are available for accessing the report?
Pricing options include single-user, multi-user, and enterprise licenses priced at USD 4750, USD 4950, and USD 6800 respectively.
10. Is the market size provided in terms of value or volume?
The market size is provided in terms of value, measured in million.
11. Are there any specific market keywords associated with the report?
Yes, the market keyword associated with the report is "MEA Payments Industry," which aids in identifying and referencing the specific market segment covered.
12. How do I determine which pricing option suits my needs best?
The pricing options vary based on user requirements and access needs. Individual users may opt for single-user licenses, while businesses requiring broader access may choose multi-user or enterprise licenses for cost-effective access to the report.
13. Are there any additional resources or data provided in the MEA Payments Industry report?
While the report offers comprehensive insights, it's advisable to review the specific contents or supplementary materials provided to ascertain if additional resources or data are available.
14. How can I stay updated on further developments or reports in the MEA Payments Industry?
To stay informed about further developments, trends, and reports in the MEA Payments Industry, consider subscribing to industry newsletters, following relevant companies and organizations, or regularly checking reputable industry news sources and publications.
Methodology
Step 1 - Identification of Relevant Samples Size from Population Database


Step 2 - Approaches for Defining Global Market Size (Value, Volume* & Price*)

Note*: In applicable scenarios
Step 3 - Data Sources
Primary Research
- Web Analytics
- Survey Reports
- Research Institute
- Latest Research Reports
- Opinion Leaders
Secondary Research
- Annual Reports
- White Paper
- Latest Press Release
- Industry Association
- Paid Database
- Investor Presentations

Step 4 - Data Triangulation
Involves using different sources of information in order to increase the validity of a study
These sources are likely to be stakeholders in a program - participants, other researchers, program staff, other community members, and so on.
Then we put all data in single framework & apply various statistical tools to find out the dynamic on the market.
During the analysis stage, feedback from the stakeholder groups would be compared to determine areas of agreement as well as areas of divergence