

Key Insights
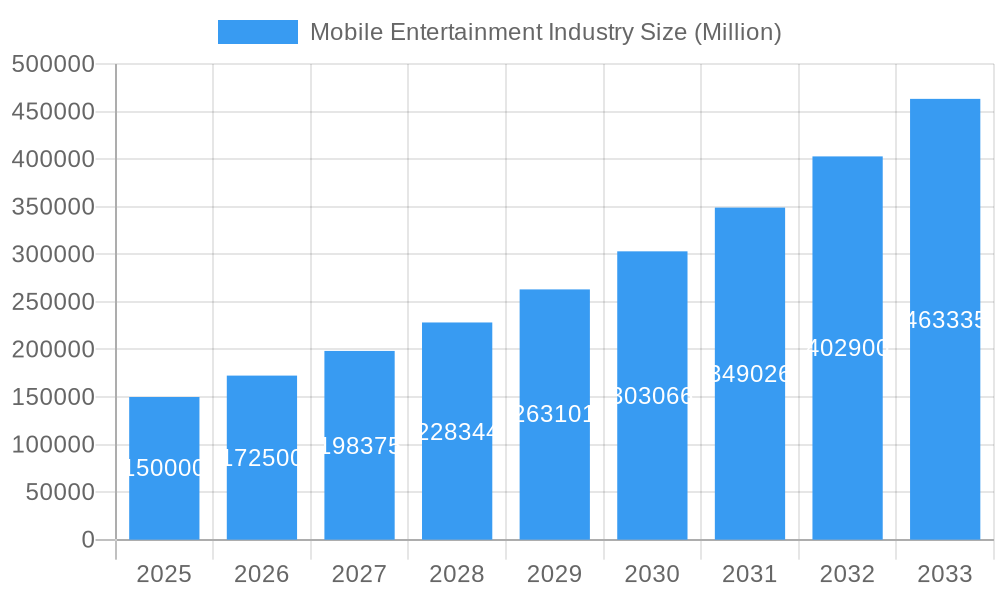
The mobile entertainment market, currently experiencing robust growth, is projected to reach a substantial size driven by several key factors. A compound annual growth rate (CAGR) of 15% from 2025 to 2033 suggests significant expansion. This growth is fueled by increasing smartphone penetration globally, particularly in emerging markets, and the rising affordability of mobile data plans. The proliferation of high-speed internet access further enhances the consumer experience, enabling seamless streaming of high-quality video and audio content, and supporting increasingly sophisticated mobile games. Consumer preferences are shifting towards mobile-first experiences, favoring convenient and on-demand entertainment options accessible anytime, anywhere. Key segments driving this expansion include mobile gaming, video streaming, and music streaming. The iOS and Android operating systems dominate the market, capturing the vast majority of users and influencing app development and platform strategies. Competition among established tech giants like Apple, Google, Facebook, and Netflix, along with specialized entertainment companies like Electronic Arts and Spotify, fuels innovation and provides diverse content choices to consumers. This competitive landscape fosters ongoing improvements in app quality, user experience, and content offerings.
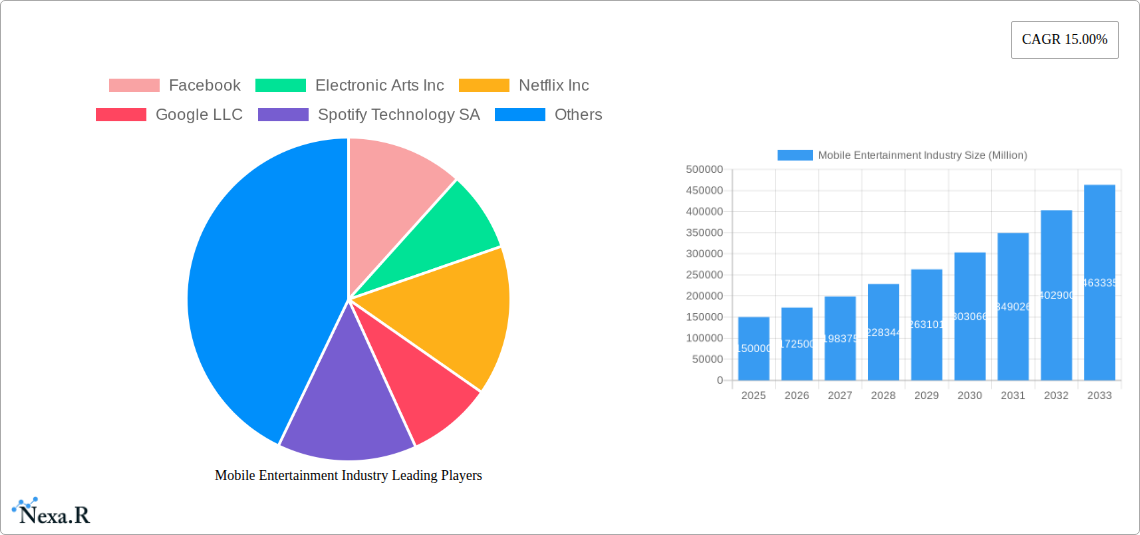
Mobile Entertainment Industry Market Size (In Billion)
The market segmentation by type (games, video, music) reflects the diverse entertainment preferences of consumers. While gaming remains a major revenue driver, the increasing popularity of mobile video and music streaming platforms is steadily expanding this sector. Geographic variations exist, with North America and Asia Pacific currently leading market share due to higher smartphone penetration and disposable income. However, other regions, like South America and parts of Africa, exhibit strong growth potential as mobile infrastructure and internet accessibility improve. Market restraints include concerns about data privacy, security risks, and the potential for content piracy. Addressing these challenges through robust security measures, transparent data policies, and effective anti-piracy strategies will be crucial for sustaining the market's positive trajectory. Future growth hinges on continuous innovation in content creation, user experience design, and advancements in mobile technology itself. The development of 5G and related technologies will likely further enhance the mobile entertainment experience, paving the way for advanced augmented reality (AR) and virtual reality (VR) gaming and streaming applications.
Mobile Entertainment Industry Company Market Share
This comprehensive report provides a detailed analysis of the mobile entertainment industry, encompassing market dynamics, growth trends, regional dominance, product landscape, key players, and future outlook. The study period covers 2019-2033, with a base year of 2025 and a forecast period of 2025-2033. This report is invaluable for industry professionals, investors, and strategic planners seeking to understand and capitalize on opportunities within this rapidly evolving sector. The report analyzes the parent market of digital entertainment and the child market of mobile entertainment, providing a nuanced understanding of market segmentation and growth drivers.
Mobile Entertainment Industry Market Dynamics & Structure
The mobile entertainment market is characterized by high competition, rapid technological advancements, and evolving regulatory landscapes. Market concentration is moderate, with a few major players holding significant market share, but a large number of smaller players also contributing. The market size in 2025 is estimated at xx Million units.
- Market Concentration: The top 5 players (Facebook, Google, Apple, Tencent, and Netflix) hold an estimated xx% market share in 2025.
- Technological Innovation: 5G rollout, advancements in AR/VR, and improved mobile processing power are key drivers. However, innovation barriers include high development costs and platform fragmentation.
- Regulatory Frameworks: Data privacy regulations (GDPR, CCPA) and content moderation policies significantly impact market operations. The impact of future regulations remains uncertain and will require continued monitoring.
- Competitive Product Substitutes: Traditional entertainment mediums (TV, consoles) pose some competition, but the convenience and accessibility of mobile platforms are key differentiators.
- End-User Demographics: The market is largely driven by millennials and Gen Z, with a significant portion of users in developing economies. The exact demographic split will vary by region and segment.
- M&A Trends: The industry has witnessed a significant number of mergers and acquisitions (M&A) deals in recent years (xx deals in the last 5 years, valued at an estimated xx Million units). This trend is expected to continue as larger companies consolidate their market position and expand their content libraries.
Mobile Entertainment Industry Growth Trends & Insights
The mobile entertainment market has experienced robust growth over the past few years, driven by factors such as increasing smartphone penetration, affordable data plans, and the rise of mobile-first content consumption. The market size is projected to reach xx Million units by 2033, exhibiting a Compound Annual Growth Rate (CAGR) of xx% during the forecast period (2025-2033). Market penetration continues to grow, particularly in emerging markets. Technological disruptions, such as the introduction of 5G and the expansion of cloud gaming services, are further fueling market expansion. Consumer behavior is shifting towards on-demand streaming and personalized content experiences. The shift to mobile-first consumption patterns influences content creation and distribution strategies.
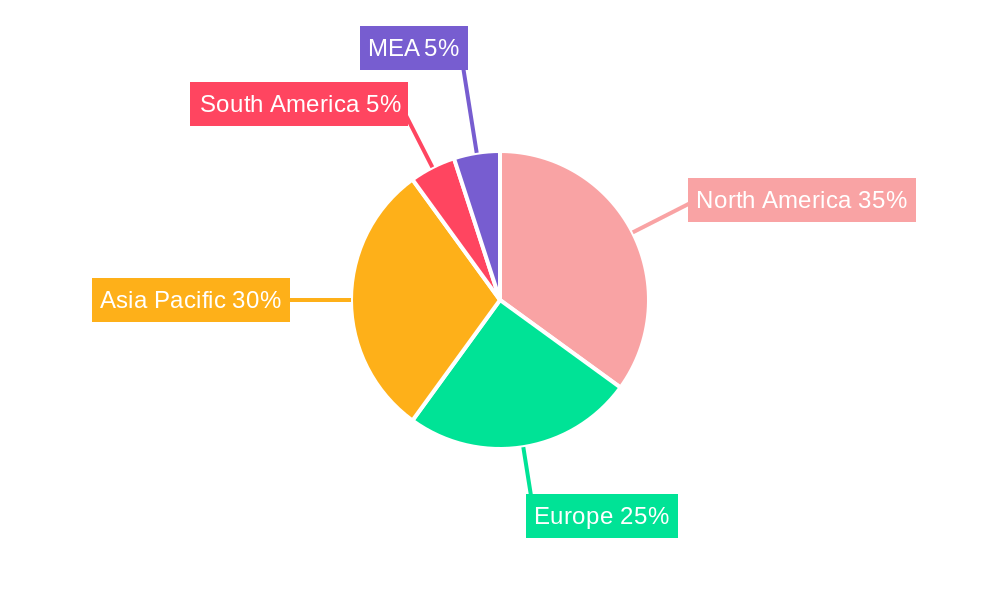
Dominant Regions, Countries, or Segments in Mobile Entertainment Industry
The Asia-Pacific region is expected to be the leading market for mobile entertainment, followed by North America and Europe. Within the segments:
By Type: Games maintain a significant market share (xx%), driven by the popularity of mobile gaming and e-sports. Video streaming (xx%) and music streaming (xx%) also contribute substantially.
By Operating System: Android holds the largest market share (xx%) due to its global reach and affordability, followed by iOS (xx%). The “Others” segment represents a smaller but growing share of the market (xx%).
Key Drivers: Strong smartphone penetration in Asia, rising disposable incomes, and favorable regulatory environments contribute to the dominance of these regions and segments. Specific economic policies supporting the digital economy in certain countries contribute to growth.
Mobile Entertainment Industry Product Landscape
The mobile entertainment landscape is characterized by a diverse range of products, including mobile games (casual, RPG, strategy), streaming services (video, music), social media platforms, and interactive content. New technologies like augmented reality (AR) and virtual reality (VR) are integrated into games and other entertainment experiences, adding to the user experience and pushing the boundaries of mobile entertainment. The market emphasizes personalized experiences, creating value through features like curated playlists, customized game challenges, and targeted advertising.
Key Drivers, Barriers & Challenges in Mobile Entertainment Industry
Key Drivers:
- The increasing penetration of smartphones and affordable data plans.
- The rising popularity of mobile gaming and e-sports.
- Technological advancements in AR/VR and 5G.
- The growing demand for personalized and on-demand content.
Challenges:
- Intense competition among numerous players.
- Data privacy concerns and regulatory scrutiny.
- The challenge of monetizing free-to-play games.
- Dependence on app store ecosystems and potential limitations imposed. The impact of this is estimated to be xx Million units per year.
Emerging Opportunities in Mobile Entertainment Industry
- Expansion into emerging markets with high smartphone penetration and growing internet access.
- Development of innovative content formats tailored to mobile devices (e.g., short-form video, interactive stories).
- Leveraging advancements in AR/VR to enhance user engagement.
- Exploring subscription models and integrating various entertainment services into a single platform.
Growth Accelerators in the Mobile Entertainment Industry Industry
The long-term growth of the mobile entertainment industry will be propelled by continued technological innovation, strategic partnerships between content creators and technology companies, and expansion into new markets. The strategic investment in personalized user experiences and the integration of various entertainment platforms will further propel growth.
Key Players Shaping the Mobile Entertainment Industry Market
Notable Milestones in Mobile Entertainment Industry Sector
- May 2021: NetEase launched new games and updates for over 60 products.
- July 2021: Gamestacy partnered with Beamable to launch Influencer, a social multiplayer mobile game.
- August 2021: Netflix began testing games within its Android app in Poland.
- September 2021: Netflix launched a free Android mobile plan in Kenya.
In-Depth Mobile Entertainment Industry Market Outlook
The mobile entertainment market is poised for continued expansion, driven by technological advancements, increasing smartphone adoption, and evolving consumer preferences. Strategic partnerships and investments in innovative content formats will play a vital role in shaping the future of the industry. The market's potential is significant, with ample opportunities for both established players and new entrants to capture market share and drive revenue growth.
Mobile Entertainment Industry Segmentation
-
1. Type
- 1.1. Games
- 1.2. Video
- 1.3. Music
-
2. Operating System
- 2.1. iOS
- 2.2. Android
- 2.3. Others
Mobile Entertainment Industry Segmentation By Geography
- 1. North America
- 2. Europe
- 3. Asia Pacific
- 4. Middle East and Africa
- 5. Latin America
Mobile Entertainment Industry Regional Market Share
Geographic Coverage of Mobile Entertainment Industry
Mobile Entertainment Industry REPORT HIGHLIGHTS
| Aspects | Details |
|---|---|
| Study Period | 2020-2034 |
| Base Year | 2025 |
| Estimated Year | 2026 |
| Forecast Period | 2026-2034 |
| Historical Period | 2020-2025 |
| Growth Rate | CAGR of 11.8% from 2020-2034 |
| Segmentation |
|
Table of Contents
- 1. Introduction
- 1.1. Research Scope
- 1.2. Market Segmentation
- 1.3. Research Objective
- 1.4. Definitions and Assumptions
- 2. Executive Summary
- 2.1. Market Snapshot
- 3. Market Dynamics
- 3.1. Market Drivers
- 3.2. Market Restrains
- 3.3. Market Trends
- 3.4. Market Opportunities
- 4. Market Factor Analysis
- 4.1. Porters Five Forces
- 4.1.1. Bargaining Power of Suppliers
- 4.1.2. Bargaining Power of Buyers
- 4.1.3. Threat of New Entrants
- 4.1.4. Threat of Substitutes
- 4.1.5. Competitive Rivalry
- 4.2. PESTEL analysis
- 4.3. BCG Analysis
- 4.3.1. Stars (High Growth, High Market Share)
- 4.3.2. Cash Cows (Low Growth, High Market Share)
- 4.3.3. Question Mark (High Growth, Low Market Share)
- 4.3.4. Dogs (Low Growth, Low Market Share)
- 4.4. Ansoff Matrix Analysis
- 4.5. Supply Chain Analysis
- 4.6. Regulatory Landscape
- 4.7. Current Market Potential and Opportunity Assessment (TAM–SAM–SOM Framework)
- 4.8. NRP Analyst Note
- 4.1. Porters Five Forces
- 5. Market Analysis, Insights and Forecast 2021-2033
- 5.1. Market Analysis, Insights and Forecast - by Type
- 5.1.1. Games
- 5.1.2. Video
- 5.1.3. Music
- 5.2. Market Analysis, Insights and Forecast - by Operating System
- 5.2.1. iOS
- 5.2.2. Android
- 5.2.3. Others
- 5.3. Market Analysis, Insights and Forecast - by Region
- 5.3.1. North America
- 5.3.2. Europe
- 5.3.3. Asia Pacific
- 5.3.4. Middle East and Africa
- 5.3.5. Latin America
- 5.1. Market Analysis, Insights and Forecast - by Type
- 6. Global Mobile Entertainment Industry Analysis, Insights and Forecast, 2021-2033
- 6.1. Market Analysis, Insights and Forecast - by Type
- 6.1.1. Games
- 6.1.2. Video
- 6.1.3. Music
- 6.2. Market Analysis, Insights and Forecast - by Operating System
- 6.2.1. iOS
- 6.2.2. Android
- 6.2.3. Others
- 6.1. Market Analysis, Insights and Forecast - by Type
- 7. North America Mobile Entertainment Industry Analysis, Insights and Forecast, 2020-2032
- 7.1. Market Analysis, Insights and Forecast - by Type
- 7.1.1. Games
- 7.1.2. Video
- 7.1.3. Music
- 7.2. Market Analysis, Insights and Forecast - by Operating System
- 7.2.1. iOS
- 7.2.2. Android
- 7.2.3. Others
- 7.1. Market Analysis, Insights and Forecast - by Type
- 8. Europe Mobile Entertainment Industry Analysis, Insights and Forecast, 2020-2032
- 8.1. Market Analysis, Insights and Forecast - by Type
- 8.1.1. Games
- 8.1.2. Video
- 8.1.3. Music
- 8.2. Market Analysis, Insights and Forecast - by Operating System
- 8.2.1. iOS
- 8.2.2. Android
- 8.2.3. Others
- 8.1. Market Analysis, Insights and Forecast - by Type
- 9. Asia Pacific Mobile Entertainment Industry Analysis, Insights and Forecast, 2020-2032
- 9.1. Market Analysis, Insights and Forecast - by Type
- 9.1.1. Games
- 9.1.2. Video
- 9.1.3. Music
- 9.2. Market Analysis, Insights and Forecast - by Operating System
- 9.2.1. iOS
- 9.2.2. Android
- 9.2.3. Others
- 9.1. Market Analysis, Insights and Forecast - by Type
- 10. Middle East and Africa Mobile Entertainment Industry Analysis, Insights and Forecast, 2020-2032
- 10.1. Market Analysis, Insights and Forecast - by Type
- 10.1.1. Games
- 10.1.2. Video
- 10.1.3. Music
- 10.2. Market Analysis, Insights and Forecast - by Operating System
- 10.2.1. iOS
- 10.2.2. Android
- 10.2.3. Others
- 10.1. Market Analysis, Insights and Forecast - by Type
- 11. Latin America Mobile Entertainment Industry Analysis, Insights and Forecast, 2020-2032
- 11.1. Market Analysis, Insights and Forecast - by Type
- 11.1.1. Games
- 11.1.2. Video
- 11.1.3. Music
- 11.2. Market Analysis, Insights and Forecast - by Operating System
- 11.2.1. iOS
- 11.2.2. Android
- 11.2.3. Others
- 11.1. Market Analysis, Insights and Forecast - by Type
- 12. Competitive Analysis
- 12.1. Company Profiles
- 12.1.1 Facebook
- 12.1.1.1. Company Overview
- 12.1.1.2. Products
- 12.1.1.3. Company Financials
- 12.1.1.4. SWOT Analysis
- 12.1.2 Electronic Arts Inc
- 12.1.2.1. Company Overview
- 12.1.2.2. Products
- 12.1.2.3. Company Financials
- 12.1.2.4. SWOT Analysis
- 12.1.3 Netflix Inc
- 12.1.3.1. Company Overview
- 12.1.3.2. Products
- 12.1.3.3. Company Financials
- 12.1.3.4. SWOT Analysis
- 12.1.4 Google LLC
- 12.1.4.1. Company Overview
- 12.1.4.2. Products
- 12.1.4.3. Company Financials
- 12.1.4.4. SWOT Analysis
- 12.1.5 Spotify Technology SA
- 12.1.5.1. Company Overview
- 12.1.5.2. Products
- 12.1.5.3. Company Financials
- 12.1.5.4. SWOT Analysis
- 12.1.6 Snap Inc
- 12.1.6.1. Company Overview
- 12.1.6.2. Products
- 12.1.6.3. Company Financials
- 12.1.6.4. SWOT Analysis
- 12.1.7 Rovio Entertainment Corporation
- 12.1.7.1. Company Overview
- 12.1.7.2. Products
- 12.1.7.3. Company Financials
- 12.1.7.4. SWOT Analysis
- 12.1.8 Tencent Holdings Limite
- 12.1.8.1. Company Overview
- 12.1.8.2. Products
- 12.1.8.3. Company Financials
- 12.1.8.4. SWOT Analysis
- 12.1.9 Amazon com Inc
- 12.1.9.1. Company Overview
- 12.1.9.2. Products
- 12.1.9.3. Company Financials
- 12.1.9.4. SWOT Analysis
- 12.1.10 OnMobile Global Limited
- 12.1.10.1. Company Overview
- 12.1.10.2. Products
- 12.1.10.3. Company Financials
- 12.1.10.4. SWOT Analysis
- 12.1.11 AT&T Inc
- 12.1.11.1. Company Overview
- 12.1.11.2. Products
- 12.1.11.3. Company Financials
- 12.1.11.4. SWOT Analysis
- 12.1.12 Apple Inc
- 12.1.12.1. Company Overview
- 12.1.12.2. Products
- 12.1.12.3. Company Financials
- 12.1.12.4. SWOT Analysis
- 12.1.1 Facebook
- 12.2. Market Entropy
- 12.2.1 Company's Key Areas Served
- 12.2.2 Recent Developments
- 12.3. Company Market Share Analysis 2025
- 12.3.1 Top 5 Companies Market Share Analysis
- 12.3.2 Top 3 Companies Market Share Analysis
- 12.4. List of Potential Customers
- 13. Research Methodology
List of Figures
- Figure 1: Global Mobile Entertainment Industry Revenue Breakdown (billion, %) by Region 2025 & 2033
- Figure 2: Global Mobile Entertainment Industry Volume Breakdown (K Unit, %) by Region 2025 & 2033
- Figure 3: North America Mobile Entertainment Industry Revenue (billion), by Type 2025 & 2033
- Figure 4: North America Mobile Entertainment Industry Volume (K Unit), by Type 2025 & 2033
- Figure 5: North America Mobile Entertainment Industry Revenue Share (%), by Type 2025 & 2033
- Figure 6: North America Mobile Entertainment Industry Volume Share (%), by Type 2025 & 2033
- Figure 7: North America Mobile Entertainment Industry Revenue (billion), by Operating System 2025 & 2033
- Figure 8: North America Mobile Entertainment Industry Volume (K Unit), by Operating System 2025 & 2033
- Figure 9: North America Mobile Entertainment Industry Revenue Share (%), by Operating System 2025 & 2033
- Figure 10: North America Mobile Entertainment Industry Volume Share (%), by Operating System 2025 & 2033
- Figure 11: North America Mobile Entertainment Industry Revenue (billion), by Country 2025 & 2033
- Figure 12: North America Mobile Entertainment Industry Volume (K Unit), by Country 2025 & 2033
- Figure 13: North America Mobile Entertainment Industry Revenue Share (%), by Country 2025 & 2033
- Figure 14: North America Mobile Entertainment Industry Volume Share (%), by Country 2025 & 2033
- Figure 15: Europe Mobile Entertainment Industry Revenue (billion), by Type 2025 & 2033
- Figure 16: Europe Mobile Entertainment Industry Volume (K Unit), by Type 2025 & 2033
- Figure 17: Europe Mobile Entertainment Industry Revenue Share (%), by Type 2025 & 2033
- Figure 18: Europe Mobile Entertainment Industry Volume Share (%), by Type 2025 & 2033
- Figure 19: Europe Mobile Entertainment Industry Revenue (billion), by Operating System 2025 & 2033
- Figure 20: Europe Mobile Entertainment Industry Volume (K Unit), by Operating System 2025 & 2033
- Figure 21: Europe Mobile Entertainment Industry Revenue Share (%), by Operating System 2025 & 2033
- Figure 22: Europe Mobile Entertainment Industry Volume Share (%), by Operating System 2025 & 2033
- Figure 23: Europe Mobile Entertainment Industry Revenue (billion), by Country 2025 & 2033
- Figure 24: Europe Mobile Entertainment Industry Volume (K Unit), by Country 2025 & 2033
- Figure 25: Europe Mobile Entertainment Industry Revenue Share (%), by Country 2025 & 2033
- Figure 26: Europe Mobile Entertainment Industry Volume Share (%), by Country 2025 & 2033
- Figure 27: Asia Pacific Mobile Entertainment Industry Revenue (billion), by Type 2025 & 2033
- Figure 28: Asia Pacific Mobile Entertainment Industry Volume (K Unit), by Type 2025 & 2033
- Figure 29: Asia Pacific Mobile Entertainment Industry Revenue Share (%), by Type 2025 & 2033
- Figure 30: Asia Pacific Mobile Entertainment Industry Volume Share (%), by Type 2025 & 2033
- Figure 31: Asia Pacific Mobile Entertainment Industry Revenue (billion), by Operating System 2025 & 2033
- Figure 32: Asia Pacific Mobile Entertainment Industry Volume (K Unit), by Operating System 2025 & 2033
- Figure 33: Asia Pacific Mobile Entertainment Industry Revenue Share (%), by Operating System 2025 & 2033
- Figure 34: Asia Pacific Mobile Entertainment Industry Volume Share (%), by Operating System 2025 & 2033
- Figure 35: Asia Pacific Mobile Entertainment Industry Revenue (billion), by Country 2025 & 2033
- Figure 36: Asia Pacific Mobile Entertainment Industry Volume (K Unit), by Country 2025 & 2033
- Figure 37: Asia Pacific Mobile Entertainment Industry Revenue Share (%), by Country 2025 & 2033
- Figure 38: Asia Pacific Mobile Entertainment Industry Volume Share (%), by Country 2025 & 2033
- Figure 39: Middle East and Africa Mobile Entertainment Industry Revenue (billion), by Type 2025 & 2033
- Figure 40: Middle East and Africa Mobile Entertainment Industry Volume (K Unit), by Type 2025 & 2033
- Figure 41: Middle East and Africa Mobile Entertainment Industry Revenue Share (%), by Type 2025 & 2033
- Figure 42: Middle East and Africa Mobile Entertainment Industry Volume Share (%), by Type 2025 & 2033
- Figure 43: Middle East and Africa Mobile Entertainment Industry Revenue (billion), by Operating System 2025 & 2033
- Figure 44: Middle East and Africa Mobile Entertainment Industry Volume (K Unit), by Operating System 2025 & 2033
- Figure 45: Middle East and Africa Mobile Entertainment Industry Revenue Share (%), by Operating System 2025 & 2033
- Figure 46: Middle East and Africa Mobile Entertainment Industry Volume Share (%), by Operating System 2025 & 2033
- Figure 47: Middle East and Africa Mobile Entertainment Industry Revenue (billion), by Country 2025 & 2033
- Figure 48: Middle East and Africa Mobile Entertainment Industry Volume (K Unit), by Country 2025 & 2033
- Figure 49: Middle East and Africa Mobile Entertainment Industry Revenue Share (%), by Country 2025 & 2033
- Figure 50: Middle East and Africa Mobile Entertainment Industry Volume Share (%), by Country 2025 & 2033
- Figure 51: Latin America Mobile Entertainment Industry Revenue (billion), by Type 2025 & 2033
- Figure 52: Latin America Mobile Entertainment Industry Volume (K Unit), by Type 2025 & 2033
- Figure 53: Latin America Mobile Entertainment Industry Revenue Share (%), by Type 2025 & 2033
- Figure 54: Latin America Mobile Entertainment Industry Volume Share (%), by Type 2025 & 2033
- Figure 55: Latin America Mobile Entertainment Industry Revenue (billion), by Operating System 2025 & 2033
- Figure 56: Latin America Mobile Entertainment Industry Volume (K Unit), by Operating System 2025 & 2033
- Figure 57: Latin America Mobile Entertainment Industry Revenue Share (%), by Operating System 2025 & 2033
- Figure 58: Latin America Mobile Entertainment Industry Volume Share (%), by Operating System 2025 & 2033
- Figure 59: Latin America Mobile Entertainment Industry Revenue (billion), by Country 2025 & 2033
- Figure 60: Latin America Mobile Entertainment Industry Volume (K Unit), by Country 2025 & 2033
- Figure 61: Latin America Mobile Entertainment Industry Revenue Share (%), by Country 2025 & 2033
- Figure 62: Latin America Mobile Entertainment Industry Volume Share (%), by Country 2025 & 2033
List of Tables
- Table 1: Global Mobile Entertainment Industry Revenue billion Forecast, by Type 2020 & 2033
- Table 2: Global Mobile Entertainment Industry Volume K Unit Forecast, by Type 2020 & 2033
- Table 3: Global Mobile Entertainment Industry Revenue billion Forecast, by Operating System 2020 & 2033
- Table 4: Global Mobile Entertainment Industry Volume K Unit Forecast, by Operating System 2020 & 2033
- Table 5: Global Mobile Entertainment Industry Revenue billion Forecast, by Region 2020 & 2033
- Table 6: Global Mobile Entertainment Industry Volume K Unit Forecast, by Region 2020 & 2033
- Table 7: Global Mobile Entertainment Industry Revenue billion Forecast, by Type 2020 & 2033
- Table 8: Global Mobile Entertainment Industry Volume K Unit Forecast, by Type 2020 & 2033
- Table 9: Global Mobile Entertainment Industry Revenue billion Forecast, by Operating System 2020 & 2033
- Table 10: Global Mobile Entertainment Industry Volume K Unit Forecast, by Operating System 2020 & 2033
- Table 11: Global Mobile Entertainment Industry Revenue billion Forecast, by Country 2020 & 2033
- Table 12: Global Mobile Entertainment Industry Volume K Unit Forecast, by Country 2020 & 2033
- Table 13: Global Mobile Entertainment Industry Revenue billion Forecast, by Type 2020 & 2033
- Table 14: Global Mobile Entertainment Industry Volume K Unit Forecast, by Type 2020 & 2033
- Table 15: Global Mobile Entertainment Industry Revenue billion Forecast, by Operating System 2020 & 2033
- Table 16: Global Mobile Entertainment Industry Volume K Unit Forecast, by Operating System 2020 & 2033
- Table 17: Global Mobile Entertainment Industry Revenue billion Forecast, by Country 2020 & 2033
- Table 18: Global Mobile Entertainment Industry Volume K Unit Forecast, by Country 2020 & 2033
- Table 19: Global Mobile Entertainment Industry Revenue billion Forecast, by Type 2020 & 2033
- Table 20: Global Mobile Entertainment Industry Volume K Unit Forecast, by Type 2020 & 2033
- Table 21: Global Mobile Entertainment Industry Revenue billion Forecast, by Operating System 2020 & 2033
- Table 22: Global Mobile Entertainment Industry Volume K Unit Forecast, by Operating System 2020 & 2033
- Table 23: Global Mobile Entertainment Industry Revenue billion Forecast, by Country 2020 & 2033
- Table 24: Global Mobile Entertainment Industry Volume K Unit Forecast, by Country 2020 & 2033
- Table 25: Global Mobile Entertainment Industry Revenue billion Forecast, by Type 2020 & 2033
- Table 26: Global Mobile Entertainment Industry Volume K Unit Forecast, by Type 2020 & 2033
- Table 27: Global Mobile Entertainment Industry Revenue billion Forecast, by Operating System 2020 & 2033
- Table 28: Global Mobile Entertainment Industry Volume K Unit Forecast, by Operating System 2020 & 2033
- Table 29: Global Mobile Entertainment Industry Revenue billion Forecast, by Country 2020 & 2033
- Table 30: Global Mobile Entertainment Industry Volume K Unit Forecast, by Country 2020 & 2033
- Table 31: Global Mobile Entertainment Industry Revenue billion Forecast, by Type 2020 & 2033
- Table 32: Global Mobile Entertainment Industry Volume K Unit Forecast, by Type 2020 & 2033
- Table 33: Global Mobile Entertainment Industry Revenue billion Forecast, by Operating System 2020 & 2033
- Table 34: Global Mobile Entertainment Industry Volume K Unit Forecast, by Operating System 2020 & 2033
- Table 35: Global Mobile Entertainment Industry Revenue billion Forecast, by Country 2020 & 2033
- Table 36: Global Mobile Entertainment Industry Volume K Unit Forecast, by Country 2020 & 2033
Frequently Asked Questions
1. What is the projected Compound Annual Growth Rate (CAGR) of the Mobile Entertainment Industry?
The projected CAGR is approximately 11.8%.
2. Which companies are prominent players in the Mobile Entertainment Industry?
Key companies in the market include Facebook, Electronic Arts Inc, Netflix Inc, Google LLC, Spotify Technology SA, Snap Inc, Rovio Entertainment Corporation, Tencent Holdings Limite, Amazon com Inc, OnMobile Global Limited, AT&T Inc, Apple Inc.
3. What are the main segments of the Mobile Entertainment Industry?
The market segments include Type, Operating System.
4. Can you provide details about the market size?
The market size is estimated to be USD 187.4 billion as of 2022.
5. What are some drivers contributing to market growth?
Growing penetration of smartphones across the globe; Growth in mobile network accessibility in recent years such as 4G and 5G.
6. What are the notable trends driving market growth?
Increasing Adoption of Subscription video-on-demand (SVOD).
7. Are there any restraints impacting market growth?
Paid version of some applications can challenge further penetration.
8. Can you provide examples of recent developments in the market?
September 2021 - In Kenya, Netflix is releasing a new free Android mobile plan that will allow users to watch a limited selection of its repertoire, including full seasons of certain shows. The Netflix mobile plan for Android allows users to join up without having to submit any financial information.
9. What pricing options are available for accessing the report?
Pricing options include single-user, multi-user, and enterprise licenses priced at USD 4750, USD 5250, and USD 8750 respectively.
10. Is the market size provided in terms of value or volume?
The market size is provided in terms of value, measured in billion and volume, measured in K Unit.
11. Are there any specific market keywords associated with the report?
Yes, the market keyword associated with the report is "Mobile Entertainment Industry," which aids in identifying and referencing the specific market segment covered.
12. How do I determine which pricing option suits my needs best?
The pricing options vary based on user requirements and access needs. Individual users may opt for single-user licenses, while businesses requiring broader access may choose multi-user or enterprise licenses for cost-effective access to the report.
13. Are there any additional resources or data provided in the Mobile Entertainment Industry report?
While the report offers comprehensive insights, it's advisable to review the specific contents or supplementary materials provided to ascertain if additional resources or data are available.
14. How can I stay updated on further developments or reports in the Mobile Entertainment Industry?
To stay informed about further developments, trends, and reports in the Mobile Entertainment Industry, consider subscribing to industry newsletters, following relevant companies and organizations, or regularly checking reputable industry news sources and publications.
Methodology
Step 1 - Identification of Relevant Samples Size from Population Database


Step 2 - Approaches for Defining Global Market Size (Value, Volume* & Price*)

Note*: In applicable scenarios
Step 3 - Data Sources
Primary Research
- Web Analytics
- Survey Reports
- Research Institute
- Latest Research Reports
- Opinion Leaders
Secondary Research
- Annual Reports
- White Paper
- Latest Press Release
- Industry Association
- Paid Database
- Investor Presentations

Step 4 - Data Triangulation
Involves using different sources of information in order to increase the validity of a study
These sources are likely to be stakeholders in a program - participants, other researchers, program staff, other community members, and so on.
Then we put all data in single framework & apply various statistical tools to find out the dynamic on the market.
During the analysis stage, feedback from the stakeholder groups would be compared to determine areas of agreement as well as areas of divergence