

Key Insights
The Multi Layer Power Inductors market is poised for significant expansion, with a projected market size of 2801 million by 2025 and an anticipated Compound Annual Growth Rate (CAGR) of 7.5% through 2033. This robust growth is primarily driven by the escalating demand for advanced electronic components across a multitude of industries. The proliferation of sophisticated Information Technology equipment, including high-performance computing and data storage solutions, necessitates increasingly efficient power management systems, where multi-layer power inductors play a crucial role. Furthermore, the rapid evolution of the telecommunications sector, particularly with the rollout of 5G infrastructure, requires compact and high-performance inductors for signal integrity and power delivery in base stations and mobile devices. The automotive industry's transition towards electric vehicles (EVs) and advanced driver-assistance systems (ADAS) further fuels this demand, as these applications rely heavily on specialized inductors for power conversion and battery management. Key trends include the miniaturization of components to meet the space constraints of modern devices and the development of inductors with higher current handling capabilities and improved thermal performance.
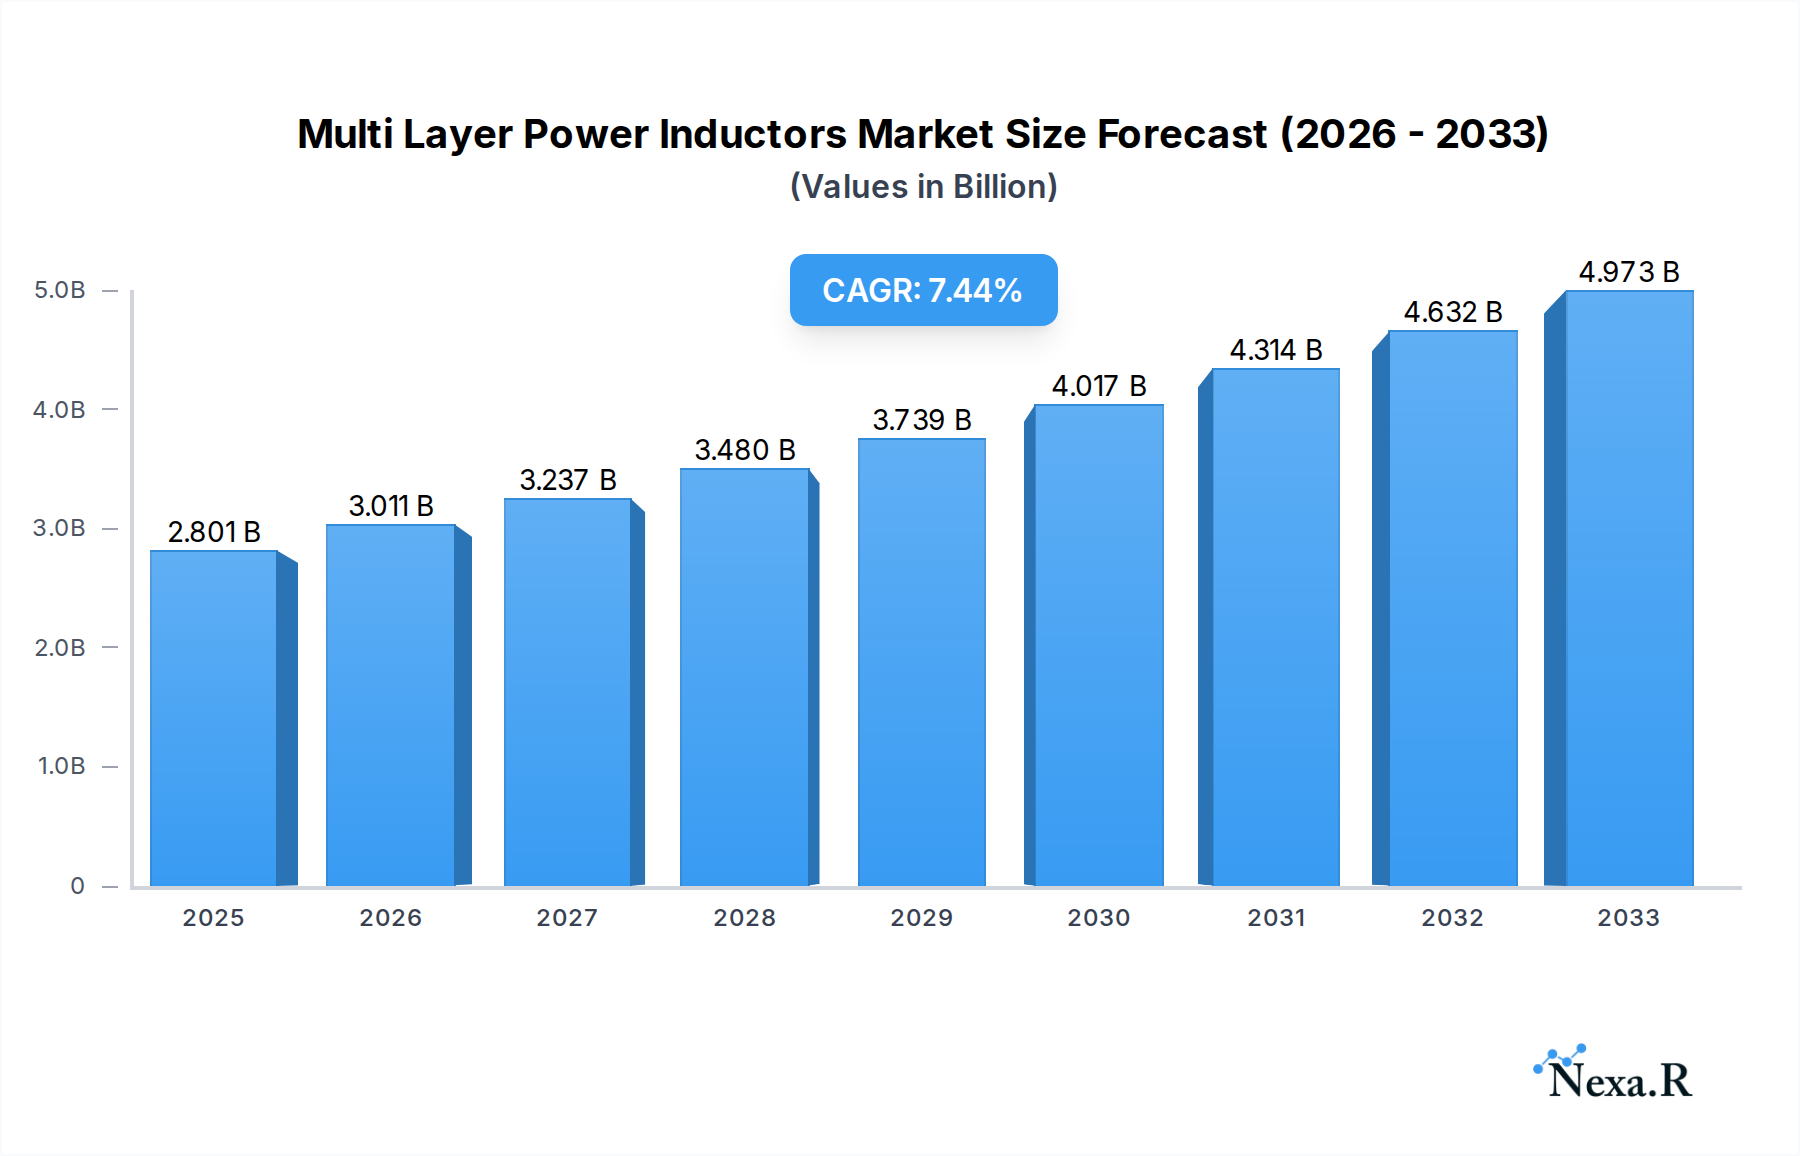
Multi Layer Power Inductors Market Size (In Billion)
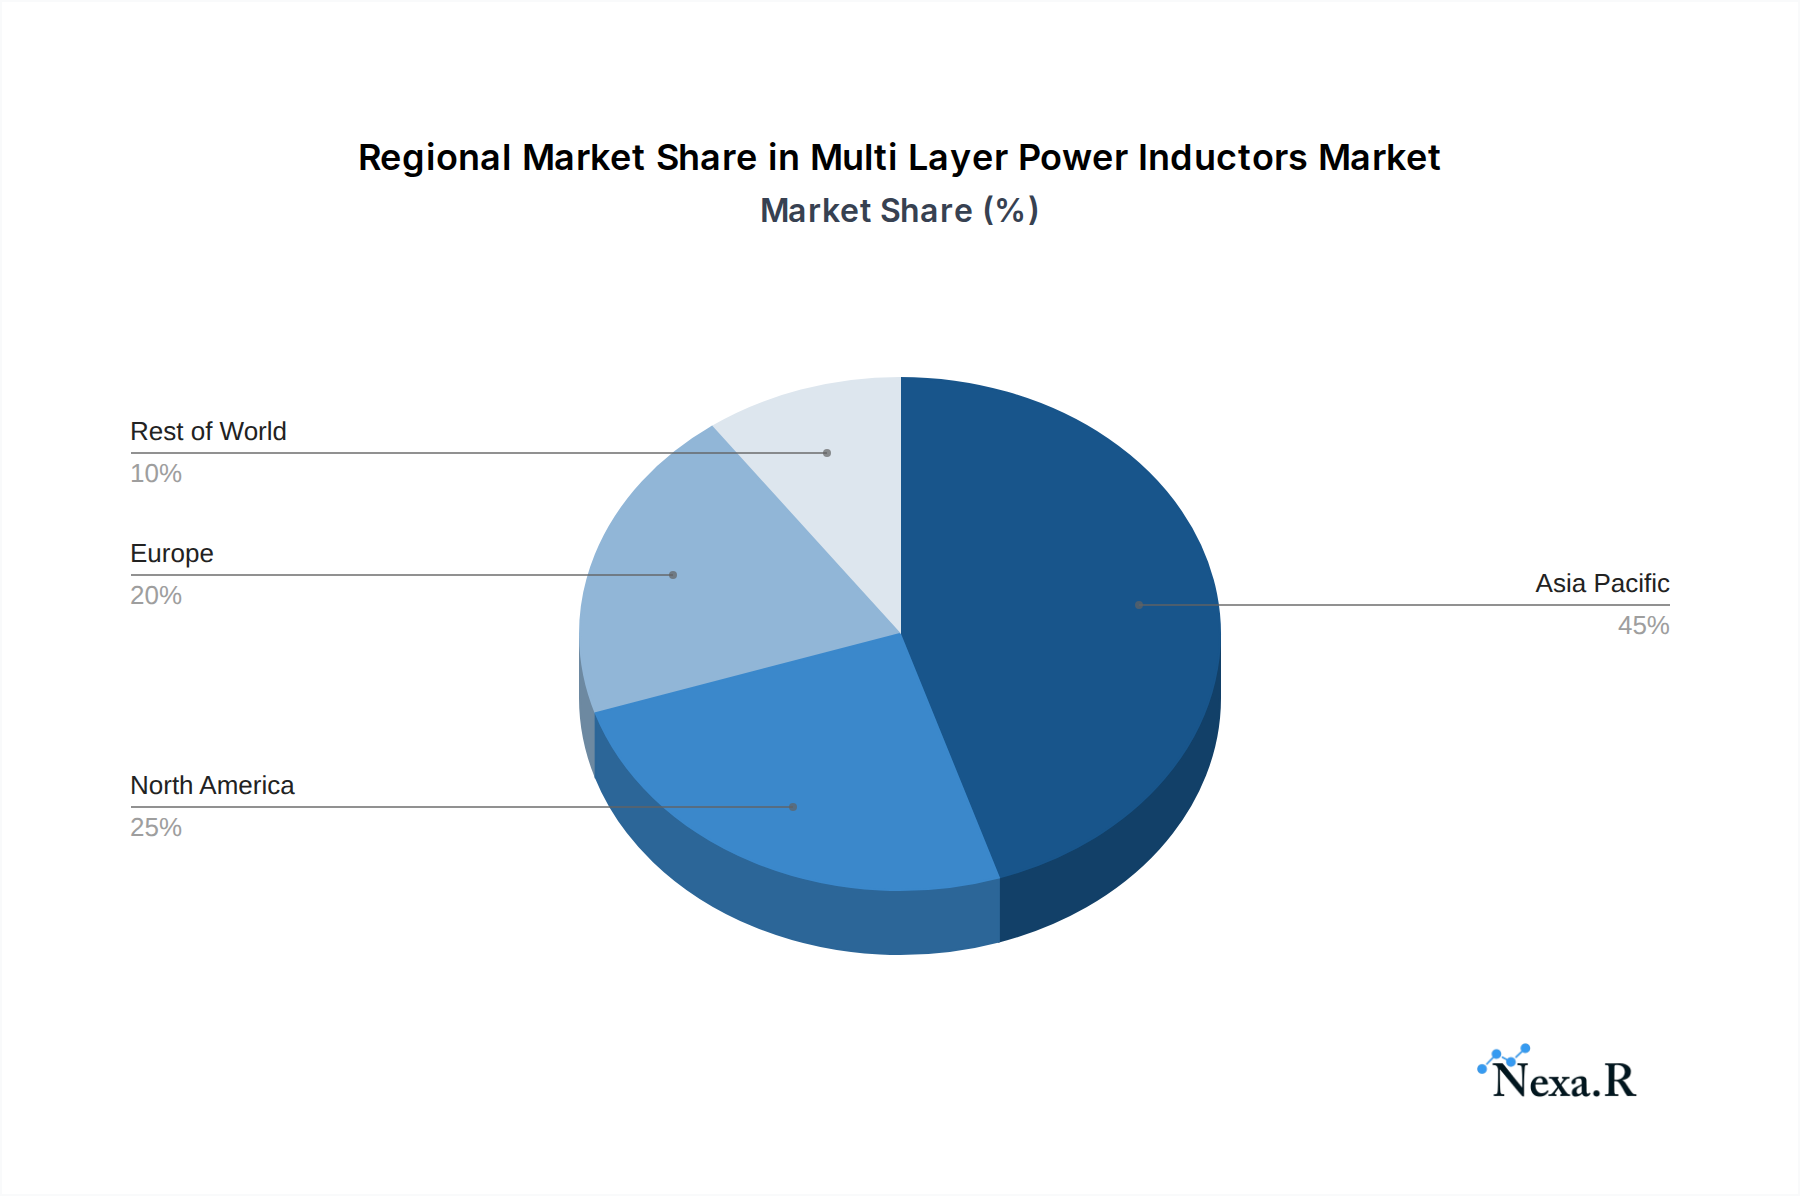
The market is segmented by application, with Information Technology Equipments and Telecommunications expected to represent the largest shares due to their continuous innovation cycles and high volume production. Automotive Electronics is another significant growth area, driven by the electrification trend. The Ferrite Material segment is anticipated to dominate in terms of type, owing to its cost-effectiveness and suitable magnetic properties for a wide range of power inductor applications, although advancements in Ceramic Materials are also expected to capture a growing share due to their ability to handle higher frequencies and temperatures. Despite the strong growth trajectory, the market faces certain restraints, such as the increasing cost of raw materials and the complexity involved in the manufacturing process, which can impact profitability. However, the continuous innovation from leading companies like TDK, Murata, and Sunlord Electronics, focusing on developing novel materials and enhanced product designs, is expected to mitigate these challenges and sustain the market's upward momentum. Regional analysis indicates Asia Pacific, particularly China, as the dominant market, driven by its strong manufacturing base and burgeoning electronics industry, followed by North America and Europe.

Multi Layer Power Inductors Company Market Share
Multi Layer Power Inductors Market Report: Comprehensive Analysis & Future Outlook (2019-2033)
This in-depth market research report provides an exhaustive analysis of the global Multi Layer Power Inductors market, a critical component in modern electronic systems. Covering the historical period from 2019 to 2024, with a base year of 2025 and a forecast period extending to 2033, this report offers unparalleled insights into market dynamics, growth drivers, regional dominance, product landscape, and key player strategies. Leveraging high-traffic keywords such as "multi-layer power inductors," "SMD inductors," "miniature power inductors," "high-frequency inductors," and "DC-DC converters," this report is optimized for search engine visibility, ensuring it reaches industry professionals actively seeking this specialized information. We meticulously examine parent and child markets to deliver a holistic view, quantifying market size and evolution in millions of units.
Multi Layer Power Inductors Market Dynamics & Structure
The Multi Layer Power Inductors market is characterized by a moderate level of concentration, with a few key global players dominating production and innovation. Technological innovation is primarily driven by the demand for smaller form factors, higher power density, increased efficiency, and enhanced thermal management. Regulatory frameworks, particularly those related to environmental compliance (e.g., RoHS, REACH) and electromagnetic interference (EMI) standards, play a significant role in shaping product development and market entry. Competitive product substitutes include traditional wound inductors and alternative passive components, though multi-layer technology offers distinct advantages in size and manufacturing cost for specific applications. End-user demographics are increasingly shifting towards miniaturization and higher performance requirements, particularly in the portable electronics and automotive sectors. Mergers and acquisitions (M&A) are a recurring theme, with companies aiming to consolidate market share, expand their product portfolios, and gain access to new technologies. For instance, the past five years have seen approximately 3-5 significant M&A deals annually within the broader passive components sector, with a notable number involving companies specializing in advanced inductor technologies. Innovation barriers include the complexity of achieving higher inductance values in smaller volumes and the stringent material science requirements for high-frequency applications.
- Market Concentration: Moderate to High, with top 5 players holding an estimated 60-70% of the global market share.
- Technological Innovation Drivers: Miniaturization, increased power density, higher efficiency, improved thermal performance, enhanced EMI shielding.
- Regulatory Frameworks: RoHS, REACH, FCC, CE certifications driving product compliance.
- Competitive Product Substitutes: Wound inductors, planar transformers, integration with other passive components.
- End-User Demographics: Growing demand from consumer electronics, telecommunications, automotive, and industrial sectors.
- M&A Trends: Strategic acquisitions for technology integration and market expansion are prevalent.
Multi Layer Power Inductors Growth Trends & Insights
The global Multi Layer Power Inductors market is projected to experience robust growth driven by the insatiable demand for miniaturized and highly efficient electronic devices across various industries. The market size, which stood at an estimated 1,500 million units in 2024, is anticipated to expand at a Compound Annual Growth Rate (CAGR) of approximately 7.5% during the forecast period of 2025-2033, reaching an estimated 2,800 million units by 2033. This growth trajectory is fueled by the increasing adoption of multi-layer power inductors in power management circuits of smartphones, wearable devices, and advanced computing systems, where space constraints are paramount. The telecommunications sector, with its continuous evolution towards 5G and beyond, requires highly efficient and compact power solutions, further bolstering demand. Automotive electronics, including advanced driver-assistance systems (ADAS), infotainment, and electric vehicle (EV) powertrains, represent a significant and rapidly growing segment. The trend towards electrification in vehicles necessitates a greater number of power inductors for battery management, charging systems, and motor control. Technological disruptions, such as advancements in ceramic and magnetic metal materials, are enabling the development of inductors with superior performance characteristics, including higher saturation current and lower DC resistance. Consumer behavior shifts towards more powerful yet energy-efficient portable devices also indirectly contribute to the market's expansion. Market penetration of multi-layer power inductors within the broader inductor market is steadily increasing, estimated at 45% in 2024 and projected to reach 55% by 2033 due to their inherent advantages in size, cost-effectiveness for mass production, and suitable performance for a wide range of applications.
- Market Size Evolution: From approximately 1,500 million units (2024) to an estimated 2,800 million units (2033).
- CAGR: Approximately 7.5% during the forecast period (2025-2033).
- Adoption Rates: Increasing adoption in consumer electronics, telecommunications, and automotive sectors.
- Technological Disruptions: Advancements in materials leading to higher performance and efficiency.
- Consumer Behavior Shifts: Demand for smaller, more powerful, and energy-efficient electronic devices.
- Market Penetration: Expected to grow from 45% (2024) to 55% (2033) of the total inductor market.
Dominant Regions, Countries, or Segments in Multi Layer Power Inductors
The Information Technology Equipments segment, driven by the relentless innovation in consumer electronics, particularly smartphones, tablets, laptops, and gaming consoles, is the dominant force in the global Multi Layer Power Inductors market. This segment is projected to account for an estimated 35% of the total market volume by 2025, with a projected growth to over 40% by 2033. Asia Pacific, led by China, South Korea, and Taiwan, stands out as the leading region due to its expansive manufacturing base for these devices and its role as a global hub for electronics production. Economic policies promoting high-tech manufacturing, significant government investment in R&D, and a vast domestic consumer market contribute to this regional dominance.
Within the Type classification, Ferrite Material based multi-layer power inductors are currently the most prevalent, estimated to capture 55% of the market share in 2025, owing to their cost-effectiveness and suitability for a wide range of frequencies. However, the Magnetic Metal Material segment is experiencing rapid growth, projected to increase its market share from 30% in 2025 to 40% by 2033, driven by the demand for higher current handling capabilities and reduced core losses in high-performance applications such as automotive electronics and industrial power supplies.
- Dominant Application Segment: Information Technology Equipments, accounting for approximately 35% market share in 2025.
- Key Drivers: Smartphone miniaturization, growth of IoT devices, advanced computing.
- Dominant Region: Asia Pacific, particularly China, South Korea, and Taiwan.
- Key Drivers: Extensive manufacturing infrastructure, government support for electronics, large consumer base.
- Dominant Type Segment (Current): Ferrite Material, holding an estimated 55% market share in 2025.
- Drivers: Cost-effectiveness, broad frequency range applicability.
- Fastest Growing Type Segment: Magnetic Metal Material, with projected share increase from 30% (2025) to 40% (2033).
- Drivers: High current capability, low core losses, demand in automotive and industrial sectors.
Multi Layer Power Inductors Product Landscape
The product landscape of Multi Layer Power Inductors is characterized by continuous innovation focused on enhancing performance while reducing size. Manufacturers are developing ultra-compact SMD (Surface Mount Device) inductors with improved power handling capabilities and reduced DC resistance, crucial for space-constrained applications like mobile devices and wearables. Advanced materials, including high-performance ferrites and magnetic metal composites, are enabling higher inductance values and saturation currents in smaller footprints. Unique selling propositions include monolithic construction for increased reliability, superior thermal management capabilities, and optimized designs for high-frequency DC-DC conversion circuits. Technological advancements are also centered on developing inductors with lower parasitic capacitance and higher Q factors, leading to improved power conversion efficiency.
Key Drivers, Barriers & Challenges in Multi Layer Power Inductors
Key Drivers: The primary forces propelling the Multi Layer Power Inductors market include the ever-increasing demand for miniaturized and portable electronic devices, the proliferation of 5G infrastructure, and the rapid growth of the automotive electronics sector, particularly in electric vehicles (EVs). Technological advancements in materials science enabling higher performance and efficiency also act as significant growth accelerators.
Barriers & Challenges: Supply chain volatility, particularly concerning raw material availability and pricing, poses a significant challenge. Regulatory hurdles related to environmental compliance and electromagnetic compatibility (EMC) standards can impact development cycles and costs. Intense competition among manufacturers, leading to price pressures, is also a key restraint. Achieving higher inductance values in progressively smaller form factors remains a technical challenge, requiring sophisticated material engineering and manufacturing processes.
Emerging Opportunities in Multi Layer Power Inductors
Emerging opportunities lie in the burgeoning field of advanced driver-assistance systems (ADAS) and autonomous driving, which require sophisticated power management solutions. The expansion of the Internet of Things (IoT) ecosystem, encompassing smart home devices, industrial sensors, and wearable technology, presents a vast untapped market for compact and efficient power inductors. Furthermore, the growing trend towards energy harvesting and wireless power transfer technologies opens new avenues for specialized multi-layer power inductor designs. Evolving consumer preferences for longer battery life and faster charging in portable electronics also create demand for higher-performance components.
Growth Accelerators in the Multi Layer Power Inductors Industry
Several catalysts are accelerating the long-term growth of the Multi Layer Power Inductors industry. Technological breakthroughs in magnetic materials and manufacturing techniques are enabling the creation of inductors with unprecedented power density and efficiency. Strategic partnerships between inductor manufacturers and semiconductor companies are fostering co-design and optimization of power management solutions, leading to faster product development cycles. Market expansion into emerging economies, driven by increasing disposable incomes and the adoption of advanced electronics, also plays a crucial role. The continued growth of electric and hybrid vehicles, coupled with the demand for sophisticated power electronics in industrial automation, are significant growth engines.
Key Players Shaping the Multi Layer Power Inductors Market
- TDK
- Sunlord Electronics
- Murata
- Shenzhen Zhenhua Fu Electronics
- Chilisin Electronics (YAGEO)
- Vishay
- Kyocera
- Taiyo Yuden
- Fenghua Advanced Technology
- KOHER (Shanghai) Electronic
- Laird Technologies
- Microgate Technology
- INPAQ Technology
- Darfon Electronics
Notable Milestones in Multi Layer Power Inductors Sector
- 2019: Introduction of ultra-low profile (ULP) multi-layer power inductors by key manufacturers, targeting smartphone applications.
- 2020: Increased focus on developing magnetic metal material based inductors for higher current applications in automotive.
- 2021: Significant advancements in simulation and design tools enabling faster product development cycles.
- 2022: Expansion of production capacity by leading players to meet rising demand from EV and 5G infrastructure.
- 2023: Launch of next-generation multi-layer inductors with improved thermal performance and reliability for harsh environments.
- 2024: Growing emphasis on sustainable manufacturing processes and materials within the industry.
In-Depth Multi Layer Power Inductors Market Outlook
The future outlook for the Multi Layer Power Inductors market remains exceptionally bright, driven by the pervasive trend towards electronic miniaturization and increased functionality across all sectors. Continued investment in research and development for advanced materials and manufacturing processes will unlock new performance benchmarks. Strategic collaborations, particularly in the automotive and telecommunications industries, will further accelerate innovation and market penetration. Untapped markets in developing regions and the emergence of novel applications such as advanced robotics and smart grid technologies present significant growth opportunities. The industry is poised for sustained expansion, fueled by technological advancements and the insatiable global demand for sophisticated electronic components.
Multi Layer Power Inductors Segmentation
-
1. Application
- 1.1. Information Technology Equipments
- 1.2. Telecommunications
- 1.3. Radar Detectors
- 1.4. Automotive Electronics
- 1.5. Keyless Remote Systems
- 1.6. Others
-
2. Type
- 2.1. Magnetic Metal Material
- 2.2. Ferrite Material
- 2.3. Ceramic Material
- 2.4. Others
Multi Layer Power Inductors Segmentation By Geography
-
1. North America
- 1.1. United States
- 1.2. Canada
- 1.3. Mexico
-
2. South America
- 2.1. Brazil
- 2.2. Argentina
- 2.3. Rest of South America
-
3. Europe
- 3.1. United Kingdom
- 3.2. Germany
- 3.3. France
- 3.4. Italy
- 3.5. Spain
- 3.6. Russia
- 3.7. Benelux
- 3.8. Nordics
- 3.9. Rest of Europe
-
4. Middle East & Africa
- 4.1. Turkey
- 4.2. Israel
- 4.3. GCC
- 4.4. North Africa
- 4.5. South Africa
- 4.6. Rest of Middle East & Africa
-
5. Asia Pacific
- 5.1. China
- 5.2. India
- 5.3. Japan
- 5.4. South Korea
- 5.5. ASEAN
- 5.6. Oceania
- 5.7. Rest of Asia Pacific
Multi Layer Power Inductors Regional Market Share
Geographic Coverage of Multi Layer Power Inductors
Multi Layer Power Inductors REPORT HIGHLIGHTS
| Aspects | Details |
|---|---|
| Study Period | 2020-2034 |
| Base Year | 2025 |
| Estimated Year | 2026 |
| Forecast Period | 2026-2034 |
| Historical Period | 2020-2025 |
| Growth Rate | CAGR of 7.5% from 2020-2034 |
| Segmentation |
|
Table of Contents
- 1. Introduction
- 1.1. Research Scope
- 1.2. Market Segmentation
- 1.3. Research Methodology
- 1.4. Definitions and Assumptions
- 2. Executive Summary
- 2.1. Introduction
- 3. Market Dynamics
- 3.1. Introduction
- 3.2. Market Drivers
- 3.3. Market Restrains
- 3.4. Market Trends
- 4. Market Factor Analysis
- 4.1. Porters Five Forces
- 4.2. Supply/Value Chain
- 4.3. PESTEL analysis
- 4.4. Market Entropy
- 4.5. Patent/Trademark Analysis
- 5. Global Multi Layer Power Inductors Analysis, Insights and Forecast, 2020-2032
- 5.1. Market Analysis, Insights and Forecast - by Application
- 5.1.1. Information Technology Equipments
- 5.1.2. Telecommunications
- 5.1.3. Radar Detectors
- 5.1.4. Automotive Electronics
- 5.1.5. Keyless Remote Systems
- 5.1.6. Others
- 5.2. Market Analysis, Insights and Forecast - by Type
- 5.2.1. Magnetic Metal Material
- 5.2.2. Ferrite Material
- 5.2.3. Ceramic Material
- 5.2.4. Others
- 5.3. Market Analysis, Insights and Forecast - by Region
- 5.3.1. North America
- 5.3.2. South America
- 5.3.3. Europe
- 5.3.4. Middle East & Africa
- 5.3.5. Asia Pacific
- 5.1. Market Analysis, Insights and Forecast - by Application
- 6. North America Multi Layer Power Inductors Analysis, Insights and Forecast, 2020-2032
- 6.1. Market Analysis, Insights and Forecast - by Application
- 6.1.1. Information Technology Equipments
- 6.1.2. Telecommunications
- 6.1.3. Radar Detectors
- 6.1.4. Automotive Electronics
- 6.1.5. Keyless Remote Systems
- 6.1.6. Others
- 6.2. Market Analysis, Insights and Forecast - by Type
- 6.2.1. Magnetic Metal Material
- 6.2.2. Ferrite Material
- 6.2.3. Ceramic Material
- 6.2.4. Others
- 6.1. Market Analysis, Insights and Forecast - by Application
- 7. South America Multi Layer Power Inductors Analysis, Insights and Forecast, 2020-2032
- 7.1. Market Analysis, Insights and Forecast - by Application
- 7.1.1. Information Technology Equipments
- 7.1.2. Telecommunications
- 7.1.3. Radar Detectors
- 7.1.4. Automotive Electronics
- 7.1.5. Keyless Remote Systems
- 7.1.6. Others
- 7.2. Market Analysis, Insights and Forecast - by Type
- 7.2.1. Magnetic Metal Material
- 7.2.2. Ferrite Material
- 7.2.3. Ceramic Material
- 7.2.4. Others
- 7.1. Market Analysis, Insights and Forecast - by Application
- 8. Europe Multi Layer Power Inductors Analysis, Insights and Forecast, 2020-2032
- 8.1. Market Analysis, Insights and Forecast - by Application
- 8.1.1. Information Technology Equipments
- 8.1.2. Telecommunications
- 8.1.3. Radar Detectors
- 8.1.4. Automotive Electronics
- 8.1.5. Keyless Remote Systems
- 8.1.6. Others
- 8.2. Market Analysis, Insights and Forecast - by Type
- 8.2.1. Magnetic Metal Material
- 8.2.2. Ferrite Material
- 8.2.3. Ceramic Material
- 8.2.4. Others
- 8.1. Market Analysis, Insights and Forecast - by Application
- 9. Middle East & Africa Multi Layer Power Inductors Analysis, Insights and Forecast, 2020-2032
- 9.1. Market Analysis, Insights and Forecast - by Application
- 9.1.1. Information Technology Equipments
- 9.1.2. Telecommunications
- 9.1.3. Radar Detectors
- 9.1.4. Automotive Electronics
- 9.1.5. Keyless Remote Systems
- 9.1.6. Others
- 9.2. Market Analysis, Insights and Forecast - by Type
- 9.2.1. Magnetic Metal Material
- 9.2.2. Ferrite Material
- 9.2.3. Ceramic Material
- 9.2.4. Others
- 9.1. Market Analysis, Insights and Forecast - by Application
- 10. Asia Pacific Multi Layer Power Inductors Analysis, Insights and Forecast, 2020-2032
- 10.1. Market Analysis, Insights and Forecast - by Application
- 10.1.1. Information Technology Equipments
- 10.1.2. Telecommunications
- 10.1.3. Radar Detectors
- 10.1.4. Automotive Electronics
- 10.1.5. Keyless Remote Systems
- 10.1.6. Others
- 10.2. Market Analysis, Insights and Forecast - by Type
- 10.2.1. Magnetic Metal Material
- 10.2.2. Ferrite Material
- 10.2.3. Ceramic Material
- 10.2.4. Others
- 10.1. Market Analysis, Insights and Forecast - by Application
- 11. Competitive Analysis
- 11.1. Global Market Share Analysis 2025
- 11.2. Company Profiles
- 11.2.1 TDK
- 11.2.1.1. Overview
- 11.2.1.2. Products
- 11.2.1.3. SWOT Analysis
- 11.2.1.4. Recent Developments
- 11.2.1.5. Financials (Based on Availability)
- 11.2.2 Sunlord Electronics
- 11.2.2.1. Overview
- 11.2.2.2. Products
- 11.2.2.3. SWOT Analysis
- 11.2.2.4. Recent Developments
- 11.2.2.5. Financials (Based on Availability)
- 11.2.3 Murata
- 11.2.3.1. Overview
- 11.2.3.2. Products
- 11.2.3.3. SWOT Analysis
- 11.2.3.4. Recent Developments
- 11.2.3.5. Financials (Based on Availability)
- 11.2.4 Shenzhen Zhenhua Fu Electronics
- 11.2.4.1. Overview
- 11.2.4.2. Products
- 11.2.4.3. SWOT Analysis
- 11.2.4.4. Recent Developments
- 11.2.4.5. Financials (Based on Availability)
- 11.2.5 Chilisin Electronics (YAGEO)
- 11.2.5.1. Overview
- 11.2.5.2. Products
- 11.2.5.3. SWOT Analysis
- 11.2.5.4. Recent Developments
- 11.2.5.5. Financials (Based on Availability)
- 11.2.6 Vishay
- 11.2.6.1. Overview
- 11.2.6.2. Products
- 11.2.6.3. SWOT Analysis
- 11.2.6.4. Recent Developments
- 11.2.6.5. Financials (Based on Availability)
- 11.2.7 Kyocera
- 11.2.7.1. Overview
- 11.2.7.2. Products
- 11.2.7.3. SWOT Analysis
- 11.2.7.4. Recent Developments
- 11.2.7.5. Financials (Based on Availability)
- 11.2.8 Taiyo Yuden
- 11.2.8.1. Overview
- 11.2.8.2. Products
- 11.2.8.3. SWOT Analysis
- 11.2.8.4. Recent Developments
- 11.2.8.5. Financials (Based on Availability)
- 11.2.9 Fenghua Advanced Technology
- 11.2.9.1. Overview
- 11.2.9.2. Products
- 11.2.9.3. SWOT Analysis
- 11.2.9.4. Recent Developments
- 11.2.9.5. Financials (Based on Availability)
- 11.2.10 KOHER (Shanghai) Electronic
- 11.2.10.1. Overview
- 11.2.10.2. Products
- 11.2.10.3. SWOT Analysis
- 11.2.10.4. Recent Developments
- 11.2.10.5. Financials (Based on Availability)
- 11.2.11 Laird Technologies
- 11.2.11.1. Overview
- 11.2.11.2. Products
- 11.2.11.3. SWOT Analysis
- 11.2.11.4. Recent Developments
- 11.2.11.5. Financials (Based on Availability)
- 11.2.12 Microgate Technology
- 11.2.12.1. Overview
- 11.2.12.2. Products
- 11.2.12.3. SWOT Analysis
- 11.2.12.4. Recent Developments
- 11.2.12.5. Financials (Based on Availability)
- 11.2.13 INPAQ Technology
- 11.2.13.1. Overview
- 11.2.13.2. Products
- 11.2.13.3. SWOT Analysis
- 11.2.13.4. Recent Developments
- 11.2.13.5. Financials (Based on Availability)
- 11.2.14 Darfon Electronics
- 11.2.14.1. Overview
- 11.2.14.2. Products
- 11.2.14.3. SWOT Analysis
- 11.2.14.4. Recent Developments
- 11.2.14.5. Financials (Based on Availability)
- 11.2.1 TDK
List of Figures
- Figure 1: Global Multi Layer Power Inductors Revenue Breakdown (million, %) by Region 2025 & 2033
- Figure 2: Global Multi Layer Power Inductors Volume Breakdown (K, %) by Region 2025 & 2033
- Figure 3: North America Multi Layer Power Inductors Revenue (million), by Application 2025 & 2033
- Figure 4: North America Multi Layer Power Inductors Volume (K), by Application 2025 & 2033
- Figure 5: North America Multi Layer Power Inductors Revenue Share (%), by Application 2025 & 2033
- Figure 6: North America Multi Layer Power Inductors Volume Share (%), by Application 2025 & 2033
- Figure 7: North America Multi Layer Power Inductors Revenue (million), by Type 2025 & 2033
- Figure 8: North America Multi Layer Power Inductors Volume (K), by Type 2025 & 2033
- Figure 9: North America Multi Layer Power Inductors Revenue Share (%), by Type 2025 & 2033
- Figure 10: North America Multi Layer Power Inductors Volume Share (%), by Type 2025 & 2033
- Figure 11: North America Multi Layer Power Inductors Revenue (million), by Country 2025 & 2033
- Figure 12: North America Multi Layer Power Inductors Volume (K), by Country 2025 & 2033
- Figure 13: North America Multi Layer Power Inductors Revenue Share (%), by Country 2025 & 2033
- Figure 14: North America Multi Layer Power Inductors Volume Share (%), by Country 2025 & 2033
- Figure 15: South America Multi Layer Power Inductors Revenue (million), by Application 2025 & 2033
- Figure 16: South America Multi Layer Power Inductors Volume (K), by Application 2025 & 2033
- Figure 17: South America Multi Layer Power Inductors Revenue Share (%), by Application 2025 & 2033
- Figure 18: South America Multi Layer Power Inductors Volume Share (%), by Application 2025 & 2033
- Figure 19: South America Multi Layer Power Inductors Revenue (million), by Type 2025 & 2033
- Figure 20: South America Multi Layer Power Inductors Volume (K), by Type 2025 & 2033
- Figure 21: South America Multi Layer Power Inductors Revenue Share (%), by Type 2025 & 2033
- Figure 22: South America Multi Layer Power Inductors Volume Share (%), by Type 2025 & 2033
- Figure 23: South America Multi Layer Power Inductors Revenue (million), by Country 2025 & 2033
- Figure 24: South America Multi Layer Power Inductors Volume (K), by Country 2025 & 2033
- Figure 25: South America Multi Layer Power Inductors Revenue Share (%), by Country 2025 & 2033
- Figure 26: South America Multi Layer Power Inductors Volume Share (%), by Country 2025 & 2033
- Figure 27: Europe Multi Layer Power Inductors Revenue (million), by Application 2025 & 2033
- Figure 28: Europe Multi Layer Power Inductors Volume (K), by Application 2025 & 2033
- Figure 29: Europe Multi Layer Power Inductors Revenue Share (%), by Application 2025 & 2033
- Figure 30: Europe Multi Layer Power Inductors Volume Share (%), by Application 2025 & 2033
- Figure 31: Europe Multi Layer Power Inductors Revenue (million), by Type 2025 & 2033
- Figure 32: Europe Multi Layer Power Inductors Volume (K), by Type 2025 & 2033
- Figure 33: Europe Multi Layer Power Inductors Revenue Share (%), by Type 2025 & 2033
- Figure 34: Europe Multi Layer Power Inductors Volume Share (%), by Type 2025 & 2033
- Figure 35: Europe Multi Layer Power Inductors Revenue (million), by Country 2025 & 2033
- Figure 36: Europe Multi Layer Power Inductors Volume (K), by Country 2025 & 2033
- Figure 37: Europe Multi Layer Power Inductors Revenue Share (%), by Country 2025 & 2033
- Figure 38: Europe Multi Layer Power Inductors Volume Share (%), by Country 2025 & 2033
- Figure 39: Middle East & Africa Multi Layer Power Inductors Revenue (million), by Application 2025 & 2033
- Figure 40: Middle East & Africa Multi Layer Power Inductors Volume (K), by Application 2025 & 2033
- Figure 41: Middle East & Africa Multi Layer Power Inductors Revenue Share (%), by Application 2025 & 2033
- Figure 42: Middle East & Africa Multi Layer Power Inductors Volume Share (%), by Application 2025 & 2033
- Figure 43: Middle East & Africa Multi Layer Power Inductors Revenue (million), by Type 2025 & 2033
- Figure 44: Middle East & Africa Multi Layer Power Inductors Volume (K), by Type 2025 & 2033
- Figure 45: Middle East & Africa Multi Layer Power Inductors Revenue Share (%), by Type 2025 & 2033
- Figure 46: Middle East & Africa Multi Layer Power Inductors Volume Share (%), by Type 2025 & 2033
- Figure 47: Middle East & Africa Multi Layer Power Inductors Revenue (million), by Country 2025 & 2033
- Figure 48: Middle East & Africa Multi Layer Power Inductors Volume (K), by Country 2025 & 2033
- Figure 49: Middle East & Africa Multi Layer Power Inductors Revenue Share (%), by Country 2025 & 2033
- Figure 50: Middle East & Africa Multi Layer Power Inductors Volume Share (%), by Country 2025 & 2033
- Figure 51: Asia Pacific Multi Layer Power Inductors Revenue (million), by Application 2025 & 2033
- Figure 52: Asia Pacific Multi Layer Power Inductors Volume (K), by Application 2025 & 2033
- Figure 53: Asia Pacific Multi Layer Power Inductors Revenue Share (%), by Application 2025 & 2033
- Figure 54: Asia Pacific Multi Layer Power Inductors Volume Share (%), by Application 2025 & 2033
- Figure 55: Asia Pacific Multi Layer Power Inductors Revenue (million), by Type 2025 & 2033
- Figure 56: Asia Pacific Multi Layer Power Inductors Volume (K), by Type 2025 & 2033
- Figure 57: Asia Pacific Multi Layer Power Inductors Revenue Share (%), by Type 2025 & 2033
- Figure 58: Asia Pacific Multi Layer Power Inductors Volume Share (%), by Type 2025 & 2033
- Figure 59: Asia Pacific Multi Layer Power Inductors Revenue (million), by Country 2025 & 2033
- Figure 60: Asia Pacific Multi Layer Power Inductors Volume (K), by Country 2025 & 2033
- Figure 61: Asia Pacific Multi Layer Power Inductors Revenue Share (%), by Country 2025 & 2033
- Figure 62: Asia Pacific Multi Layer Power Inductors Volume Share (%), by Country 2025 & 2033
List of Tables
- Table 1: Global Multi Layer Power Inductors Revenue million Forecast, by Application 2020 & 2033
- Table 2: Global Multi Layer Power Inductors Volume K Forecast, by Application 2020 & 2033
- Table 3: Global Multi Layer Power Inductors Revenue million Forecast, by Type 2020 & 2033
- Table 4: Global Multi Layer Power Inductors Volume K Forecast, by Type 2020 & 2033
- Table 5: Global Multi Layer Power Inductors Revenue million Forecast, by Region 2020 & 2033
- Table 6: Global Multi Layer Power Inductors Volume K Forecast, by Region 2020 & 2033
- Table 7: Global Multi Layer Power Inductors Revenue million Forecast, by Application 2020 & 2033
- Table 8: Global Multi Layer Power Inductors Volume K Forecast, by Application 2020 & 2033
- Table 9: Global Multi Layer Power Inductors Revenue million Forecast, by Type 2020 & 2033
- Table 10: Global Multi Layer Power Inductors Volume K Forecast, by Type 2020 & 2033
- Table 11: Global Multi Layer Power Inductors Revenue million Forecast, by Country 2020 & 2033
- Table 12: Global Multi Layer Power Inductors Volume K Forecast, by Country 2020 & 2033
- Table 13: United States Multi Layer Power Inductors Revenue (million) Forecast, by Application 2020 & 2033
- Table 14: United States Multi Layer Power Inductors Volume (K) Forecast, by Application 2020 & 2033
- Table 15: Canada Multi Layer Power Inductors Revenue (million) Forecast, by Application 2020 & 2033
- Table 16: Canada Multi Layer Power Inductors Volume (K) Forecast, by Application 2020 & 2033
- Table 17: Mexico Multi Layer Power Inductors Revenue (million) Forecast, by Application 2020 & 2033
- Table 18: Mexico Multi Layer Power Inductors Volume (K) Forecast, by Application 2020 & 2033
- Table 19: Global Multi Layer Power Inductors Revenue million Forecast, by Application 2020 & 2033
- Table 20: Global Multi Layer Power Inductors Volume K Forecast, by Application 2020 & 2033
- Table 21: Global Multi Layer Power Inductors Revenue million Forecast, by Type 2020 & 2033
- Table 22: Global Multi Layer Power Inductors Volume K Forecast, by Type 2020 & 2033
- Table 23: Global Multi Layer Power Inductors Revenue million Forecast, by Country 2020 & 2033
- Table 24: Global Multi Layer Power Inductors Volume K Forecast, by Country 2020 & 2033
- Table 25: Brazil Multi Layer Power Inductors Revenue (million) Forecast, by Application 2020 & 2033
- Table 26: Brazil Multi Layer Power Inductors Volume (K) Forecast, by Application 2020 & 2033
- Table 27: Argentina Multi Layer Power Inductors Revenue (million) Forecast, by Application 2020 & 2033
- Table 28: Argentina Multi Layer Power Inductors Volume (K) Forecast, by Application 2020 & 2033
- Table 29: Rest of South America Multi Layer Power Inductors Revenue (million) Forecast, by Application 2020 & 2033
- Table 30: Rest of South America Multi Layer Power Inductors Volume (K) Forecast, by Application 2020 & 2033
- Table 31: Global Multi Layer Power Inductors Revenue million Forecast, by Application 2020 & 2033
- Table 32: Global Multi Layer Power Inductors Volume K Forecast, by Application 2020 & 2033
- Table 33: Global Multi Layer Power Inductors Revenue million Forecast, by Type 2020 & 2033
- Table 34: Global Multi Layer Power Inductors Volume K Forecast, by Type 2020 & 2033
- Table 35: Global Multi Layer Power Inductors Revenue million Forecast, by Country 2020 & 2033
- Table 36: Global Multi Layer Power Inductors Volume K Forecast, by Country 2020 & 2033
- Table 37: United Kingdom Multi Layer Power Inductors Revenue (million) Forecast, by Application 2020 & 2033
- Table 38: United Kingdom Multi Layer Power Inductors Volume (K) Forecast, by Application 2020 & 2033
- Table 39: Germany Multi Layer Power Inductors Revenue (million) Forecast, by Application 2020 & 2033
- Table 40: Germany Multi Layer Power Inductors Volume (K) Forecast, by Application 2020 & 2033
- Table 41: France Multi Layer Power Inductors Revenue (million) Forecast, by Application 2020 & 2033
- Table 42: France Multi Layer Power Inductors Volume (K) Forecast, by Application 2020 & 2033
- Table 43: Italy Multi Layer Power Inductors Revenue (million) Forecast, by Application 2020 & 2033
- Table 44: Italy Multi Layer Power Inductors Volume (K) Forecast, by Application 2020 & 2033
- Table 45: Spain Multi Layer Power Inductors Revenue (million) Forecast, by Application 2020 & 2033
- Table 46: Spain Multi Layer Power Inductors Volume (K) Forecast, by Application 2020 & 2033
- Table 47: Russia Multi Layer Power Inductors Revenue (million) Forecast, by Application 2020 & 2033
- Table 48: Russia Multi Layer Power Inductors Volume (K) Forecast, by Application 2020 & 2033
- Table 49: Benelux Multi Layer Power Inductors Revenue (million) Forecast, by Application 2020 & 2033
- Table 50: Benelux Multi Layer Power Inductors Volume (K) Forecast, by Application 2020 & 2033
- Table 51: Nordics Multi Layer Power Inductors Revenue (million) Forecast, by Application 2020 & 2033
- Table 52: Nordics Multi Layer Power Inductors Volume (K) Forecast, by Application 2020 & 2033
- Table 53: Rest of Europe Multi Layer Power Inductors Revenue (million) Forecast, by Application 2020 & 2033
- Table 54: Rest of Europe Multi Layer Power Inductors Volume (K) Forecast, by Application 2020 & 2033
- Table 55: Global Multi Layer Power Inductors Revenue million Forecast, by Application 2020 & 2033
- Table 56: Global Multi Layer Power Inductors Volume K Forecast, by Application 2020 & 2033
- Table 57: Global Multi Layer Power Inductors Revenue million Forecast, by Type 2020 & 2033
- Table 58: Global Multi Layer Power Inductors Volume K Forecast, by Type 2020 & 2033
- Table 59: Global Multi Layer Power Inductors Revenue million Forecast, by Country 2020 & 2033
- Table 60: Global Multi Layer Power Inductors Volume K Forecast, by Country 2020 & 2033
- Table 61: Turkey Multi Layer Power Inductors Revenue (million) Forecast, by Application 2020 & 2033
- Table 62: Turkey Multi Layer Power Inductors Volume (K) Forecast, by Application 2020 & 2033
- Table 63: Israel Multi Layer Power Inductors Revenue (million) Forecast, by Application 2020 & 2033
- Table 64: Israel Multi Layer Power Inductors Volume (K) Forecast, by Application 2020 & 2033
- Table 65: GCC Multi Layer Power Inductors Revenue (million) Forecast, by Application 2020 & 2033
- Table 66: GCC Multi Layer Power Inductors Volume (K) Forecast, by Application 2020 & 2033
- Table 67: North Africa Multi Layer Power Inductors Revenue (million) Forecast, by Application 2020 & 2033
- Table 68: North Africa Multi Layer Power Inductors Volume (K) Forecast, by Application 2020 & 2033
- Table 69: South Africa Multi Layer Power Inductors Revenue (million) Forecast, by Application 2020 & 2033
- Table 70: South Africa Multi Layer Power Inductors Volume (K) Forecast, by Application 2020 & 2033
- Table 71: Rest of Middle East & Africa Multi Layer Power Inductors Revenue (million) Forecast, by Application 2020 & 2033
- Table 72: Rest of Middle East & Africa Multi Layer Power Inductors Volume (K) Forecast, by Application 2020 & 2033
- Table 73: Global Multi Layer Power Inductors Revenue million Forecast, by Application 2020 & 2033
- Table 74: Global Multi Layer Power Inductors Volume K Forecast, by Application 2020 & 2033
- Table 75: Global Multi Layer Power Inductors Revenue million Forecast, by Type 2020 & 2033
- Table 76: Global Multi Layer Power Inductors Volume K Forecast, by Type 2020 & 2033
- Table 77: Global Multi Layer Power Inductors Revenue million Forecast, by Country 2020 & 2033
- Table 78: Global Multi Layer Power Inductors Volume K Forecast, by Country 2020 & 2033
- Table 79: China Multi Layer Power Inductors Revenue (million) Forecast, by Application 2020 & 2033
- Table 80: China Multi Layer Power Inductors Volume (K) Forecast, by Application 2020 & 2033
- Table 81: India Multi Layer Power Inductors Revenue (million) Forecast, by Application 2020 & 2033
- Table 82: India Multi Layer Power Inductors Volume (K) Forecast, by Application 2020 & 2033
- Table 83: Japan Multi Layer Power Inductors Revenue (million) Forecast, by Application 2020 & 2033
- Table 84: Japan Multi Layer Power Inductors Volume (K) Forecast, by Application 2020 & 2033
- Table 85: South Korea Multi Layer Power Inductors Revenue (million) Forecast, by Application 2020 & 2033
- Table 86: South Korea Multi Layer Power Inductors Volume (K) Forecast, by Application 2020 & 2033
- Table 87: ASEAN Multi Layer Power Inductors Revenue (million) Forecast, by Application 2020 & 2033
- Table 88: ASEAN Multi Layer Power Inductors Volume (K) Forecast, by Application 2020 & 2033
- Table 89: Oceania Multi Layer Power Inductors Revenue (million) Forecast, by Application 2020 & 2033
- Table 90: Oceania Multi Layer Power Inductors Volume (K) Forecast, by Application 2020 & 2033
- Table 91: Rest of Asia Pacific Multi Layer Power Inductors Revenue (million) Forecast, by Application 2020 & 2033
- Table 92: Rest of Asia Pacific Multi Layer Power Inductors Volume (K) Forecast, by Application 2020 & 2033
Frequently Asked Questions
1. What is the projected Compound Annual Growth Rate (CAGR) of the Multi Layer Power Inductors?
The projected CAGR is approximately 7.5%.
2. Which companies are prominent players in the Multi Layer Power Inductors?
Key companies in the market include TDK, Sunlord Electronics, Murata, Shenzhen Zhenhua Fu Electronics, Chilisin Electronics (YAGEO), Vishay, Kyocera, Taiyo Yuden, Fenghua Advanced Technology, KOHER (Shanghai) Electronic, Laird Technologies, Microgate Technology, INPAQ Technology, Darfon Electronics.
3. What are the main segments of the Multi Layer Power Inductors?
The market segments include Application, Type.
4. Can you provide details about the market size?
The market size is estimated to be USD 2801 million as of 2022.
5. What are some drivers contributing to market growth?
N/A
6. What are the notable trends driving market growth?
N/A
7. Are there any restraints impacting market growth?
N/A
8. Can you provide examples of recent developments in the market?
N/A
9. What pricing options are available for accessing the report?
Pricing options include single-user, multi-user, and enterprise licenses priced at USD 3950.00, USD 5925.00, and USD 7900.00 respectively.
10. Is the market size provided in terms of value or volume?
The market size is provided in terms of value, measured in million and volume, measured in K.
11. Are there any specific market keywords associated with the report?
Yes, the market keyword associated with the report is "Multi Layer Power Inductors," which aids in identifying and referencing the specific market segment covered.
12. How do I determine which pricing option suits my needs best?
The pricing options vary based on user requirements and access needs. Individual users may opt for single-user licenses, while businesses requiring broader access may choose multi-user or enterprise licenses for cost-effective access to the report.
13. Are there any additional resources or data provided in the Multi Layer Power Inductors report?
While the report offers comprehensive insights, it's advisable to review the specific contents or supplementary materials provided to ascertain if additional resources or data are available.
14. How can I stay updated on further developments or reports in the Multi Layer Power Inductors?
To stay informed about further developments, trends, and reports in the Multi Layer Power Inductors, consider subscribing to industry newsletters, following relevant companies and organizations, or regularly checking reputable industry news sources and publications.
Methodology
Step 1 - Identification of Relevant Samples Size from Population Database


Step 2 - Approaches for Defining Global Market Size (Value, Volume* & Price*)

Note*: In applicable scenarios
Step 3 - Data Sources
Primary Research
- Web Analytics
- Survey Reports
- Research Institute
- Latest Research Reports
- Opinion Leaders
Secondary Research
- Annual Reports
- White Paper
- Latest Press Release
- Industry Association
- Paid Database
- Investor Presentations

Step 4 - Data Triangulation
Involves using different sources of information in order to increase the validity of a study
These sources are likely to be stakeholders in a program - participants, other researchers, program staff, other community members, and so on.
Then we put all data in single framework & apply various statistical tools to find out the dynamic on the market.
During the analysis stage, feedback from the stakeholder groups would be compared to determine areas of agreement as well as areas of divergence