

Key Insights
The Next-Generation Sequencing (NGS) eDNA Biomonitoring market is poised for substantial growth, projected to reach $23.8 million in 2025 with a robust Compound Annual Growth Rate (CAGR) of 8.1% through 2033. This expansion is fueled by an increasing global emphasis on environmental conservation, biodiversity assessment, and regulatory compliance. NGS eDNA biomonitoring offers a highly sensitive and comprehensive method for detecting species presence and diversity from environmental samples like water, soil, and air, significantly surpassing traditional survey techniques in efficiency and accuracy. Key drivers include advancements in sequencing technologies, leading to lower costs and higher throughput, alongside a growing demand for sophisticated environmental impact assessments and ecological monitoring across various industries, including water management, conservation projects, and infrastructure development. The ability to generate detailed biodiversity profiles quickly and non-invasively makes NGS eDNA biomonitoring an indispensable tool for researchers and environmental agencies alike.
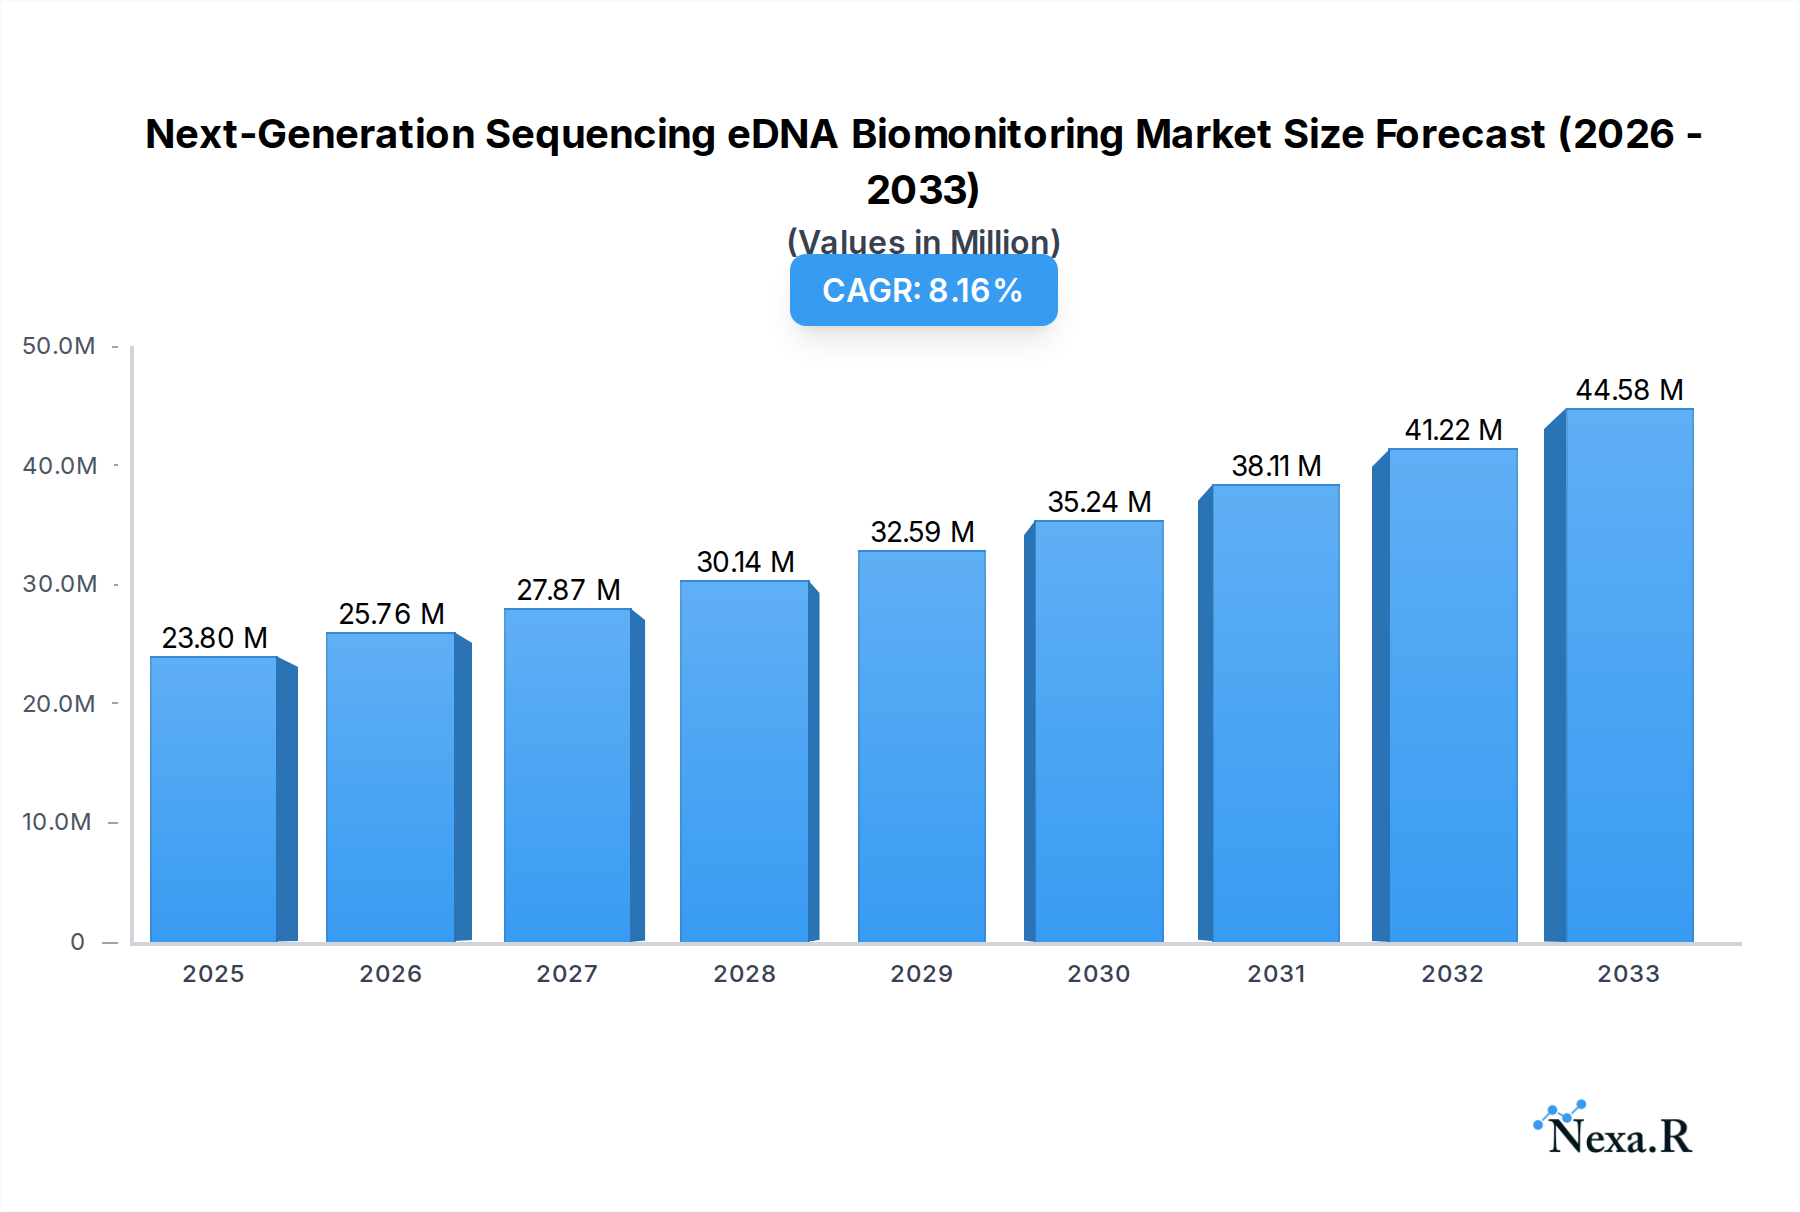
Next-Generation Sequencing eDNA Biomonitoring Market Size (In Million)
The market is segmented into distinct application areas, with water biomonitoring representing a significant share due to the critical importance of aquatic ecosystem health and the ease of sample collection. Soil and air biomonitoring are also gaining traction as researchers increasingly recognize the value of these environments for understanding complex ecological interactions. In terms of technology types, Targeted Sequencing & Resequencing is currently dominant, offering cost-effectiveness and focused species identification. However, Whole Genome Sequencing and Whole Exome Sequencing are expected to witness considerable growth as researchers pursue deeper insights into species evolution, population genetics, and functional ecology. Despite the promising outlook, challenges such as the standardization of protocols, data interpretation complexity, and the initial investment in equipment and expertise may temper rapid adoption in certain regions. Nonetheless, ongoing technological innovations and increasing awareness of the benefits are expected to overcome these restraints, paving the way for widespread integration of NGS eDNA biomonitoring in environmental science.

Next-Generation Sequencing eDNA Biomonitoring Company Market Share
This report provides an in-depth analysis of the global Next-Generation Sequencing (NGS) eDNA (environmental DNA) biomonitoring market, a rapidly evolving sector crucial for biodiversity assessment, conservation, and environmental management. Leveraging advanced sequencing technologies, eDNA biomonitoring offers unprecedented insights into species presence and abundance from minute environmental samples. This report examines market dynamics, growth trends, regional dominance, product innovations, key drivers and barriers, emerging opportunities, growth accelerators, and the competitive landscape.
The global NGS eDNA biomonitoring market is projected to reach a valuation of $2,500 million by 2033, exhibiting a robust Compound Annual Growth Rate (CAGR) of 15.5% during the forecast period (2025–2033). The base year valuation stands at $850 million in 2025. This growth is fueled by increasing environmental awareness, stringent regulatory mandates for biodiversity monitoring, and significant advancements in sequencing technologies, driving down costs and increasing accuracy. The parent market, environmental monitoring, is a multi-billion dollar industry, with eDNA biomonitoring representing a rapidly expanding child market due to its superior capabilities in non-invasive species detection and comprehensive ecosystem assessment.
Next-Generation Sequencing eDNA Biomonitoring Market Dynamics & Structure
The NGS eDNA biomonitoring market exhibits a moderately concentrated structure, with established players and emerging innovators vying for market share. Technological innovation is a primary driver, with continuous improvements in sequencing efficiency, data analysis algorithms, and portable sequencing devices. Regulatory frameworks, such as those promoting biodiversity conservation and environmental impact assessments, significantly influence market adoption. Competitive product substitutes include traditional sampling methods (e.g., visual surveys, trapping) and qPCR-based eDNA analysis, which are being increasingly surpassed by the sensitivity and scope of NGS. End-user demographics span governmental agencies, research institutions, environmental consulting firms, and private sector industries (e.g., infrastructure, energy). Mergers and acquisitions (M&A) are anticipated to play a role in market consolidation, with strategic partnerships focused on technology integration and market penetration.
- Market Concentration: Moderate, with a blend of large, established players and nimble startups.
- Technological Innovation Drivers: Miniaturization of sequencers, improved bioinformatics pipelines, development of universal primers, and single-molecule sequencing technologies.
- Regulatory Frameworks: Growing emphasis on biodiversity protection, invasive species management, and ecological restoration mandates are key enablers.
- Competitive Product Substitutes: Traditional ecological survey methods, camera traps, acoustic monitoring, and qPCR assays.
- End-User Demographics: Environmental consultants (estimated market share of 35%), governmental bodies (30%), academic and research institutions (25%), and industrial sectors (10%).
- M&A Trends: Expected to increase as companies seek to expand their technological capabilities and geographical reach. M&A deal volume is projected to grow by 10-15% annually.
Next-Generation Sequencing eDNA Biomonitoring Growth Trends & Insights
The NGS eDNA biomonitoring market is experiencing a substantial growth trajectory, driven by a confluence of factors that are reshaping how we understand and manage our environment. The market size evolution from an estimated $400 million in 2019 to the projected $850 million in 2025 signifies a period of rapid expansion. This growth is further amplified by increasing adoption rates across diverse sectors, spurred by the undeniable advantages of eDNA techniques over conventional methods. Technological disruptions are at the forefront, with advancements in high-throughput sequencing platforms like those offered by Illumina, Inc., significantly reducing per-sample sequencing costs and increasing the depth of biodiversity captured. This democratization of NGS technology is enabling a wider array of research and monitoring applications.
Consumer behavior shifts, particularly within regulatory bodies and industry stakeholders, are also playing a pivotal role. There is a growing demand for faster, more comprehensive, and less intrusive monitoring solutions. eDNA biomonitoring perfectly aligns with these requirements, offering the ability to detect rare, elusive, or migratory species without direct observation. The market penetration of eDNA services is steadily increasing, moving from niche academic research to mainstream environmental consulting and regulatory compliance. The CAGR for the historical period (2019-2024) was approximately 12.0%, with the forecast period (2025-2033) expecting a higher CAGR of 15.5%. This acceleration is attributed to enhanced bioinformatics tools for complex data analysis, the development of standardized protocols, and the growing recognition of eDNA's utility in environmental DNA risk assessments and impact studies. The increasing use of eDNA in water quality monitoring, soil biodiversity assessments, and even air quality studies further broadens its applicability and market reach. The market penetration for eDNA biomonitoring services in environmental impact assessments is estimated to reach 40% by 2030.
Dominant Regions, Countries, or Segments in Next-Generation Sequencing eDNA Biomonitoring
The global NGS eDNA biomonitoring market is characterized by significant regional variations in adoption, driven by economic policies, regulatory landscapes, research infrastructure, and environmental priorities. Currently, North America stands as the dominant region, primarily due to strong governmental investment in environmental research and conservation, robust regulatory frameworks like the Endangered Species Act, and the presence of leading research institutions and private sector companies involved in eDNA development and application. The United States and Canada are key contributors to this dominance.
Within the application segments, Water biomonitoring holds the largest market share, estimated at 50%, owing to its critical role in assessing aquatic ecosystem health, managing fisheries, and monitoring water quality for human consumption and industrial use. This is closely followed by Soil biomonitoring, accounting for 30%, which is gaining traction for its insights into soil microbial communities, agricultural productivity, and terrestrial biodiversity. Air biomonitoring, while a nascent segment, is projected for significant growth.
In terms of sequencing Types, Targeted Sequencing & Resequencing currently dominates the market share, estimated at 60%. This is attributed to its cost-effectiveness and efficiency in detecting specific marker genes for known species or taxonomic groups, making it ideal for routine monitoring and initial species identification. However, Whole Genome Sequencing (WGS) and Whole Exome Sequencing (WES) are experiencing rapid growth, driven by their ability to uncover novel biodiversity, understand evolutionary relationships, and identify functional genes within environmental samples. WGS and WES together are projected to capture 40% of the market by 2030, driven by declining sequencing costs and advancements in bioinformatics for analyzing complex genomic data.
- Dominant Region: North America
- Key Drivers: Strong environmental legislation, significant R&D funding, established environmental consulting sector.
- Market Share: Estimated 40% of the global market.
- Growth Potential: Continual expansion driven by new conservation initiatives and infrastructure development projects requiring eDNA assessments.
- Dominant Application Segment: Water
- Key Drivers: Critical for freshwater and marine ecosystem health, fisheries management, and regulatory compliance.
- Market Share: Estimated 50%.
- Growth Potential: Sustained demand from government agencies and water management bodies.
- Dominant Sequencing Type: Targeted Sequencing & Resequencing
- Key Drivers: Cost-effectiveness, speed, and efficacy for identifying known species.
- Market Share: Estimated 60%.
- Growth Potential: Remains strong for routine monitoring, but facing increasing competition from WGS/WES for comprehensive biodiversity studies.
Next-Generation Sequencing eDNA Biomonitoring Product Landscape
The product landscape for NGS eDNA biomonitoring is characterized by a rapid evolution of sequencing technologies, assay kits, and bioinformatics platforms. Key innovations include the development of highly multiplexed metabarcoding assays that can simultaneously detect thousands of species from a single sample. Companies are also focusing on improving DNA extraction kits for challenging environmental matrices like soil and sediment, ensuring higher DNA yields and purity. Furthermore, advancements in portable sequencing devices are enabling field-based eDNA analysis, reducing turnaround times and logistical complexities. Unique selling propositions revolve around enhanced sensitivity, broader taxonomic coverage, user-friendly workflows, and rapid data interpretation.
Key Drivers, Barriers & Challenges in Next-Generation Sequencing eDNA Biomonitoring
Key Drivers: The primary forces propelling the NGS eDNA biomonitoring market are technological advancements, leading to increased accuracy and reduced costs; a growing global awareness of biodiversity loss and the need for effective conservation strategies; and increasingly stringent environmental regulations worldwide that mandate comprehensive biodiversity assessments. The non-invasive nature of eDNA sampling is also a significant driver, facilitating surveys in sensitive or inaccessible habitats.
Barriers & Challenges: Despite its potential, the market faces several challenges. Standardization of eDNA protocols, from sample collection to data analysis, remains an ongoing effort, which can lead to variability in results. The cost of NGS, though decreasing, can still be a barrier for some smaller organizations or developing regions. Bioinformatic expertise is required for effective data interpretation, creating a skills gap. Supply chain issues for reagents and consumables can sometimes impact project timelines, and the interpretation of complex eDNA datasets, including the differentiation of live organisms from degraded DNA, requires sophisticated analytical approaches. The regulatory acceptance of eDNA data as equivalent to traditional methods is also an evolving landscape.
Emerging Opportunities in Next-Generation Sequencing eDNA Biomonitoring
Emerging opportunities in the NGS eDNA biomonitoring sector lie in the expansion of its application into novel areas. The integration of eDNA with real-time sensor networks offers potential for continuous environmental monitoring and early warning systems for invasive species or disease outbreaks. Furthermore, the development of standardized eDNA databases for specific biomes will accelerate species identification and biodiversity assessment. The growing demand for sustainable agriculture and forestry also presents opportunities for eDNA-based soil health and pest monitoring. The potential for eDNA to inform climate change adaptation strategies by tracking species range shifts is another significant emerging area.
Growth Accelerators in the Next-Generation Sequencing eDNA Biomonitoring Industry
Several key accelerators are fueling the long-term growth of the NGS eDNA biomonitoring industry. Technological breakthroughs in long-read sequencing are expected to improve the assembly of complex genomes and enhance our understanding of microbial communities. Strategic partnerships between sequencing technology providers, bioinformatics companies, and environmental consultancies are critical for creating integrated solutions and expanding market reach. Market expansion strategies, including the development of more accessible and affordable eDNA testing kits and services, will drive broader adoption. Furthermore, increased investment in biodiversity monitoring from both public and private sectors, driven by corporate social responsibility initiatives and ESG (Environmental, Social, and Governance) frameworks, will significantly boost growth.
Key Players Shaping the Next-Generation Sequencing eDNA Biomonitoring Market
- Illumina, Inc.
- Stantec
- Eurofins Genomics
- Spygen
- ID-Gene Ecordiagnostics
- EnviroDNA
- eDNAtec
- Genidaqs
- NatureMetrics
- Jonah Ventures
- Sinsoma GmbH
- SimplexDNA
Notable Milestones in Next-Generation Sequencing eDNA Biomonitoring Sector
- 2019: Increased adoption of metabarcoding techniques for large-scale biodiversity surveys.
- 2020: Advancements in DNA extraction protocols for challenging soil and sediment samples.
- 2021: Development of portable sequencing devices leading to field-based eDNA analysis.
- 2022: Increased integration of eDNA data with traditional ecological monitoring methods.
- 2023: Growth in eDNA applications for invasive species detection and management programs.
- 2024: Enhanced development of cloud-based bioinformatics platforms for eDNA data analysis.
In-Depth Next-Generation Sequencing eDNA Biomonitoring Market Outlook
The future outlook for the NGS eDNA biomonitoring market is exceptionally promising, driven by continuous technological innovation and an escalating global imperative for robust environmental stewardship. Growth accelerators such as the development of more affordable and user-friendly sequencing platforms, coupled with sophisticated bioinformatics tools, will democratize access to eDNA analysis, expanding its reach into diverse sectors. Strategic collaborations between technology developers, service providers, and regulatory bodies are anticipated to streamline protocol standardization and foster greater acceptance of eDNA data. The increasing emphasis on biodiversity conservation, climate change adaptation, and sustainable resource management will further propel demand. Emerging opportunities in areas like real-time environmental monitoring and the application of eDNA in public health surveillance present avenues for substantial market expansion, solidifying NGS eDNA biomonitoring as an indispensable tool for understanding and protecting our planet.
Next-Generation Sequencing eDNA Biomonitoring Segmentation
-
1. Application
- 1.1. Water
- 1.2. Soil
- 1.3. Air
- 1.4. Others
-
2. Types
- 2.1. Targeted Sequencing & Resequencing
- 2.2. Whole Genome Sequencing
- 2.3. Whole Exome Sequencing
Next-Generation Sequencing eDNA Biomonitoring Segmentation By Geography
-
1. North America
- 1.1. United States
- 1.2. Canada
- 1.3. Mexico
-
2. South America
- 2.1. Brazil
- 2.2. Argentina
- 2.3. Rest of South America
-
3. Europe
- 3.1. United Kingdom
- 3.2. Germany
- 3.3. France
- 3.4. Italy
- 3.5. Spain
- 3.6. Russia
- 3.7. Benelux
- 3.8. Nordics
- 3.9. Rest of Europe
-
4. Middle East & Africa
- 4.1. Turkey
- 4.2. Israel
- 4.3. GCC
- 4.4. North Africa
- 4.5. South Africa
- 4.6. Rest of Middle East & Africa
-
5. Asia Pacific
- 5.1. China
- 5.2. India
- 5.3. Japan
- 5.4. South Korea
- 5.5. ASEAN
- 5.6. Oceania
- 5.7. Rest of Asia Pacific
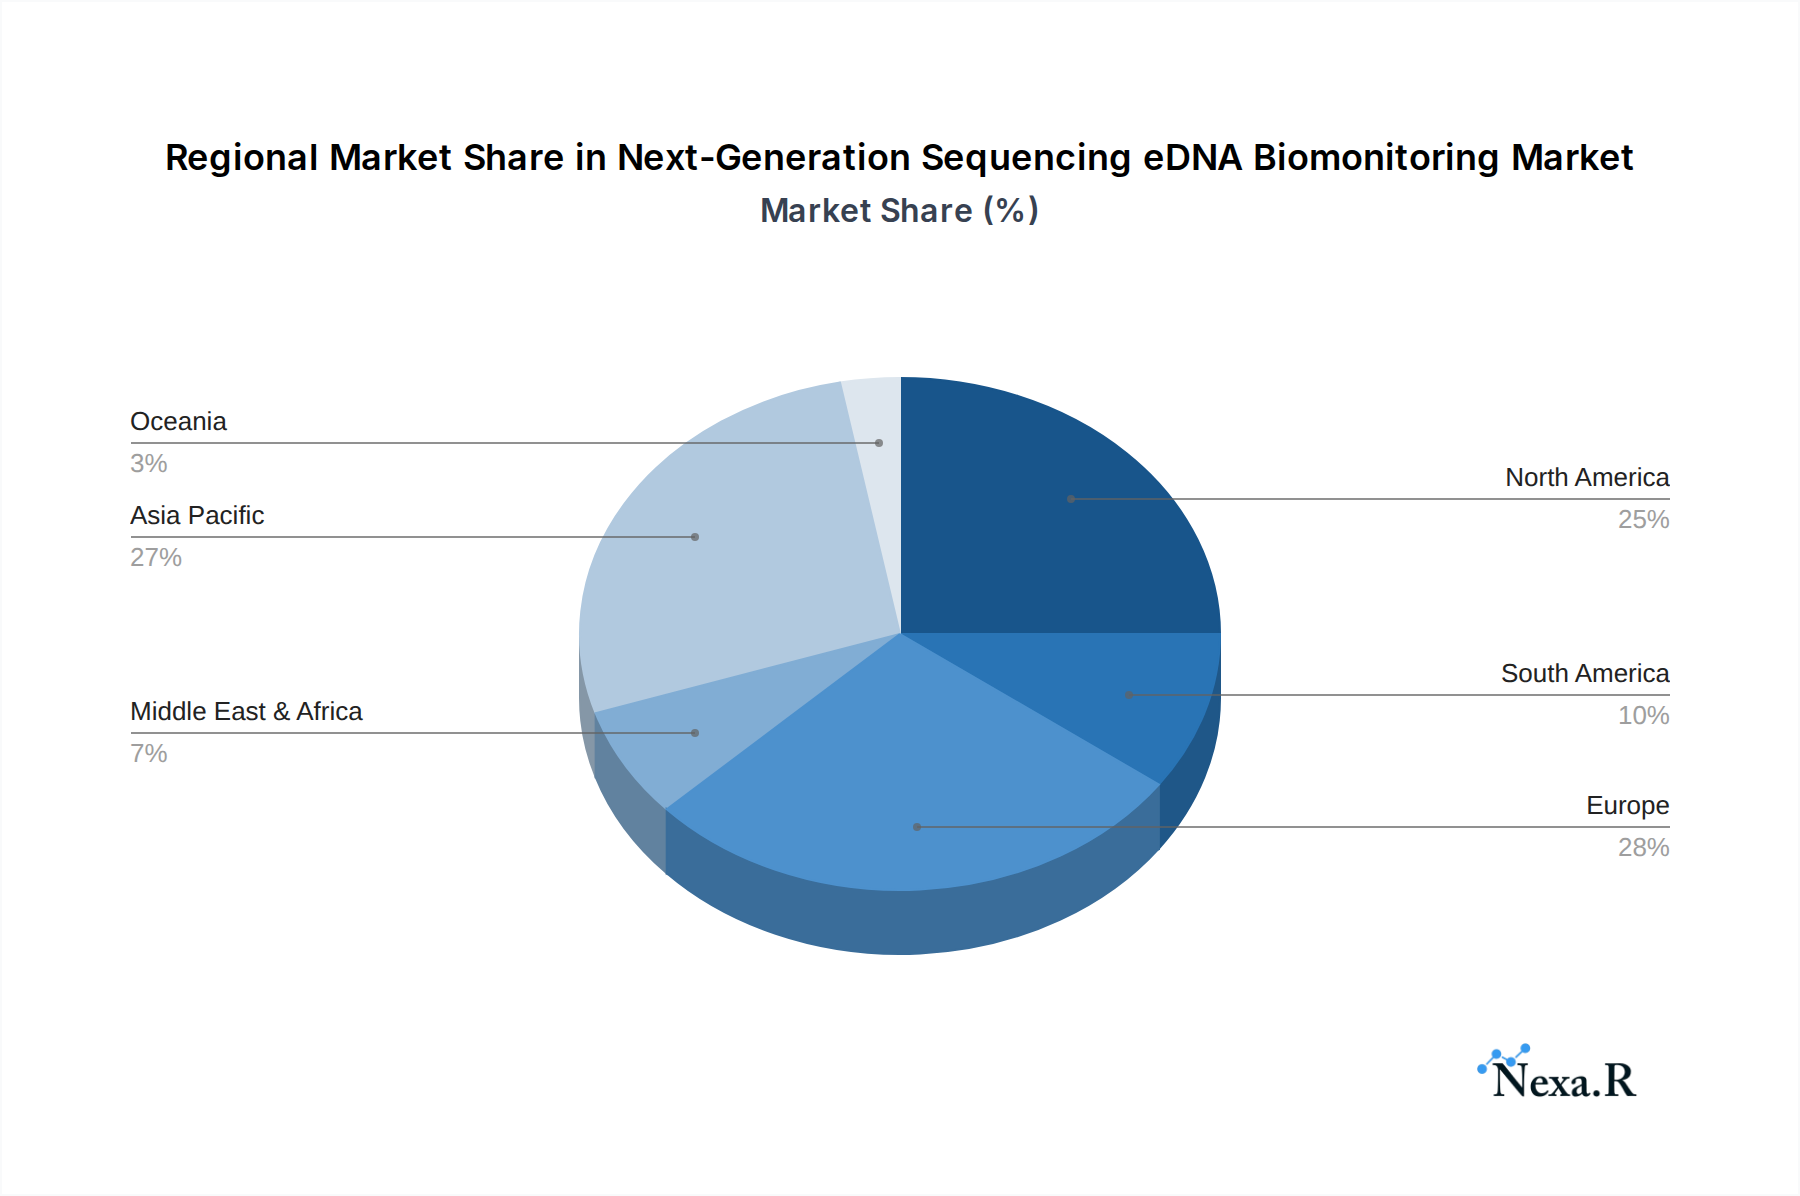
Next-Generation Sequencing eDNA Biomonitoring Regional Market Share
Geographic Coverage of Next-Generation Sequencing eDNA Biomonitoring
Next-Generation Sequencing eDNA Biomonitoring REPORT HIGHLIGHTS
| Aspects | Details |
|---|---|
| Study Period | 2020-2034 |
| Base Year | 2025 |
| Estimated Year | 2026 |
| Forecast Period | 2026-2034 |
| Historical Period | 2020-2025 |
| Growth Rate | CAGR of 8.1% from 2020-2034 |
| Segmentation |
|
Table of Contents
- 1. Introduction
- 1.1. Research Scope
- 1.2. Market Segmentation
- 1.3. Research Methodology
- 1.4. Definitions and Assumptions
- 2. Executive Summary
- 2.1. Introduction
- 3. Market Dynamics
- 3.1. Introduction
- 3.2. Market Drivers
- 3.3. Market Restrains
- 3.4. Market Trends
- 4. Market Factor Analysis
- 4.1. Porters Five Forces
- 4.2. Supply/Value Chain
- 4.3. PESTEL analysis
- 4.4. Market Entropy
- 4.5. Patent/Trademark Analysis
- 5. Global Next-Generation Sequencing eDNA Biomonitoring Analysis, Insights and Forecast, 2020-2032
- 5.1. Market Analysis, Insights and Forecast - by Application
- 5.1.1. Water
- 5.1.2. Soil
- 5.1.3. Air
- 5.1.4. Others
- 5.2. Market Analysis, Insights and Forecast - by Types
- 5.2.1. Targeted Sequencing & Resequencing
- 5.2.2. Whole Genome Sequencing
- 5.2.3. Whole Exome Sequencing
- 5.3. Market Analysis, Insights and Forecast - by Region
- 5.3.1. North America
- 5.3.2. South America
- 5.3.3. Europe
- 5.3.4. Middle East & Africa
- 5.3.5. Asia Pacific
- 5.1. Market Analysis, Insights and Forecast - by Application
- 6. North America Next-Generation Sequencing eDNA Biomonitoring Analysis, Insights and Forecast, 2020-2032
- 6.1. Market Analysis, Insights and Forecast - by Application
- 6.1.1. Water
- 6.1.2. Soil
- 6.1.3. Air
- 6.1.4. Others
- 6.2. Market Analysis, Insights and Forecast - by Types
- 6.2.1. Targeted Sequencing & Resequencing
- 6.2.2. Whole Genome Sequencing
- 6.2.3. Whole Exome Sequencing
- 6.1. Market Analysis, Insights and Forecast - by Application
- 7. South America Next-Generation Sequencing eDNA Biomonitoring Analysis, Insights and Forecast, 2020-2032
- 7.1. Market Analysis, Insights and Forecast - by Application
- 7.1.1. Water
- 7.1.2. Soil
- 7.1.3. Air
- 7.1.4. Others
- 7.2. Market Analysis, Insights and Forecast - by Types
- 7.2.1. Targeted Sequencing & Resequencing
- 7.2.2. Whole Genome Sequencing
- 7.2.3. Whole Exome Sequencing
- 7.1. Market Analysis, Insights and Forecast - by Application
- 8. Europe Next-Generation Sequencing eDNA Biomonitoring Analysis, Insights and Forecast, 2020-2032
- 8.1. Market Analysis, Insights and Forecast - by Application
- 8.1.1. Water
- 8.1.2. Soil
- 8.1.3. Air
- 8.1.4. Others
- 8.2. Market Analysis, Insights and Forecast - by Types
- 8.2.1. Targeted Sequencing & Resequencing
- 8.2.2. Whole Genome Sequencing
- 8.2.3. Whole Exome Sequencing
- 8.1. Market Analysis, Insights and Forecast - by Application
- 9. Middle East & Africa Next-Generation Sequencing eDNA Biomonitoring Analysis, Insights and Forecast, 2020-2032
- 9.1. Market Analysis, Insights and Forecast - by Application
- 9.1.1. Water
- 9.1.2. Soil
- 9.1.3. Air
- 9.1.4. Others
- 9.2. Market Analysis, Insights and Forecast - by Types
- 9.2.1. Targeted Sequencing & Resequencing
- 9.2.2. Whole Genome Sequencing
- 9.2.3. Whole Exome Sequencing
- 9.1. Market Analysis, Insights and Forecast - by Application
- 10. Asia Pacific Next-Generation Sequencing eDNA Biomonitoring Analysis, Insights and Forecast, 2020-2032
- 10.1. Market Analysis, Insights and Forecast - by Application
- 10.1.1. Water
- 10.1.2. Soil
- 10.1.3. Air
- 10.1.4. Others
- 10.2. Market Analysis, Insights and Forecast - by Types
- 10.2.1. Targeted Sequencing & Resequencing
- 10.2.2. Whole Genome Sequencing
- 10.2.3. Whole Exome Sequencing
- 10.1. Market Analysis, Insights and Forecast - by Application
- 11. Competitive Analysis
- 11.1. Global Market Share Analysis 2025
- 11.2. Company Profiles
- 11.2.1 Illumina
- 11.2.1.1. Overview
- 11.2.1.2. Products
- 11.2.1.3. SWOT Analysis
- 11.2.1.4. Recent Developments
- 11.2.1.5. Financials (Based on Availability)
- 11.2.2 Inc
- 11.2.2.1. Overview
- 11.2.2.2. Products
- 11.2.2.3. SWOT Analysis
- 11.2.2.4. Recent Developments
- 11.2.2.5. Financials (Based on Availability)
- 11.2.3 Stantec
- 11.2.3.1. Overview
- 11.2.3.2. Products
- 11.2.3.3. SWOT Analysis
- 11.2.3.4. Recent Developments
- 11.2.3.5. Financials (Based on Availability)
- 11.2.4 Eurofins Genomics
- 11.2.4.1. Overview
- 11.2.4.2. Products
- 11.2.4.3. SWOT Analysis
- 11.2.4.4. Recent Developments
- 11.2.4.5. Financials (Based on Availability)
- 11.2.5 Spygen
- 11.2.5.1. Overview
- 11.2.5.2. Products
- 11.2.5.3. SWOT Analysis
- 11.2.5.4. Recent Developments
- 11.2.5.5. Financials (Based on Availability)
- 11.2.6 ID-Gene Ecordiagnostics
- 11.2.6.1. Overview
- 11.2.6.2. Products
- 11.2.6.3. SWOT Analysis
- 11.2.6.4. Recent Developments
- 11.2.6.5. Financials (Based on Availability)
- 11.2.7 EnviroDNA
- 11.2.7.1. Overview
- 11.2.7.2. Products
- 11.2.7.3. SWOT Analysis
- 11.2.7.4. Recent Developments
- 11.2.7.5. Financials (Based on Availability)
- 11.2.8 eDNAtec
- 11.2.8.1. Overview
- 11.2.8.2. Products
- 11.2.8.3. SWOT Analysis
- 11.2.8.4. Recent Developments
- 11.2.8.5. Financials (Based on Availability)
- 11.2.9 Genidaqs
- 11.2.9.1. Overview
- 11.2.9.2. Products
- 11.2.9.3. SWOT Analysis
- 11.2.9.4. Recent Developments
- 11.2.9.5. Financials (Based on Availability)
- 11.2.10 NatureMetrics
- 11.2.10.1. Overview
- 11.2.10.2. Products
- 11.2.10.3. SWOT Analysis
- 11.2.10.4. Recent Developments
- 11.2.10.5. Financials (Based on Availability)
- 11.2.11 Jonah Ventures
- 11.2.11.1. Overview
- 11.2.11.2. Products
- 11.2.11.3. SWOT Analysis
- 11.2.11.4. Recent Developments
- 11.2.11.5. Financials (Based on Availability)
- 11.2.12 Sinsoma GmbH
- 11.2.12.1. Overview
- 11.2.12.2. Products
- 11.2.12.3. SWOT Analysis
- 11.2.12.4. Recent Developments
- 11.2.12.5. Financials (Based on Availability)
- 11.2.13 SimplexDNA
- 11.2.13.1. Overview
- 11.2.13.2. Products
- 11.2.13.3. SWOT Analysis
- 11.2.13.4. Recent Developments
- 11.2.13.5. Financials (Based on Availability)
- 11.2.1 Illumina
List of Figures
- Figure 1: Global Next-Generation Sequencing eDNA Biomonitoring Revenue Breakdown (million, %) by Region 2025 & 2033
- Figure 2: North America Next-Generation Sequencing eDNA Biomonitoring Revenue (million), by Application 2025 & 2033
- Figure 3: North America Next-Generation Sequencing eDNA Biomonitoring Revenue Share (%), by Application 2025 & 2033
- Figure 4: North America Next-Generation Sequencing eDNA Biomonitoring Revenue (million), by Types 2025 & 2033
- Figure 5: North America Next-Generation Sequencing eDNA Biomonitoring Revenue Share (%), by Types 2025 & 2033
- Figure 6: North America Next-Generation Sequencing eDNA Biomonitoring Revenue (million), by Country 2025 & 2033
- Figure 7: North America Next-Generation Sequencing eDNA Biomonitoring Revenue Share (%), by Country 2025 & 2033
- Figure 8: South America Next-Generation Sequencing eDNA Biomonitoring Revenue (million), by Application 2025 & 2033
- Figure 9: South America Next-Generation Sequencing eDNA Biomonitoring Revenue Share (%), by Application 2025 & 2033
- Figure 10: South America Next-Generation Sequencing eDNA Biomonitoring Revenue (million), by Types 2025 & 2033
- Figure 11: South America Next-Generation Sequencing eDNA Biomonitoring Revenue Share (%), by Types 2025 & 2033
- Figure 12: South America Next-Generation Sequencing eDNA Biomonitoring Revenue (million), by Country 2025 & 2033
- Figure 13: South America Next-Generation Sequencing eDNA Biomonitoring Revenue Share (%), by Country 2025 & 2033
- Figure 14: Europe Next-Generation Sequencing eDNA Biomonitoring Revenue (million), by Application 2025 & 2033
- Figure 15: Europe Next-Generation Sequencing eDNA Biomonitoring Revenue Share (%), by Application 2025 & 2033
- Figure 16: Europe Next-Generation Sequencing eDNA Biomonitoring Revenue (million), by Types 2025 & 2033
- Figure 17: Europe Next-Generation Sequencing eDNA Biomonitoring Revenue Share (%), by Types 2025 & 2033
- Figure 18: Europe Next-Generation Sequencing eDNA Biomonitoring Revenue (million), by Country 2025 & 2033
- Figure 19: Europe Next-Generation Sequencing eDNA Biomonitoring Revenue Share (%), by Country 2025 & 2033
- Figure 20: Middle East & Africa Next-Generation Sequencing eDNA Biomonitoring Revenue (million), by Application 2025 & 2033
- Figure 21: Middle East & Africa Next-Generation Sequencing eDNA Biomonitoring Revenue Share (%), by Application 2025 & 2033
- Figure 22: Middle East & Africa Next-Generation Sequencing eDNA Biomonitoring Revenue (million), by Types 2025 & 2033
- Figure 23: Middle East & Africa Next-Generation Sequencing eDNA Biomonitoring Revenue Share (%), by Types 2025 & 2033
- Figure 24: Middle East & Africa Next-Generation Sequencing eDNA Biomonitoring Revenue (million), by Country 2025 & 2033
- Figure 25: Middle East & Africa Next-Generation Sequencing eDNA Biomonitoring Revenue Share (%), by Country 2025 & 2033
- Figure 26: Asia Pacific Next-Generation Sequencing eDNA Biomonitoring Revenue (million), by Application 2025 & 2033
- Figure 27: Asia Pacific Next-Generation Sequencing eDNA Biomonitoring Revenue Share (%), by Application 2025 & 2033
- Figure 28: Asia Pacific Next-Generation Sequencing eDNA Biomonitoring Revenue (million), by Types 2025 & 2033
- Figure 29: Asia Pacific Next-Generation Sequencing eDNA Biomonitoring Revenue Share (%), by Types 2025 & 2033
- Figure 30: Asia Pacific Next-Generation Sequencing eDNA Biomonitoring Revenue (million), by Country 2025 & 2033
- Figure 31: Asia Pacific Next-Generation Sequencing eDNA Biomonitoring Revenue Share (%), by Country 2025 & 2033
List of Tables
- Table 1: Global Next-Generation Sequencing eDNA Biomonitoring Revenue million Forecast, by Application 2020 & 2033
- Table 2: Global Next-Generation Sequencing eDNA Biomonitoring Revenue million Forecast, by Types 2020 & 2033
- Table 3: Global Next-Generation Sequencing eDNA Biomonitoring Revenue million Forecast, by Region 2020 & 2033
- Table 4: Global Next-Generation Sequencing eDNA Biomonitoring Revenue million Forecast, by Application 2020 & 2033
- Table 5: Global Next-Generation Sequencing eDNA Biomonitoring Revenue million Forecast, by Types 2020 & 2033
- Table 6: Global Next-Generation Sequencing eDNA Biomonitoring Revenue million Forecast, by Country 2020 & 2033
- Table 7: United States Next-Generation Sequencing eDNA Biomonitoring Revenue (million) Forecast, by Application 2020 & 2033
- Table 8: Canada Next-Generation Sequencing eDNA Biomonitoring Revenue (million) Forecast, by Application 2020 & 2033
- Table 9: Mexico Next-Generation Sequencing eDNA Biomonitoring Revenue (million) Forecast, by Application 2020 & 2033
- Table 10: Global Next-Generation Sequencing eDNA Biomonitoring Revenue million Forecast, by Application 2020 & 2033
- Table 11: Global Next-Generation Sequencing eDNA Biomonitoring Revenue million Forecast, by Types 2020 & 2033
- Table 12: Global Next-Generation Sequencing eDNA Biomonitoring Revenue million Forecast, by Country 2020 & 2033
- Table 13: Brazil Next-Generation Sequencing eDNA Biomonitoring Revenue (million) Forecast, by Application 2020 & 2033
- Table 14: Argentina Next-Generation Sequencing eDNA Biomonitoring Revenue (million) Forecast, by Application 2020 & 2033
- Table 15: Rest of South America Next-Generation Sequencing eDNA Biomonitoring Revenue (million) Forecast, by Application 2020 & 2033
- Table 16: Global Next-Generation Sequencing eDNA Biomonitoring Revenue million Forecast, by Application 2020 & 2033
- Table 17: Global Next-Generation Sequencing eDNA Biomonitoring Revenue million Forecast, by Types 2020 & 2033
- Table 18: Global Next-Generation Sequencing eDNA Biomonitoring Revenue million Forecast, by Country 2020 & 2033
- Table 19: United Kingdom Next-Generation Sequencing eDNA Biomonitoring Revenue (million) Forecast, by Application 2020 & 2033
- Table 20: Germany Next-Generation Sequencing eDNA Biomonitoring Revenue (million) Forecast, by Application 2020 & 2033
- Table 21: France Next-Generation Sequencing eDNA Biomonitoring Revenue (million) Forecast, by Application 2020 & 2033
- Table 22: Italy Next-Generation Sequencing eDNA Biomonitoring Revenue (million) Forecast, by Application 2020 & 2033
- Table 23: Spain Next-Generation Sequencing eDNA Biomonitoring Revenue (million) Forecast, by Application 2020 & 2033
- Table 24: Russia Next-Generation Sequencing eDNA Biomonitoring Revenue (million) Forecast, by Application 2020 & 2033
- Table 25: Benelux Next-Generation Sequencing eDNA Biomonitoring Revenue (million) Forecast, by Application 2020 & 2033
- Table 26: Nordics Next-Generation Sequencing eDNA Biomonitoring Revenue (million) Forecast, by Application 2020 & 2033
- Table 27: Rest of Europe Next-Generation Sequencing eDNA Biomonitoring Revenue (million) Forecast, by Application 2020 & 2033
- Table 28: Global Next-Generation Sequencing eDNA Biomonitoring Revenue million Forecast, by Application 2020 & 2033
- Table 29: Global Next-Generation Sequencing eDNA Biomonitoring Revenue million Forecast, by Types 2020 & 2033
- Table 30: Global Next-Generation Sequencing eDNA Biomonitoring Revenue million Forecast, by Country 2020 & 2033
- Table 31: Turkey Next-Generation Sequencing eDNA Biomonitoring Revenue (million) Forecast, by Application 2020 & 2033
- Table 32: Israel Next-Generation Sequencing eDNA Biomonitoring Revenue (million) Forecast, by Application 2020 & 2033
- Table 33: GCC Next-Generation Sequencing eDNA Biomonitoring Revenue (million) Forecast, by Application 2020 & 2033
- Table 34: North Africa Next-Generation Sequencing eDNA Biomonitoring Revenue (million) Forecast, by Application 2020 & 2033
- Table 35: South Africa Next-Generation Sequencing eDNA Biomonitoring Revenue (million) Forecast, by Application 2020 & 2033
- Table 36: Rest of Middle East & Africa Next-Generation Sequencing eDNA Biomonitoring Revenue (million) Forecast, by Application 2020 & 2033
- Table 37: Global Next-Generation Sequencing eDNA Biomonitoring Revenue million Forecast, by Application 2020 & 2033
- Table 38: Global Next-Generation Sequencing eDNA Biomonitoring Revenue million Forecast, by Types 2020 & 2033
- Table 39: Global Next-Generation Sequencing eDNA Biomonitoring Revenue million Forecast, by Country 2020 & 2033
- Table 40: China Next-Generation Sequencing eDNA Biomonitoring Revenue (million) Forecast, by Application 2020 & 2033
- Table 41: India Next-Generation Sequencing eDNA Biomonitoring Revenue (million) Forecast, by Application 2020 & 2033
- Table 42: Japan Next-Generation Sequencing eDNA Biomonitoring Revenue (million) Forecast, by Application 2020 & 2033
- Table 43: South Korea Next-Generation Sequencing eDNA Biomonitoring Revenue (million) Forecast, by Application 2020 & 2033
- Table 44: ASEAN Next-Generation Sequencing eDNA Biomonitoring Revenue (million) Forecast, by Application 2020 & 2033
- Table 45: Oceania Next-Generation Sequencing eDNA Biomonitoring Revenue (million) Forecast, by Application 2020 & 2033
- Table 46: Rest of Asia Pacific Next-Generation Sequencing eDNA Biomonitoring Revenue (million) Forecast, by Application 2020 & 2033
Frequently Asked Questions
1. What is the projected Compound Annual Growth Rate (CAGR) of the Next-Generation Sequencing eDNA Biomonitoring?
The projected CAGR is approximately 8.1%.
2. Which companies are prominent players in the Next-Generation Sequencing eDNA Biomonitoring?
Key companies in the market include Illumina, Inc, Stantec, Eurofins Genomics, Spygen, ID-Gene Ecordiagnostics, EnviroDNA, eDNAtec, Genidaqs, NatureMetrics, Jonah Ventures, Sinsoma GmbH, SimplexDNA.
3. What are the main segments of the Next-Generation Sequencing eDNA Biomonitoring?
The market segments include Application, Types.
4. Can you provide details about the market size?
The market size is estimated to be USD 23.8 million as of 2022.
5. What are some drivers contributing to market growth?
N/A
6. What are the notable trends driving market growth?
N/A
7. Are there any restraints impacting market growth?
N/A
8. Can you provide examples of recent developments in the market?
N/A
9. What pricing options are available for accessing the report?
Pricing options include single-user, multi-user, and enterprise licenses priced at USD 3950.00, USD 5925.00, and USD 7900.00 respectively.
10. Is the market size provided in terms of value or volume?
The market size is provided in terms of value, measured in million.
11. Are there any specific market keywords associated with the report?
Yes, the market keyword associated with the report is "Next-Generation Sequencing eDNA Biomonitoring," which aids in identifying and referencing the specific market segment covered.
12. How do I determine which pricing option suits my needs best?
The pricing options vary based on user requirements and access needs. Individual users may opt for single-user licenses, while businesses requiring broader access may choose multi-user or enterprise licenses for cost-effective access to the report.
13. Are there any additional resources or data provided in the Next-Generation Sequencing eDNA Biomonitoring report?
While the report offers comprehensive insights, it's advisable to review the specific contents or supplementary materials provided to ascertain if additional resources or data are available.
14. How can I stay updated on further developments or reports in the Next-Generation Sequencing eDNA Biomonitoring?
To stay informed about further developments, trends, and reports in the Next-Generation Sequencing eDNA Biomonitoring, consider subscribing to industry newsletters, following relevant companies and organizations, or regularly checking reputable industry news sources and publications.
Methodology
Step 1 - Identification of Relevant Samples Size from Population Database


Step 2 - Approaches for Defining Global Market Size (Value, Volume* & Price*)

Note*: In applicable scenarios
Step 3 - Data Sources
Primary Research
- Web Analytics
- Survey Reports
- Research Institute
- Latest Research Reports
- Opinion Leaders
Secondary Research
- Annual Reports
- White Paper
- Latest Press Release
- Industry Association
- Paid Database
- Investor Presentations

Step 4 - Data Triangulation
Involves using different sources of information in order to increase the validity of a study
These sources are likely to be stakeholders in a program - participants, other researchers, program staff, other community members, and so on.
Then we put all data in single framework & apply various statistical tools to find out the dynamic on the market.
During the analysis stage, feedback from the stakeholder groups would be compared to determine areas of agreement as well as areas of divergence