

Key Insights
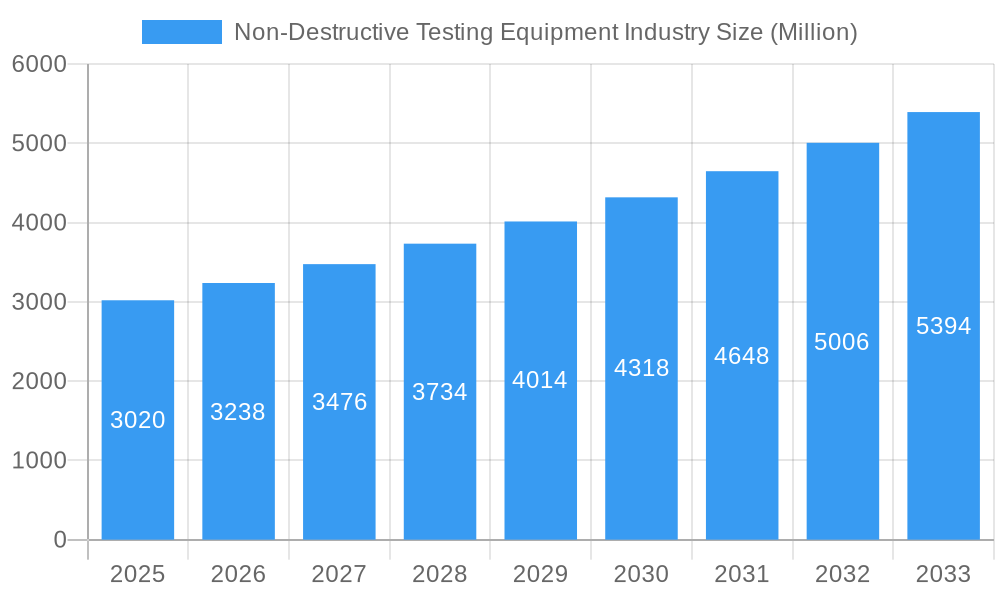
The Non-Destructive Testing (NDT) equipment market, valued at $3.02 billion in 2025, is projected to experience robust growth, driven by a Compound Annual Growth Rate (CAGR) of 7.20% from 2025 to 2033. This expansion is fueled by several key factors. Increasing demand for enhanced safety and quality control across diverse industries, particularly oil and gas, aerospace and defense, and automotive, is a primary driver. The rising adoption of advanced NDT technologies, such as automated ultrasonic testing and digital radiography, is improving inspection efficiency and accuracy, further stimulating market growth. Furthermore, stringent government regulations regarding infrastructure safety and product quality mandates the utilization of NDT equipment, creating a consistent demand. The market is segmented by technology (radiography, ultrasonic, magnetic particle, liquid penetrant, visual inspection, eddy current, and others) and end-user industry, reflecting the broad applicability of NDT across various sectors. Competition among established players like Intertek, YXLON, Baker Hughes, and others is fostering innovation and driving down costs, making NDT solutions more accessible to a wider range of businesses.
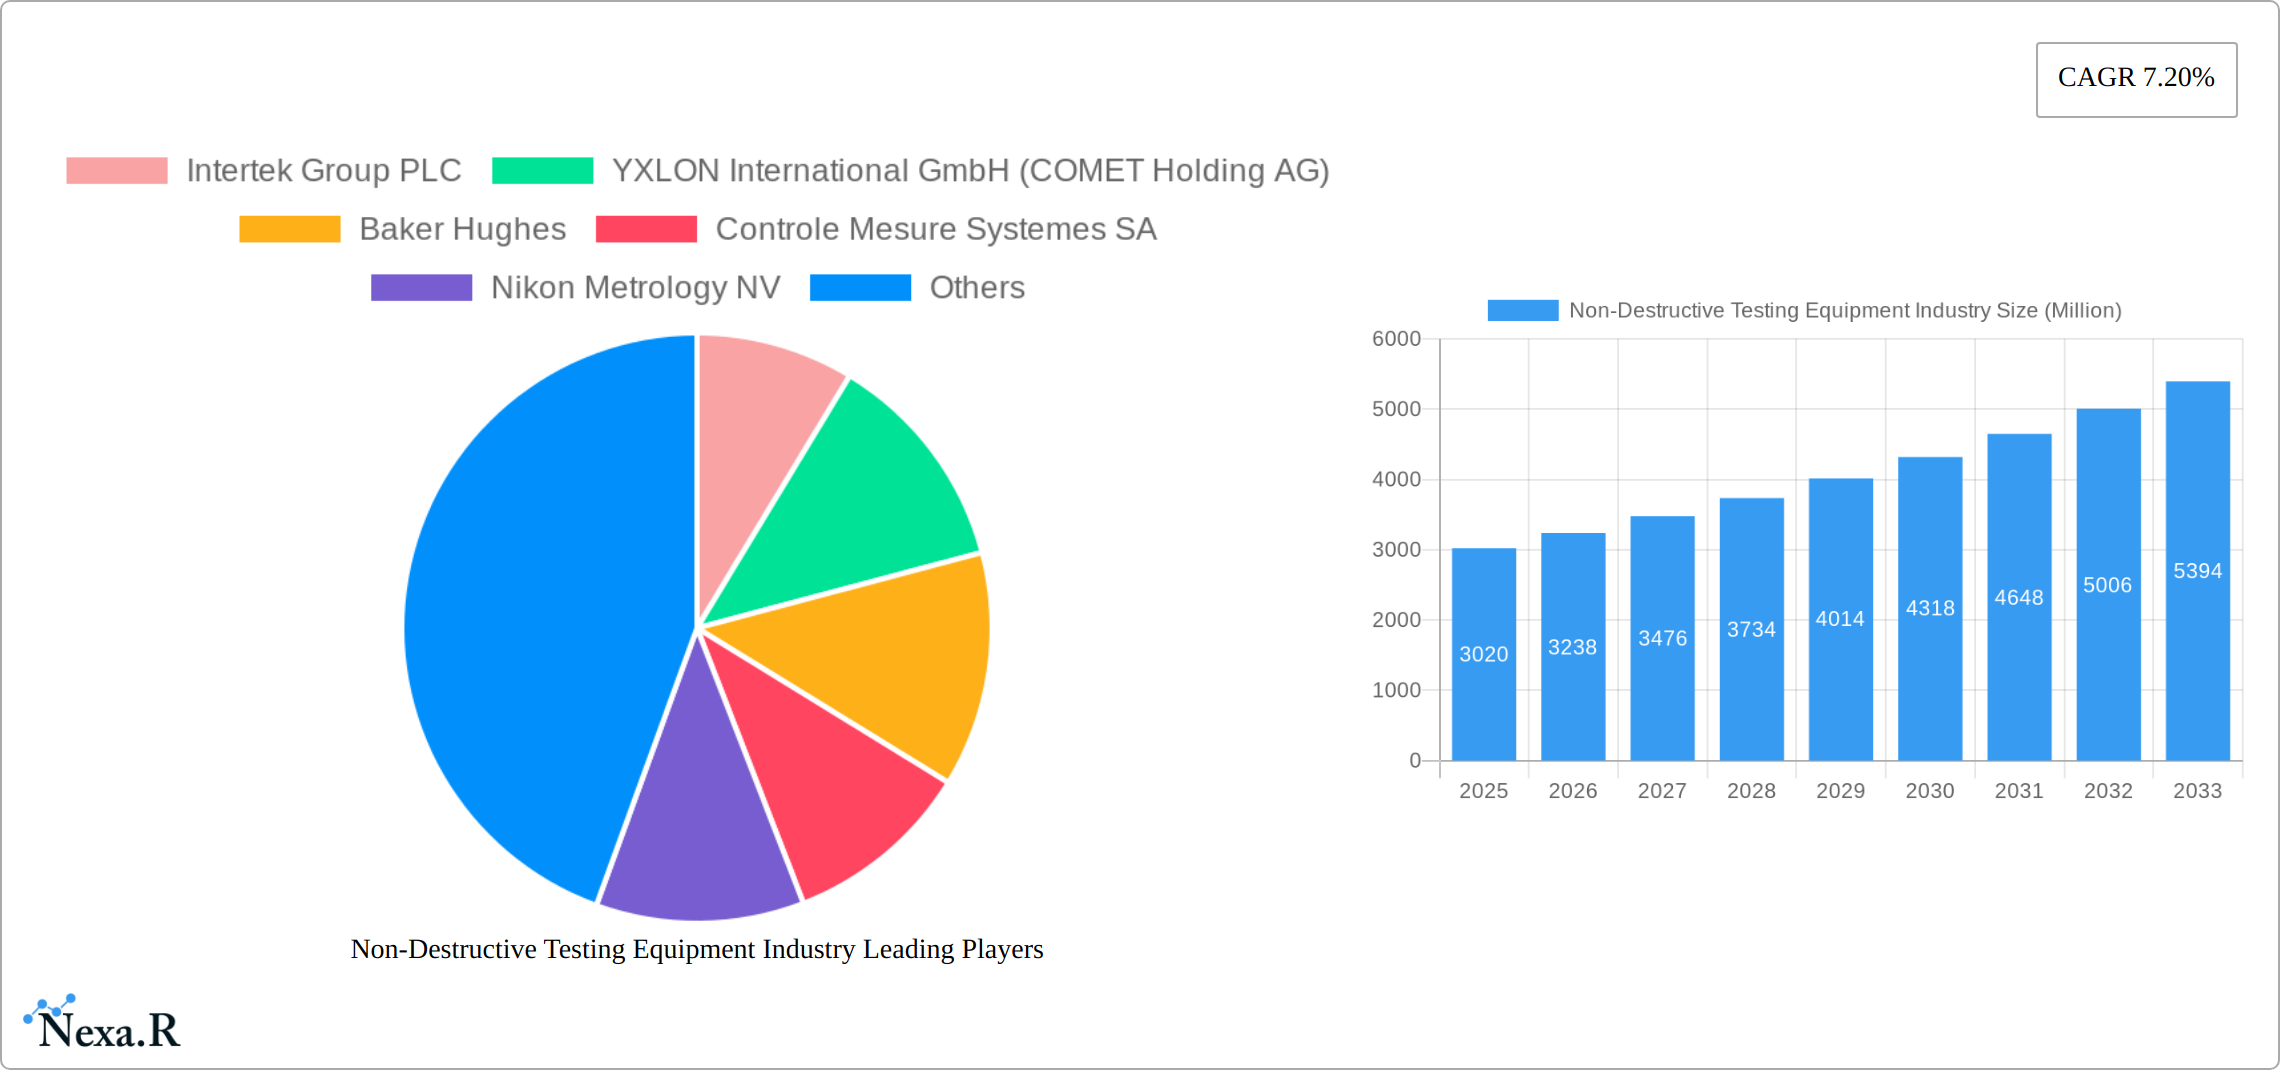
Non-Destructive Testing Equipment Industry Market Size (In Billion)
Geographical expansion also plays a significant role, with North America and Europe currently dominating the market. However, rapidly industrializing economies in Asia, particularly China and India, are expected to witness significant growth in NDT equipment adoption over the forecast period, creating lucrative new markets for existing players and opening opportunities for new entrants. While challenges exist, such as the high initial investment costs associated with some advanced NDT technologies and the need for skilled technicians, the overall market outlook remains positive, with substantial growth opportunities anticipated across all segments and regions throughout the forecast period. The ongoing advancements in NDT technology and the increasing need for enhanced safety and quality assurance will continue to drive this growth trajectory.
Non-Destructive Testing Equipment Industry Company Market Share
Non-Destructive Testing (NDT) Equipment Market Report: 2019-2033
This comprehensive report provides an in-depth analysis of the Non-Destructive Testing (NDT) Equipment market, encompassing market dynamics, growth trends, regional dominance, product landscape, and future outlook. The report covers the period from 2019 to 2033, with 2025 as the base year and a forecast period of 2025-2033. The study segments the market by technology (Radiography, Ultrasonic, Magnetic Particle, Liquid Penetrant, Visual Inspection, Eddy Current, and Other Technologies) and end-user industry (Oil and Gas, Power and Energy, Aerospace and Defense, Automotive and Transportation, Construction, and Others). The market size is valued in million units.
Non-Destructive Testing Equipment Industry Market Dynamics & Structure
The NDT Equipment market is characterized by a moderately concentrated structure, with key players like Intertek Group PLC, YXLON International GmbH (COMET Holding AG), and Baker Hughes holding significant market share. Technological innovation, driven by the need for enhanced accuracy, speed, and portability, is a major growth driver. Stringent safety regulations across various end-user industries, particularly aerospace and oil & gas, mandate the adoption of NDT techniques, fostering market expansion. The market also witnesses competition from substitute technologies, though NDT's irreplaceable role in ensuring structural integrity limits their impact.
- Market Concentration: Moderately concentrated, with top 5 players holding approximately xx% market share in 2025.
- Technological Innovation: Focus on automation, AI integration, and improved sensor technology.
- Regulatory Landscape: Stringent safety standards driving demand across sectors.
- M&A Activity: xx M&A deals recorded between 2019-2024, indicating consolidation trends.
- Competitive Substitutes: Limited substitutes due to the unique role of NDT in quality control.
- Innovation Barriers: High R&D costs and complexities in integrating advanced technologies.
Non-Destructive Testing Equipment Industry Growth Trends & Insights
The Non-Destructive Testing (NDT) equipment market experienced robust growth from 2019-2024, driven by escalating infrastructure development globally, a surge in demand for stringent quality assurance measures, and increasingly rigorous safety regulations across diverse industries. This positive trajectory is projected to continue from 2025-2033, fueled by ongoing advancements in NDT technologies and their expanding adoption across various sectors. Analysts estimate a Compound Annual Growth Rate (CAGR) of xx% during this forecast period. Significant technological disruptions, such as the seamless integration of Artificial Intelligence (AI) and machine learning, are revolutionizing the industry, resulting in demonstrably improved efficiency and accuracy in NDT processes. Evolving consumer preferences highlight a strong preference for advanced, automated systems designed to minimize inspection time and reduce human error. Market penetration is anticipated to reach xx% by 2033.
Dominant Regions, Countries, or Segments in Non-Destructive Testing Equipment Industry
North America and Europe currently dominate the NDT equipment market, driven by strong regulatory frameworks, high technological adoption, and the presence of major industry players. However, Asia-Pacific is expected to exhibit the fastest growth during the forecast period, propelled by rapid industrialization and infrastructure development in countries like China and India.
By Technology:
- Ultrasonic Testing Equipment: Largest segment in 2025, holding approximately xx% market share, driven by versatility and relatively lower cost.
- Radiography Testing Equipment: Significant market share due to its effectiveness in detecting internal flaws.
- Other Technologies: This segment exhibits strong growth potential, driven by emerging technologies.
By End-user Industry:
- Oil and Gas: Largest end-user segment, owing to stringent safety regulations and critical infrastructure inspection needs.
- Aerospace and Defense: High demand for precise and reliable NDT due to stringent quality requirements.
- Power and Energy: Growing adoption for inspection and maintenance of power plants and transmission lines.
Non-Destructive Testing Equipment Industry Product Landscape
The NDT equipment market showcases a diverse product portfolio, encompassing both portable and stationary systems, alongside specialized equipment tailored for various niche applications. Recent innovations are characterized by enhanced portability, superior image quality, and real-time data analysis capabilities. Key features driving market adoption include significantly improved accuracy, faster inspection times, and reduced operational costs. A notable trend is the emergence of sophisticated integrated systems that seamlessly combine multiple NDT techniques, enabling comprehensive and holistic inspections.
Key Drivers, Barriers & Challenges in Non-Destructive Testing Equipment Industry
Key Drivers:
- The ever-increasing demand for robust quality control and unwavering safety standards across numerous industries.
- Stringent regulatory mandates for NDT implementation in critical infrastructure projects, ensuring public safety and asset integrity.
- Continuous technological advancements yielding improved accuracy, efficiency, and reduced inspection times.
- Growing awareness of the cost-effectiveness of preventative maintenance enabled by NDT.
Challenges & Restraints:
- High initial capital expenditure associated with acquiring advanced NDT equipment.
- A persistent shortage of skilled labor capable of effectively implementing and interpreting NDT techniques.
- Limited, but present, competition from emerging substitute technologies.
- Supply chain disruptions that can impact equipment availability and pricing volatility.
- The need for ongoing training and upskilling to keep pace with technological advancements.
Emerging Opportunities in Non-Destructive Testing Equipment Industry
- Significant expansion opportunities within emerging markets experiencing rapid infrastructure development.
- The development and implementation of cutting-edge NDT technologies leveraging the power of AI and machine learning for enhanced automation and analysis.
- Strategic integration of NDT techniques with complementary inspection methods to provide a more comprehensive and insightful analysis.
- Growth in the use of NDT for predictive maintenance strategies.
Growth Accelerators in the Non-Destructive Testing Equipment Industry
Sustained long-term growth will be significantly accelerated by strategic alliances and partnerships between leading equipment manufacturers and established NDT service providers. These collaborations will foster innovation, enhance market penetration, and facilitate the widespread adoption of advanced technologies. Further technological progress, particularly in miniaturization and the integration of wireless connectivity, will unlock new applications and broaden the market reach of NDT equipment. Expansion into currently underserved markets and the development of customized solutions tailored to meet the unique needs of specific industries will also be pivotal in driving long-term growth and market expansion.
Key Players Shaping the Non-Destructive Testing Equipment Market
- Intertek Group PLC
- YXLON International GmbH (COMET Holding AG)
- Baker Hughes
- Controle Mesure Systemes SA
- Nikon Metrology NV
- Fujifilm Corporation
- Mistras Group Inc
- OkoNDT Group
- Innospection Limited
- Applus+ Laboratories
- Bureau Veritas SA
- Olympus Corporation
- Magnaflux Corp
Notable Milestones in Non-Destructive Testing Equipment Industry Sector
- May 2023: MP Machinery and Testing announced the release of proprietary material testing equipment, expanding NDT capabilities in various sectors.
- May 2023: The API's MoUs with ASNT and NDTMA underscore a commitment to improving safety and quality in the oil and gas industry through enhanced NDT practices.
In-Depth Non-Destructive Testing Equipment Industry Market Outlook
The NDT equipment market is poised for significant growth over the next decade, driven by technological advancements, increasing demand from various industries, and stringent regulatory requirements. Strategic partnerships, expansion into emerging markets, and the development of innovative NDT solutions present lucrative opportunities for market players. The focus on automation, AI integration, and improved data analysis capabilities will further shape the future landscape of the NDT equipment market, creating a more efficient, precise, and cost-effective inspection process.
Non-Destructive Testing Equipment Industry Segmentation
-
1. Technology
- 1.1. Radiography Testing Equipment
- 1.2. Ultrasonic Testing Equipment
- 1.3. Magnetic Particle Testing Equipment
- 1.4. Liquid Penetrant Testing Equipment
- 1.5. Visual Inspection Equipment
- 1.6. Eddy Current Equipment
- 1.7. Other Technologies Equipment
-
2. End-user Industry
- 2.1. Oil and Gas
- 2.2. Power and Energy
- 2.3. Aerospace and Defense
- 2.4. Automotive and Transportation
- 2.5. Construction
- 2.6. Other End-user Industries
Non-Destructive Testing Equipment Industry Segmentation By Geography
-
1. North America
- 1.1. United States
- 1.2. Canada
-
2. Europe
- 2.1. United Kingdom
- 2.2. Germany
- 2.3. France
- 2.4. Russia
- 2.5. Italy
-
3. Asia
- 3.1. China
- 3.2. India
- 3.3. South Korea
- 4. Australia and New Zealand
-
5. Latin America
- 5.1. Mexico
- 5.2. Brazil
- 5.3. Argentina
-
6. Middle East and Africa
- 6.1. Saudi Arabia
- 6.2. United Arab Emirates
- 6.3. Qatar
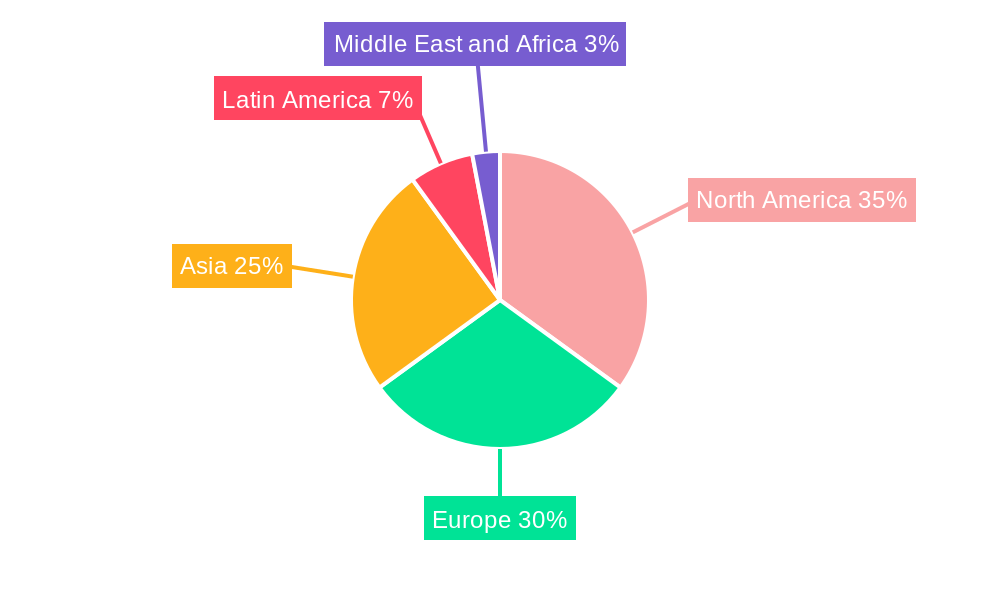
Non-Destructive Testing Equipment Industry Regional Market Share
Geographic Coverage of Non-Destructive Testing Equipment Industry
Non-Destructive Testing Equipment Industry REPORT HIGHLIGHTS
| Aspects | Details |
|---|---|
| Study Period | 2020-2034 |
| Base Year | 2025 |
| Estimated Year | 2026 |
| Forecast Period | 2026-2034 |
| Historical Period | 2020-2025 |
| Growth Rate | CAGR of 7.20% from 2020-2034 |
| Segmentation |
|
Table of Contents
- 1. Introduction
- 1.1. Research Scope
- 1.2. Market Segmentation
- 1.3. Research Objective
- 1.4. Definitions and Assumptions
- 2. Executive Summary
- 2.1. Market Snapshot
- 3. Market Dynamics
- 3.1. Market Drivers
- 3.2. Market Restrains
- 3.3. Market Trends
- 3.4. Market Opportunities
- 4. Market Factor Analysis
- 4.1. Porters Five Forces
- 4.1.1. Bargaining Power of Suppliers
- 4.1.2. Bargaining Power of Buyers
- 4.1.3. Threat of New Entrants
- 4.1.4. Threat of Substitutes
- 4.1.5. Competitive Rivalry
- 4.2. PESTEL analysis
- 4.3. BCG Analysis
- 4.3.1. Stars (High Growth, High Market Share)
- 4.3.2. Cash Cows (Low Growth, High Market Share)
- 4.3.3. Question Mark (High Growth, Low Market Share)
- 4.3.4. Dogs (Low Growth, Low Market Share)
- 4.4. Ansoff Matrix Analysis
- 4.5. Supply Chain Analysis
- 4.6. Regulatory Landscape
- 4.7. Current Market Potential and Opportunity Assessment (TAM–SAM–SOM Framework)
- 4.8. NRP Analyst Note
- 4.1. Porters Five Forces
- 5. Market Analysis, Insights and Forecast 2021-2033
- 5.1. Market Analysis, Insights and Forecast - by Technology
- 5.1.1. Radiography Testing Equipment
- 5.1.2. Ultrasonic Testing Equipment
- 5.1.3. Magnetic Particle Testing Equipment
- 5.1.4. Liquid Penetrant Testing Equipment
- 5.1.5. Visual Inspection Equipment
- 5.1.6. Eddy Current Equipment
- 5.1.7. Other Technologies Equipment
- 5.2. Market Analysis, Insights and Forecast - by End-user Industry
- 5.2.1. Oil and Gas
- 5.2.2. Power and Energy
- 5.2.3. Aerospace and Defense
- 5.2.4. Automotive and Transportation
- 5.2.5. Construction
- 5.2.6. Other End-user Industries
- 5.3. Market Analysis, Insights and Forecast - by Region
- 5.3.1. North America
- 5.3.2. Europe
- 5.3.3. Asia
- 5.3.4. Australia and New Zealand
- 5.3.5. Latin America
- 5.3.6. Middle East and Africa
- 5.1. Market Analysis, Insights and Forecast - by Technology
- 6. Global Non-Destructive Testing Equipment Industry Analysis, Insights and Forecast, 2021-2033
- 6.1. Market Analysis, Insights and Forecast - by Technology
- 6.1.1. Radiography Testing Equipment
- 6.1.2. Ultrasonic Testing Equipment
- 6.1.3. Magnetic Particle Testing Equipment
- 6.1.4. Liquid Penetrant Testing Equipment
- 6.1.5. Visual Inspection Equipment
- 6.1.6. Eddy Current Equipment
- 6.1.7. Other Technologies Equipment
- 6.2. Market Analysis, Insights and Forecast - by End-user Industry
- 6.2.1. Oil and Gas
- 6.2.2. Power and Energy
- 6.2.3. Aerospace and Defense
- 6.2.4. Automotive and Transportation
- 6.2.5. Construction
- 6.2.6. Other End-user Industries
- 6.1. Market Analysis, Insights and Forecast - by Technology
- 7. North America Non-Destructive Testing Equipment Industry Analysis, Insights and Forecast, 2020-2032
- 7.1. Market Analysis, Insights and Forecast - by Technology
- 7.1.1. Radiography Testing Equipment
- 7.1.2. Ultrasonic Testing Equipment
- 7.1.3. Magnetic Particle Testing Equipment
- 7.1.4. Liquid Penetrant Testing Equipment
- 7.1.5. Visual Inspection Equipment
- 7.1.6. Eddy Current Equipment
- 7.1.7. Other Technologies Equipment
- 7.2. Market Analysis, Insights and Forecast - by End-user Industry
- 7.2.1. Oil and Gas
- 7.2.2. Power and Energy
- 7.2.3. Aerospace and Defense
- 7.2.4. Automotive and Transportation
- 7.2.5. Construction
- 7.2.6. Other End-user Industries
- 7.1. Market Analysis, Insights and Forecast - by Technology
- 8. Europe Non-Destructive Testing Equipment Industry Analysis, Insights and Forecast, 2020-2032
- 8.1. Market Analysis, Insights and Forecast - by Technology
- 8.1.1. Radiography Testing Equipment
- 8.1.2. Ultrasonic Testing Equipment
- 8.1.3. Magnetic Particle Testing Equipment
- 8.1.4. Liquid Penetrant Testing Equipment
- 8.1.5. Visual Inspection Equipment
- 8.1.6. Eddy Current Equipment
- 8.1.7. Other Technologies Equipment
- 8.2. Market Analysis, Insights and Forecast - by End-user Industry
- 8.2.1. Oil and Gas
- 8.2.2. Power and Energy
- 8.2.3. Aerospace and Defense
- 8.2.4. Automotive and Transportation
- 8.2.5. Construction
- 8.2.6. Other End-user Industries
- 8.1. Market Analysis, Insights and Forecast - by Technology
- 9. Asia Non-Destructive Testing Equipment Industry Analysis, Insights and Forecast, 2020-2032
- 9.1. Market Analysis, Insights and Forecast - by Technology
- 9.1.1. Radiography Testing Equipment
- 9.1.2. Ultrasonic Testing Equipment
- 9.1.3. Magnetic Particle Testing Equipment
- 9.1.4. Liquid Penetrant Testing Equipment
- 9.1.5. Visual Inspection Equipment
- 9.1.6. Eddy Current Equipment
- 9.1.7. Other Technologies Equipment
- 9.2. Market Analysis, Insights and Forecast - by End-user Industry
- 9.2.1. Oil and Gas
- 9.2.2. Power and Energy
- 9.2.3. Aerospace and Defense
- 9.2.4. Automotive and Transportation
- 9.2.5. Construction
- 9.2.6. Other End-user Industries
- 9.1. Market Analysis, Insights and Forecast - by Technology
- 10. Australia and New Zealand Non-Destructive Testing Equipment Industry Analysis, Insights and Forecast, 2020-2032
- 10.1. Market Analysis, Insights and Forecast - by Technology
- 10.1.1. Radiography Testing Equipment
- 10.1.2. Ultrasonic Testing Equipment
- 10.1.3. Magnetic Particle Testing Equipment
- 10.1.4. Liquid Penetrant Testing Equipment
- 10.1.5. Visual Inspection Equipment
- 10.1.6. Eddy Current Equipment
- 10.1.7. Other Technologies Equipment
- 10.2. Market Analysis, Insights and Forecast - by End-user Industry
- 10.2.1. Oil and Gas
- 10.2.2. Power and Energy
- 10.2.3. Aerospace and Defense
- 10.2.4. Automotive and Transportation
- 10.2.5. Construction
- 10.2.6. Other End-user Industries
- 10.1. Market Analysis, Insights and Forecast - by Technology
- 11. Latin America Non-Destructive Testing Equipment Industry Analysis, Insights and Forecast, 2020-2032
- 11.1. Market Analysis, Insights and Forecast - by Technology
- 11.1.1. Radiography Testing Equipment
- 11.1.2. Ultrasonic Testing Equipment
- 11.1.3. Magnetic Particle Testing Equipment
- 11.1.4. Liquid Penetrant Testing Equipment
- 11.1.5. Visual Inspection Equipment
- 11.1.6. Eddy Current Equipment
- 11.1.7. Other Technologies Equipment
- 11.2. Market Analysis, Insights and Forecast - by End-user Industry
- 11.2.1. Oil and Gas
- 11.2.2. Power and Energy
- 11.2.3. Aerospace and Defense
- 11.2.4. Automotive and Transportation
- 11.2.5. Construction
- 11.2.6. Other End-user Industries
- 11.1. Market Analysis, Insights and Forecast - by Technology
- 12. Middle East and Africa Non-Destructive Testing Equipment Industry Analysis, Insights and Forecast, 2020-2032
- 12.1. Market Analysis, Insights and Forecast - by Technology
- 12.1.1. Radiography Testing Equipment
- 12.1.2. Ultrasonic Testing Equipment
- 12.1.3. Magnetic Particle Testing Equipment
- 12.1.4. Liquid Penetrant Testing Equipment
- 12.1.5. Visual Inspection Equipment
- 12.1.6. Eddy Current Equipment
- 12.1.7. Other Technologies Equipment
- 12.2. Market Analysis, Insights and Forecast - by End-user Industry
- 12.2.1. Oil and Gas
- 12.2.2. Power and Energy
- 12.2.3. Aerospace and Defense
- 12.2.4. Automotive and Transportation
- 12.2.5. Construction
- 12.2.6. Other End-user Industries
- 12.1. Market Analysis, Insights and Forecast - by Technology
- 13. Competitive Analysis
- 13.1. Company Profiles
- 13.1.1 Intertek Group PLC
- 13.1.1.1. Company Overview
- 13.1.1.2. Products
- 13.1.1.3. Company Financials
- 13.1.1.4. SWOT Analysis
- 13.1.2 YXLON International GmbH (COMET Holding AG)
- 13.1.2.1. Company Overview
- 13.1.2.2. Products
- 13.1.2.3. Company Financials
- 13.1.2.4. SWOT Analysis
- 13.1.3 Baker Hughes
- 13.1.3.1. Company Overview
- 13.1.3.2. Products
- 13.1.3.3. Company Financials
- 13.1.3.4. SWOT Analysis
- 13.1.4 Controle Mesure Systemes SA
- 13.1.4.1. Company Overview
- 13.1.4.2. Products
- 13.1.4.3. Company Financials
- 13.1.4.4. SWOT Analysis
- 13.1.5 Nikon Metrology NV
- 13.1.5.1. Company Overview
- 13.1.5.2. Products
- 13.1.5.3. Company Financials
- 13.1.5.4. SWOT Analysis
- 13.1.6 Fujifilm Corporation
- 13.1.6.1. Company Overview
- 13.1.6.2. Products
- 13.1.6.3. Company Financials
- 13.1.6.4. SWOT Analysis
- 13.1.7 Mistras Group Inc
- 13.1.7.1. Company Overview
- 13.1.7.2. Products
- 13.1.7.3. Company Financials
- 13.1.7.4. SWOT Analysis
- 13.1.8 OkoNDT Group
- 13.1.8.1. Company Overview
- 13.1.8.2. Products
- 13.1.8.3. Company Financials
- 13.1.8.4. SWOT Analysis
- 13.1.9 Innospection Limited
- 13.1.9.1. Company Overview
- 13.1.9.2. Products
- 13.1.9.3. Company Financials
- 13.1.9.4. SWOT Analysis
- 13.1.10 Applus+ Laboratories
- 13.1.10.1. Company Overview
- 13.1.10.2. Products
- 13.1.10.3. Company Financials
- 13.1.10.4. SWOT Analysis
- 13.1.11 Bureau Veritas SA
- 13.1.11.1. Company Overview
- 13.1.11.2. Products
- 13.1.11.3. Company Financials
- 13.1.11.4. SWOT Analysis
- 13.1.12 Olympus Corporation
- 13.1.12.1. Company Overview
- 13.1.12.2. Products
- 13.1.12.3. Company Financials
- 13.1.12.4. SWOT Analysis
- 13.1.13 Magnaflux Corp
- 13.1.13.1. Company Overview
- 13.1.13.2. Products
- 13.1.13.3. Company Financials
- 13.1.13.4. SWOT Analysis
- 13.1.1 Intertek Group PLC
- 13.2. Market Entropy
- 13.2.1 Company's Key Areas Served
- 13.2.2 Recent Developments
- 13.3. Company Market Share Analysis 2025
- 13.3.1 Top 5 Companies Market Share Analysis
- 13.3.2 Top 3 Companies Market Share Analysis
- 13.4. List of Potential Customers
- 14. Research Methodology
List of Figures
- Figure 1: Global Non-Destructive Testing Equipment Industry Revenue Breakdown (Million, %) by Region 2025 & 2033
- Figure 2: North America Non-Destructive Testing Equipment Industry Revenue (Million), by Technology 2025 & 2033
- Figure 3: North America Non-Destructive Testing Equipment Industry Revenue Share (%), by Technology 2025 & 2033
- Figure 4: North America Non-Destructive Testing Equipment Industry Revenue (Million), by End-user Industry 2025 & 2033
- Figure 5: North America Non-Destructive Testing Equipment Industry Revenue Share (%), by End-user Industry 2025 & 2033
- Figure 6: North America Non-Destructive Testing Equipment Industry Revenue (Million), by Country 2025 & 2033
- Figure 7: North America Non-Destructive Testing Equipment Industry Revenue Share (%), by Country 2025 & 2033
- Figure 8: Europe Non-Destructive Testing Equipment Industry Revenue (Million), by Technology 2025 & 2033
- Figure 9: Europe Non-Destructive Testing Equipment Industry Revenue Share (%), by Technology 2025 & 2033
- Figure 10: Europe Non-Destructive Testing Equipment Industry Revenue (Million), by End-user Industry 2025 & 2033
- Figure 11: Europe Non-Destructive Testing Equipment Industry Revenue Share (%), by End-user Industry 2025 & 2033
- Figure 12: Europe Non-Destructive Testing Equipment Industry Revenue (Million), by Country 2025 & 2033
- Figure 13: Europe Non-Destructive Testing Equipment Industry Revenue Share (%), by Country 2025 & 2033
- Figure 14: Asia Non-Destructive Testing Equipment Industry Revenue (Million), by Technology 2025 & 2033
- Figure 15: Asia Non-Destructive Testing Equipment Industry Revenue Share (%), by Technology 2025 & 2033
- Figure 16: Asia Non-Destructive Testing Equipment Industry Revenue (Million), by End-user Industry 2025 & 2033
- Figure 17: Asia Non-Destructive Testing Equipment Industry Revenue Share (%), by End-user Industry 2025 & 2033
- Figure 18: Asia Non-Destructive Testing Equipment Industry Revenue (Million), by Country 2025 & 2033
- Figure 19: Asia Non-Destructive Testing Equipment Industry Revenue Share (%), by Country 2025 & 2033
- Figure 20: Australia and New Zealand Non-Destructive Testing Equipment Industry Revenue (Million), by Technology 2025 & 2033
- Figure 21: Australia and New Zealand Non-Destructive Testing Equipment Industry Revenue Share (%), by Technology 2025 & 2033
- Figure 22: Australia and New Zealand Non-Destructive Testing Equipment Industry Revenue (Million), by End-user Industry 2025 & 2033
- Figure 23: Australia and New Zealand Non-Destructive Testing Equipment Industry Revenue Share (%), by End-user Industry 2025 & 2033
- Figure 24: Australia and New Zealand Non-Destructive Testing Equipment Industry Revenue (Million), by Country 2025 & 2033
- Figure 25: Australia and New Zealand Non-Destructive Testing Equipment Industry Revenue Share (%), by Country 2025 & 2033
- Figure 26: Latin America Non-Destructive Testing Equipment Industry Revenue (Million), by Technology 2025 & 2033
- Figure 27: Latin America Non-Destructive Testing Equipment Industry Revenue Share (%), by Technology 2025 & 2033
- Figure 28: Latin America Non-Destructive Testing Equipment Industry Revenue (Million), by End-user Industry 2025 & 2033
- Figure 29: Latin America Non-Destructive Testing Equipment Industry Revenue Share (%), by End-user Industry 2025 & 2033
- Figure 30: Latin America Non-Destructive Testing Equipment Industry Revenue (Million), by Country 2025 & 2033
- Figure 31: Latin America Non-Destructive Testing Equipment Industry Revenue Share (%), by Country 2025 & 2033
- Figure 32: Middle East and Africa Non-Destructive Testing Equipment Industry Revenue (Million), by Technology 2025 & 2033
- Figure 33: Middle East and Africa Non-Destructive Testing Equipment Industry Revenue Share (%), by Technology 2025 & 2033
- Figure 34: Middle East and Africa Non-Destructive Testing Equipment Industry Revenue (Million), by End-user Industry 2025 & 2033
- Figure 35: Middle East and Africa Non-Destructive Testing Equipment Industry Revenue Share (%), by End-user Industry 2025 & 2033
- Figure 36: Middle East and Africa Non-Destructive Testing Equipment Industry Revenue (Million), by Country 2025 & 2033
- Figure 37: Middle East and Africa Non-Destructive Testing Equipment Industry Revenue Share (%), by Country 2025 & 2033
List of Tables
- Table 1: Global Non-Destructive Testing Equipment Industry Revenue Million Forecast, by Technology 2020 & 2033
- Table 2: Global Non-Destructive Testing Equipment Industry Revenue Million Forecast, by End-user Industry 2020 & 2033
- Table 3: Global Non-Destructive Testing Equipment Industry Revenue Million Forecast, by Region 2020 & 2033
- Table 4: Global Non-Destructive Testing Equipment Industry Revenue Million Forecast, by Technology 2020 & 2033
- Table 5: Global Non-Destructive Testing Equipment Industry Revenue Million Forecast, by End-user Industry 2020 & 2033
- Table 6: Global Non-Destructive Testing Equipment Industry Revenue Million Forecast, by Country 2020 & 2033
- Table 7: United States Non-Destructive Testing Equipment Industry Revenue (Million) Forecast, by Application 2020 & 2033
- Table 8: Canada Non-Destructive Testing Equipment Industry Revenue (Million) Forecast, by Application 2020 & 2033
- Table 9: Global Non-Destructive Testing Equipment Industry Revenue Million Forecast, by Technology 2020 & 2033
- Table 10: Global Non-Destructive Testing Equipment Industry Revenue Million Forecast, by End-user Industry 2020 & 2033
- Table 11: Global Non-Destructive Testing Equipment Industry Revenue Million Forecast, by Country 2020 & 2033
- Table 12: United Kingdom Non-Destructive Testing Equipment Industry Revenue (Million) Forecast, by Application 2020 & 2033
- Table 13: Germany Non-Destructive Testing Equipment Industry Revenue (Million) Forecast, by Application 2020 & 2033
- Table 14: France Non-Destructive Testing Equipment Industry Revenue (Million) Forecast, by Application 2020 & 2033
- Table 15: Russia Non-Destructive Testing Equipment Industry Revenue (Million) Forecast, by Application 2020 & 2033
- Table 16: Italy Non-Destructive Testing Equipment Industry Revenue (Million) Forecast, by Application 2020 & 2033
- Table 17: Global Non-Destructive Testing Equipment Industry Revenue Million Forecast, by Technology 2020 & 2033
- Table 18: Global Non-Destructive Testing Equipment Industry Revenue Million Forecast, by End-user Industry 2020 & 2033
- Table 19: Global Non-Destructive Testing Equipment Industry Revenue Million Forecast, by Country 2020 & 2033
- Table 20: China Non-Destructive Testing Equipment Industry Revenue (Million) Forecast, by Application 2020 & 2033
- Table 21: India Non-Destructive Testing Equipment Industry Revenue (Million) Forecast, by Application 2020 & 2033
- Table 22: South Korea Non-Destructive Testing Equipment Industry Revenue (Million) Forecast, by Application 2020 & 2033
- Table 23: Global Non-Destructive Testing Equipment Industry Revenue Million Forecast, by Technology 2020 & 2033
- Table 24: Global Non-Destructive Testing Equipment Industry Revenue Million Forecast, by End-user Industry 2020 & 2033
- Table 25: Global Non-Destructive Testing Equipment Industry Revenue Million Forecast, by Country 2020 & 2033
- Table 26: Global Non-Destructive Testing Equipment Industry Revenue Million Forecast, by Technology 2020 & 2033
- Table 27: Global Non-Destructive Testing Equipment Industry Revenue Million Forecast, by End-user Industry 2020 & 2033
- Table 28: Global Non-Destructive Testing Equipment Industry Revenue Million Forecast, by Country 2020 & 2033
- Table 29: Mexico Non-Destructive Testing Equipment Industry Revenue (Million) Forecast, by Application 2020 & 2033
- Table 30: Brazil Non-Destructive Testing Equipment Industry Revenue (Million) Forecast, by Application 2020 & 2033
- Table 31: Argentina Non-Destructive Testing Equipment Industry Revenue (Million) Forecast, by Application 2020 & 2033
- Table 32: Global Non-Destructive Testing Equipment Industry Revenue Million Forecast, by Technology 2020 & 2033
- Table 33: Global Non-Destructive Testing Equipment Industry Revenue Million Forecast, by End-user Industry 2020 & 2033
- Table 34: Global Non-Destructive Testing Equipment Industry Revenue Million Forecast, by Country 2020 & 2033
- Table 35: Saudi Arabia Non-Destructive Testing Equipment Industry Revenue (Million) Forecast, by Application 2020 & 2033
- Table 36: United Arab Emirates Non-Destructive Testing Equipment Industry Revenue (Million) Forecast, by Application 2020 & 2033
- Table 37: Qatar Non-Destructive Testing Equipment Industry Revenue (Million) Forecast, by Application 2020 & 2033
Frequently Asked Questions
1. What is the projected Compound Annual Growth Rate (CAGR) of the Non-Destructive Testing Equipment Industry?
The projected CAGR is approximately 7.20%.
2. Which companies are prominent players in the Non-Destructive Testing Equipment Industry?
Key companies in the market include Intertek Group PLC, YXLON International GmbH (COMET Holding AG), Baker Hughes, Controle Mesure Systemes SA, Nikon Metrology NV, Fujifilm Corporation, Mistras Group Inc, OkoNDT Group, Innospection Limited, Applus+ Laboratories, Bureau Veritas SA, Olympus Corporation, Magnaflux Corp.
3. What are the main segments of the Non-Destructive Testing Equipment Industry?
The market segments include Technology, End-user Industry.
4. Can you provide details about the market size?
The market size is estimated to be USD 3.02 Million as of 2022.
5. What are some drivers contributing to market growth?
Stringent Regulations Mandating Safety; Aging Infrastructure and Increasing Need for Maintenance.
6. What are the notable trends driving market growth?
Oil and Gas Holds Highest Market Share.
7. Are there any restraints impacting market growth?
Lack of Skilled Personnel and Training Facilities.
8. Can you provide examples of recent developments in the market?
May 2023: MP Machinery and Testing announced the release of proprietary material testing equipment that non-destructively determines the material properties of structures and in-service components. MPM provides advanced material testing products and services for the steel, nuclear power & energy, aerospace, pipe, defense, and transportation industries.
9. What pricing options are available for accessing the report?
Pricing options include single-user, multi-user, and enterprise licenses priced at USD 4750, USD 5250, and USD 8750 respectively.
10. Is the market size provided in terms of value or volume?
The market size is provided in terms of value, measured in Million.
11. Are there any specific market keywords associated with the report?
Yes, the market keyword associated with the report is "Non-Destructive Testing Equipment Industry," which aids in identifying and referencing the specific market segment covered.
12. How do I determine which pricing option suits my needs best?
The pricing options vary based on user requirements and access needs. Individual users may opt for single-user licenses, while businesses requiring broader access may choose multi-user or enterprise licenses for cost-effective access to the report.
13. Are there any additional resources or data provided in the Non-Destructive Testing Equipment Industry report?
While the report offers comprehensive insights, it's advisable to review the specific contents or supplementary materials provided to ascertain if additional resources or data are available.
14. How can I stay updated on further developments or reports in the Non-Destructive Testing Equipment Industry?
To stay informed about further developments, trends, and reports in the Non-Destructive Testing Equipment Industry, consider subscribing to industry newsletters, following relevant companies and organizations, or regularly checking reputable industry news sources and publications.
Methodology
Step 1 - Identification of Relevant Samples Size from Population Database


Step 2 - Approaches for Defining Global Market Size (Value, Volume* & Price*)

Note*: In applicable scenarios
Step 3 - Data Sources
Primary Research
- Web Analytics
- Survey Reports
- Research Institute
- Latest Research Reports
- Opinion Leaders
Secondary Research
- Annual Reports
- White Paper
- Latest Press Release
- Industry Association
- Paid Database
- Investor Presentations

Step 4 - Data Triangulation
Involves using different sources of information in order to increase the validity of a study
These sources are likely to be stakeholders in a program - participants, other researchers, program staff, other community members, and so on.
Then we put all data in single framework & apply various statistical tools to find out the dynamic on the market.
During the analysis stage, feedback from the stakeholder groups would be compared to determine areas of agreement as well as areas of divergence