

Key Insights
The North American Testing, Inspection, and Certification (TIC) market is projected for significant expansion, estimated at $1125.21 million in 2025, with an anticipated Compound Annual Growth Rate (CAGR) of 4.88% from 2025 to 2033. This growth is propelled by increasing regulatory demands across vital sectors including food, agriculture, environmental protection, and manufacturing, necessitating stringent quality assurance and compliance. Enhanced focus on supply chain integrity and risk management is also driving businesses toward independent verification to guarantee product safety and quality. Technological advancements and the integration of data analytics are further enhancing efficiency and accuracy within TIC services. Key growth drivers include rising consumer awareness and stricter environmental mandates, particularly in consumer goods, retail, and environmental testing (effluent, water, soil, and air).
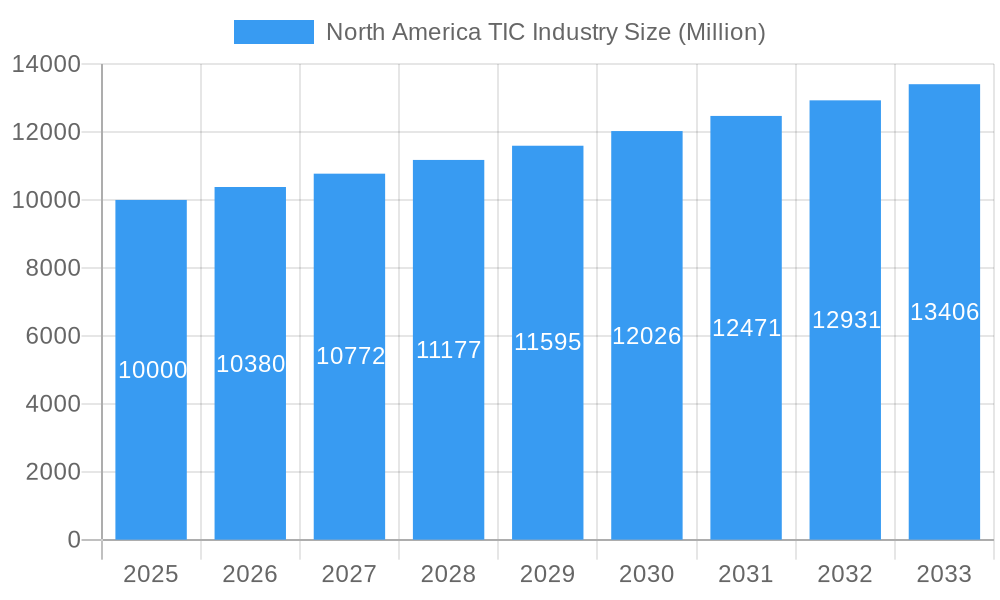
North America TIC Industry Market Size (In Billion)
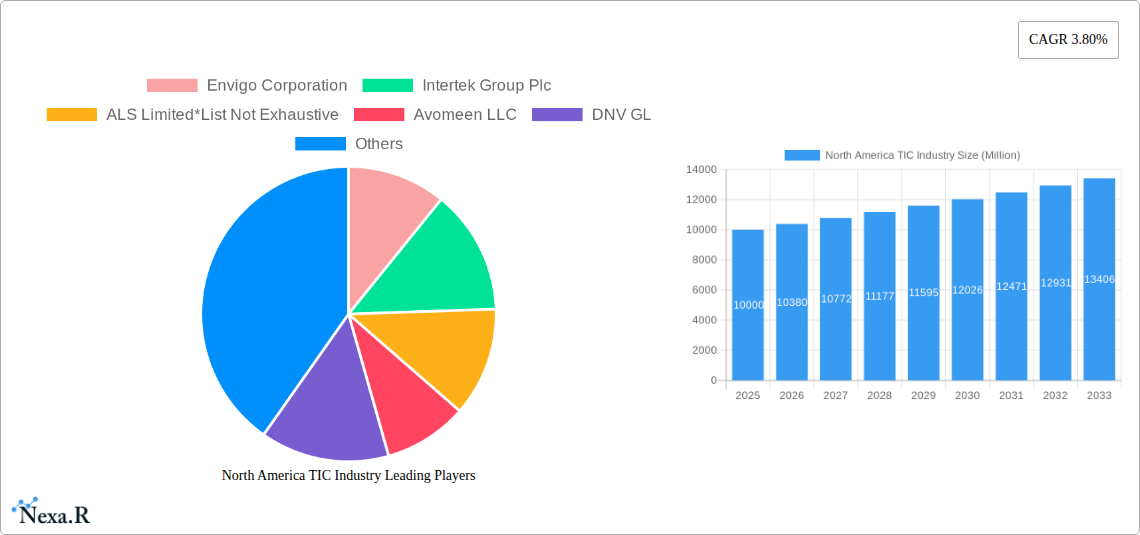
The United States leads the North American TIC market, with Canada representing a notable secondary market. Service delivery is predominantly outsourced, underscoring a preference for specialized expertise and scalable solutions. However, in-house operations remain significant, especially for larger enterprises with established quality control frameworks. The competitive environment is dynamic, featuring major global players such as Intertek Group Plc, SGS SA, and Bureau Veritas, alongside specialized regional firms. Opportunities for all market participants exist, particularly for those delivering innovative solutions and technological advancements within specialized segments.
North America TIC Industry Company Market Share
North America TIC Industry Market Report: 2019-2033
This comprehensive report provides an in-depth analysis of the North American Testing, Inspection, and Certification (TIC) industry, covering the period 2019-2033. It offers invaluable insights for industry professionals, investors, and strategic decision-makers seeking to understand market dynamics, growth trends, and future opportunities within this crucial sector. The report leverages extensive data and expert analysis to deliver a clear and actionable understanding of the North American TIC landscape.
North America TIC Industry Market Dynamics & Structure
The North American TIC market is characterized by a moderately concentrated landscape with several large multinational players and a significant number of smaller, specialized firms. Market concentration is influenced by ongoing mergers and acquisitions (M&A) activity, with approximately xx M&A deals recorded between 2019 and 2024, resulting in a xx% market share for the top 5 players in 2024. Technological innovation, particularly in areas like AI and automation, is a key driver, increasing efficiency and expanding service offerings. Stringent regulatory frameworks across various sectors (e.g., FDA regulations for food and pharmaceuticals) significantly influence demand for TIC services. The industry faces competition from internal testing capabilities within large corporations (in-house TIC), which is gradually increasing.
- Market Concentration: Moderately concentrated, with top 5 players holding xx% market share in 2024.
- Technological Innovation: AI, automation, and advanced analytical techniques are driving efficiency and expanding service capabilities.
- Regulatory Landscape: Stringent regulations across various sectors are key demand drivers.
- Competitive Landscape: Competition from both established TIC providers and in-house testing capabilities.
- M&A Activity: Significant M&A activity shaping market consolidation. xx deals recorded between 2019 and 2024.
- End-User Demographics: Diversified across various sectors; significant growth expected in consumer goods, environmental testing, and renewable energy.
North America TIC Industry Growth Trends & Insights
The North American TIC market exhibited a Compound Annual Growth Rate (CAGR) of xx% during the historical period (2019-2024), reaching a market size of $xx million in 2024. This growth is attributed to factors such as increasing regulatory scrutiny, growing consumer awareness of product safety and quality, and the expanding adoption of TIC services across various sectors. The market is projected to maintain a healthy growth trajectory, with a forecasted CAGR of xx% from 2025 to 2033, reaching $xx million by 2033. Technological disruptions, particularly advancements in data analytics and remote inspection technologies, are accelerating market adoption. Consumer behavior shifts towards increased demand for sustainable and ethically sourced products further fuel the demand for TIC services. Market penetration in specific sectors, such as renewable energy and advanced manufacturing, is expected to significantly increase, surpassing xx% by 2033.
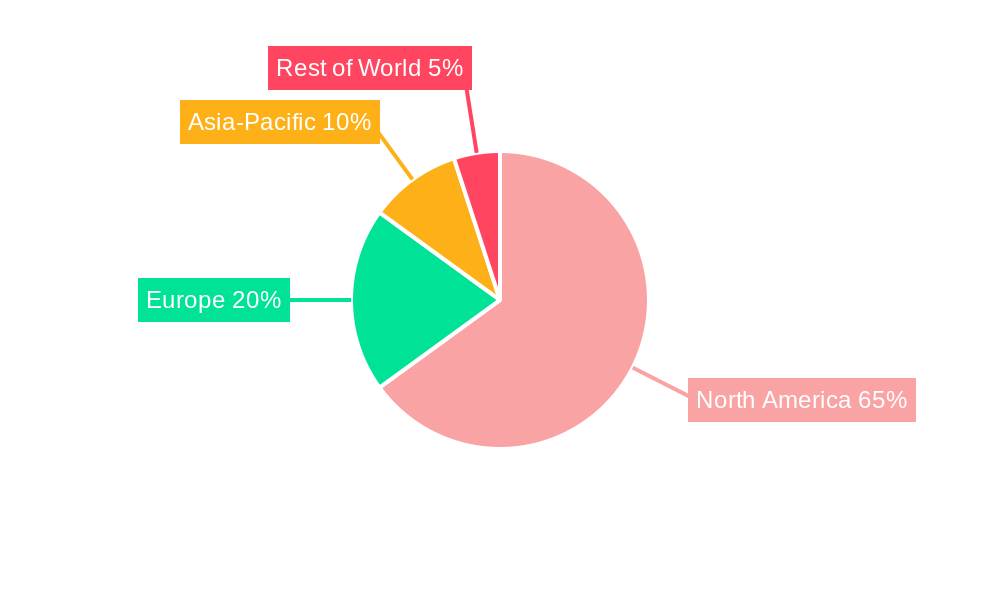
Dominant Regions, Countries, or Segments in North America TIC Industry
The United States dominates the North American TIC market, accounting for approximately xx% of the total market value in 2024, driven by a large and diversified economy and robust regulatory frameworks. The Environmental (Effluent, Water, Soil, Air) and Consumer Goods and Retail segments are the largest, contributing xx% and xx% to the overall market value respectively in 2024. Canada represents a significant portion (xx%) of the North American TIC market and is experiencing steady growth driven by infrastructure development and increasing regulatory compliance. The Outsourced TIC segment dominates, driven by the cost-effectiveness and expertise provided by specialized firms, while in-house capabilities are increasingly prevalent in larger corporations.
- Leading Region: United States (xx% market share in 2024)
- Leading Segments: Environmental (xx%) and Consumer Goods & Retail (xx%)
- Key Drivers (US): Strong regulatory environment, diversified economy, technological advancements.
- Key Drivers (Canada): Infrastructure development, growing regulatory compliance needs.
- Growth Potential: High growth potential in renewable energy, advanced manufacturing, and emerging technologies within all segments.
North America TIC Industry Product Landscape
The TIC industry offers a diverse range of testing, inspection, and certification services tailored to specific industry needs. Recent innovations include the application of AI-powered image analysis for faster and more accurate inspections, remote sensing technologies for environmental monitoring, and blockchain-based solutions for enhancing data security and traceability. These innovations contribute to higher efficiency, enhanced accuracy, and reduced operational costs for clients. Key performance indicators include turnaround time, accuracy rates, and compliance with relevant standards. Unique selling propositions often focus on specialized expertise, accreditation to specific standards, and innovative technological solutions.
Key Drivers, Barriers & Challenges in North America TIC Industry
Key Drivers: Stringent government regulations, increasing consumer demand for quality and safety, advancements in testing technologies, and growth in industries like renewable energy are driving the market. Specifically, the need for environmental compliance and sustainable practices fuels growth in environmental testing.
Key Challenges: Competition from in-house testing capabilities within larger companies reduces the market share of external TIC providers. Supply chain disruptions can impact the availability of testing equipment and materials. Regulatory complexities and varying standards across different regions create hurdles for efficient operation. The cost of implementing new technologies and training personnel can be a significant barrier for smaller firms.
Emerging Opportunities in North America TIC Industry
Untapped opportunities exist within the renewable energy sector, requiring comprehensive testing and certification of new technologies. The growing adoption of Industry 4.0 principles presents opportunities for developing specialized TIC services related to the automation and connectivity of manufacturing processes. The development of sustainable and ethical sourcing practices requires increased focus on supply chain testing and traceability, opening new market segments for TIC providers.
Growth Accelerators in the North America TIC Industry Industry
Technological advancements, strategic partnerships between TIC providers and technology companies, and expansion into new markets like emerging economies are key growth catalysts. The increasing adoption of cloud-based solutions for data management and analysis contributes to operational efficiency and scalability. Strategic acquisitions and mergers allow industry players to expand their service offerings and market reach.
Notable Milestones in North America TIC Industry Sector
- September 2022: SGS SA acquired Penumbra Security Inc., expanding its information security testing capabilities.
- March 2022: DEKRA selected to develop a Vehicle-Grid Innovation Laboratory (ViGIL) in California, boosting its EV testing services.
In-Depth North America TIC Industry Market Outlook
The North American TIC market is poised for continued growth, driven by technological innovation, increasing regulatory compliance needs, and the expansion of key industries. Strategic partnerships, acquisitions, and investments in advanced technologies will play a crucial role in shaping the future market landscape. The focus on sustainable practices and ethical sourcing will further drive demand for specialized TIC services. The market offers significant opportunities for companies that can effectively leverage technology and adapt to evolving regulatory requirements.
North America TIC Industry Segmentation
-
1. Type
- 1.1. Outsourced
- 1.2. In-house
-
2. End-User Vertical
- 2.1. Consumer Goods and Retail
- 2.2. Environmental (Effluent, Water, Soil, Air)
- 2.3. Food and Agriculture
- 2.4. Manufacturing and Industrial Goods
- 2.5. Oil and Gas
- 2.6. Construction and Engineering
- 2.7. Other End-user Verticals
North America TIC Industry Segmentation By Geography
-
1. North America
- 1.1. United States
- 1.2. Canada
- 1.3. Mexico
North America TIC Industry Regional Market Share
Geographic Coverage of North America TIC Industry
North America TIC Industry REPORT HIGHLIGHTS
| Aspects | Details |
|---|---|
| Study Period | 2020-2034 |
| Base Year | 2025 |
| Estimated Year | 2026 |
| Forecast Period | 2026-2034 |
| Historical Period | 2020-2025 |
| Growth Rate | CAGR of 4.88% from 2020-2034 |
| Segmentation |
|
Table of Contents
- 1. Introduction
- 1.1. Research Scope
- 1.2. Market Segmentation
- 1.3. Research Objective
- 1.4. Definitions and Assumptions
- 2. Executive Summary
- 2.1. Market Snapshot
- 3. Market Dynamics
- 3.1. Market Drivers
- 3.2. Market Restrains
- 3.3. Market Trends
- 3.4. Market Opportunities
- 4. Market Factor Analysis
- 4.1. Porters Five Forces
- 4.1.1. Bargaining Power of Suppliers
- 4.1.2. Bargaining Power of Buyers
- 4.1.3. Threat of New Entrants
- 4.1.4. Threat of Substitutes
- 4.1.5. Competitive Rivalry
- 4.2. PESTEL analysis
- 4.3. BCG Analysis
- 4.3.1. Stars (High Growth, High Market Share)
- 4.3.2. Cash Cows (Low Growth, High Market Share)
- 4.3.3. Question Mark (High Growth, Low Market Share)
- 4.3.4. Dogs (Low Growth, Low Market Share)
- 4.4. Ansoff Matrix Analysis
- 4.5. Supply Chain Analysis
- 4.6. Regulatory Landscape
- 4.7. Current Market Potential and Opportunity Assessment (TAM–SAM–SOM Framework)
- 4.8. NRP Analyst Note
- 4.1. Porters Five Forces
- 5. Market Analysis, Insights and Forecast 2021-2033
- 5.1. Market Analysis, Insights and Forecast - by Type
- 5.1.1. Outsourced
- 5.1.2. In-house
- 5.2. Market Analysis, Insights and Forecast - by End-User Vertical
- 5.2.1. Consumer Goods and Retail
- 5.2.2. Environmental (Effluent, Water, Soil, Air)
- 5.2.3. Food and Agriculture
- 5.2.4. Manufacturing and Industrial Goods
- 5.2.5. Oil and Gas
- 5.2.6. Construction and Engineering
- 5.2.7. Other End-user Verticals
- 5.3. Market Analysis, Insights and Forecast - by Region
- 5.3.1. North America
- 5.1. Market Analysis, Insights and Forecast - by Type
- 6. North America TIC Industry Analysis, Insights and Forecast, 2021-2033
- 6.1. Market Analysis, Insights and Forecast - by Type
- 6.1.1. Outsourced
- 6.1.2. In-house
- 6.2. Market Analysis, Insights and Forecast - by End-User Vertical
- 6.2.1. Consumer Goods and Retail
- 6.2.2. Environmental (Effluent, Water, Soil, Air)
- 6.2.3. Food and Agriculture
- 6.2.4. Manufacturing and Industrial Goods
- 6.2.5. Oil and Gas
- 6.2.6. Construction and Engineering
- 6.2.7. Other End-user Verticals
- 6.1. Market Analysis, Insights and Forecast - by Type
- 7. Competitive Analysis
- 7.1. Company Profiles
- 7.1.1 Envigo Corporation
- 7.1.1.1. Company Overview
- 7.1.1.2. Products
- 7.1.1.3. Company Financials
- 7.1.1.4. SWOT Analysis
- 7.1.2 Intertek Group Plc
- 7.1.2.1. Company Overview
- 7.1.2.2. Products
- 7.1.2.3. Company Financials
- 7.1.2.4. SWOT Analysis
- 7.1.3 ALS Limited*List Not Exhaustive
- 7.1.3.1. Company Overview
- 7.1.3.2. Products
- 7.1.3.3. Company Financials
- 7.1.3.4. SWOT Analysis
- 7.1.4 Avomeen LLC
- 7.1.4.1. Company Overview
- 7.1.4.2. Products
- 7.1.4.3. Company Financials
- 7.1.4.4. SWOT Analysis
- 7.1.5 DNV GL
- 7.1.5.1. Company Overview
- 7.1.5.2. Products
- 7.1.5.3. Company Financials
- 7.1.5.4. SWOT Analysis
- 7.1.6 Applus Services SA
- 7.1.6.1. Company Overview
- 7.1.6.2. Products
- 7.1.6.3. Company Financials
- 7.1.6.4. SWOT Analysis
- 7.1.7 AB Sciex LLC
- 7.1.7.1. Company Overview
- 7.1.7.2. Products
- 7.1.7.3. Company Financials
- 7.1.7.4. SWOT Analysis
- 7.1.8 SGS SA
- 7.1.8.1. Company Overview
- 7.1.8.2. Products
- 7.1.8.3. Company Financials
- 7.1.8.4. SWOT Analysis
- 7.1.9 Mistras Group
- 7.1.9.1. Company Overview
- 7.1.9.2. Products
- 7.1.9.3. Company Financials
- 7.1.9.4. SWOT Analysis
- 7.1.10 DEKRA SE
- 7.1.10.1. Company Overview
- 7.1.10.2. Products
- 7.1.10.3. Company Financials
- 7.1.10.4. SWOT Analysis
- 7.1.11 Bureau Veritas
- 7.1.11.1. Company Overview
- 7.1.11.2. Products
- 7.1.11.3. Company Financials
- 7.1.11.4. SWOT Analysis
- 7.1.12 UL LLC
- 7.1.12.1. Company Overview
- 7.1.12.2. Products
- 7.1.12.3. Company Financials
- 7.1.12.4. SWOT Analysis
- 7.1.13 TUV SUD
- 7.1.13.1. Company Overview
- 7.1.13.2. Products
- 7.1.13.3. Company Financials
- 7.1.13.4. SWOT Analysis
- 7.1.1 Envigo Corporation
- 7.2. Market Entropy
- 7.2.1 Company's Key Areas Served
- 7.2.2 Recent Developments
- 7.3. Company Market Share Analysis 2025
- 7.3.1 Top 5 Companies Market Share Analysis
- 7.3.2 Top 3 Companies Market Share Analysis
- 7.4. List of Potential Customers
- 8. Research Methodology
List of Figures
- Figure 1: North America TIC Industry Revenue Breakdown (million, %) by Product 2025 & 2033
- Figure 2: North America TIC Industry Share (%) by Company 2025
List of Tables
- Table 1: North America TIC Industry Revenue million Forecast, by Type 2020 & 2033
- Table 2: North America TIC Industry Revenue million Forecast, by End-User Vertical 2020 & 2033
- Table 3: North America TIC Industry Revenue million Forecast, by Region 2020 & 2033
- Table 4: North America TIC Industry Revenue million Forecast, by Type 2020 & 2033
- Table 5: North America TIC Industry Revenue million Forecast, by End-User Vertical 2020 & 2033
- Table 6: North America TIC Industry Revenue million Forecast, by Country 2020 & 2033
- Table 7: United States North America TIC Industry Revenue (million) Forecast, by Application 2020 & 2033
- Table 8: Canada North America TIC Industry Revenue (million) Forecast, by Application 2020 & 2033
- Table 9: Mexico North America TIC Industry Revenue (million) Forecast, by Application 2020 & 2033
Frequently Asked Questions
1. What is the projected Compound Annual Growth Rate (CAGR) of the North America TIC Industry?
The projected CAGR is approximately 4.88%.
2. Which companies are prominent players in the North America TIC Industry?
Key companies in the market include Envigo Corporation, Intertek Group Plc, ALS Limited*List Not Exhaustive, Avomeen LLC, DNV GL, Applus Services SA, AB Sciex LLC, SGS SA, Mistras Group, DEKRA SE, Bureau Veritas, UL LLC, TUV SUD.
3. What are the main segments of the North America TIC Industry?
The market segments include Type, End-User Vertical.
4. Can you provide details about the market size?
The market size is estimated to be USD 1125.21 million as of 2022.
5. What are some drivers contributing to market growth?
Highly Developed Regulatory Framework; Growing Demand For Outsourced Servic.
6. What are the notable trends driving market growth?
Automotive Industry Holds Significant Market Share.
7. Are there any restraints impacting market growth?
Entry Barriers for New Players and Standardization Concerns Especially in the Case of Inter-border Transactions.
8. Can you provide examples of recent developments in the market?
September 2022: SGS SA acquired Penumbra Security Inc., a recognized leader in different types of information security conformance testing to government standards and regulatory compliance for multinational companies. In addition, the company is accredited by the National Voluntary Laboratory Programs for Federal Information Processing Standard test methods (FIPS 140-2/3). This helps in the further development of TIC services for the company.
9. What pricing options are available for accessing the report?
Pricing options include single-user, multi-user, and enterprise licenses priced at USD 4750, USD 4950, and USD 6800 respectively.
10. Is the market size provided in terms of value or volume?
The market size is provided in terms of value, measured in million.
11. Are there any specific market keywords associated with the report?
Yes, the market keyword associated with the report is "North America TIC Industry," which aids in identifying and referencing the specific market segment covered.
12. How do I determine which pricing option suits my needs best?
The pricing options vary based on user requirements and access needs. Individual users may opt for single-user licenses, while businesses requiring broader access may choose multi-user or enterprise licenses for cost-effective access to the report.
13. Are there any additional resources or data provided in the North America TIC Industry report?
While the report offers comprehensive insights, it's advisable to review the specific contents or supplementary materials provided to ascertain if additional resources or data are available.
14. How can I stay updated on further developments or reports in the North America TIC Industry?
To stay informed about further developments, trends, and reports in the North America TIC Industry, consider subscribing to industry newsletters, following relevant companies and organizations, or regularly checking reputable industry news sources and publications.
Methodology
Step 1 - Identification of Relevant Samples Size from Population Database


Step 2 - Approaches for Defining Global Market Size (Value, Volume* & Price*)

Note*: In applicable scenarios
Step 3 - Data Sources
Primary Research
- Web Analytics
- Survey Reports
- Research Institute
- Latest Research Reports
- Opinion Leaders
Secondary Research
- Annual Reports
- White Paper
- Latest Press Release
- Industry Association
- Paid Database
- Investor Presentations

Step 4 - Data Triangulation
Involves using different sources of information in order to increase the validity of a study
These sources are likely to be stakeholders in a program - participants, other researchers, program staff, other community members, and so on.
Then we put all data in single framework & apply various statistical tools to find out the dynamic on the market.
During the analysis stage, feedback from the stakeholder groups would be compared to determine areas of agreement as well as areas of divergence