

Key Insights
The global Occupancy Sensor market is projected to reach $3.07 billion by 2025, exhibiting a robust Compound Annual Growth Rate (CAGR) of 11.92%. This significant growth is driven by an intensified focus on energy efficiency and sustainability across residential, commercial, and industrial sectors. Mandates for reduced energy consumption from governments worldwide are compelling property owners to integrate smart technologies, including occupancy sensors, to optimize lighting and HVAC systems. The proliferation of IoT and smart building solutions further propels this market, with occupancy sensors acting as a cornerstone for automated building functions, enhanced occupant comfort, and improved safety. Key growth catalysts include escalating energy prices, heightened environmental consciousness, and the demand for intelligent automation in contemporary infrastructure.
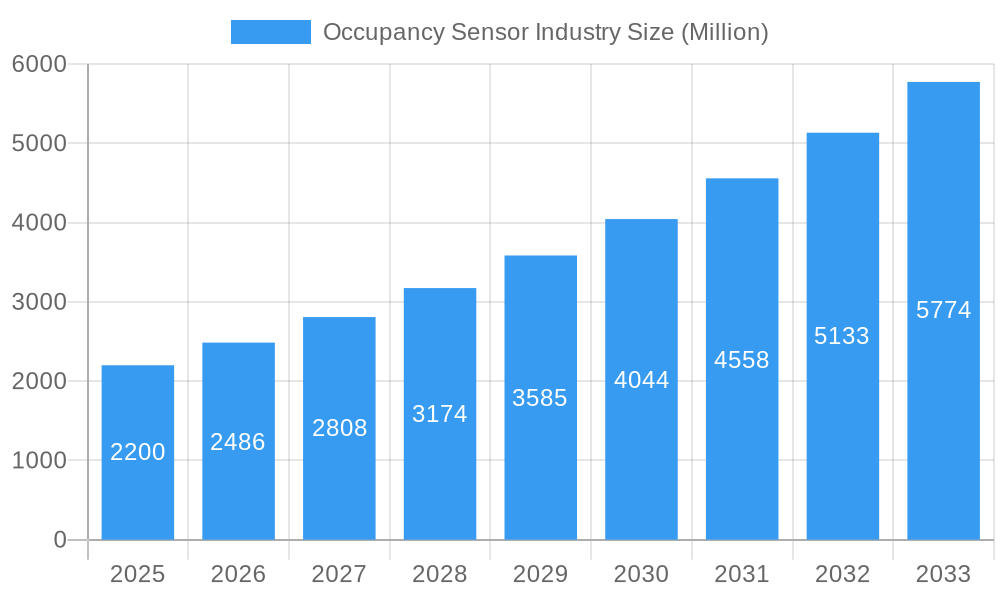
Occupancy Sensor Industry Market Size (In Billion)
The market is segmented by network type, technology, building type, and application, presenting varied opportunities. Wireless solutions are increasingly favored for their simplified installation and adaptability. Among sensor technologies, Passive Infrared (PIR) sensors currently dominate, though Ultrasonic and Microwave technologies are gaining traction due to their enhanced precision and dual-technology capabilities. The residential and commercial segments represent the largest shares, with lighting control and HVAC automation spearheading growth applications. Security and surveillance also constitute a notable application area, utilizing occupancy sensors for advanced threat detection and automated responses. Despite strong market expansion, potential challenges may include the upfront investment for extensive implementations and the requirement for specialized installation and maintenance expertise. Nevertheless, the substantial long-term advantages in operational cost reduction and enhanced sustainability are anticipated to drive sustained market growth.
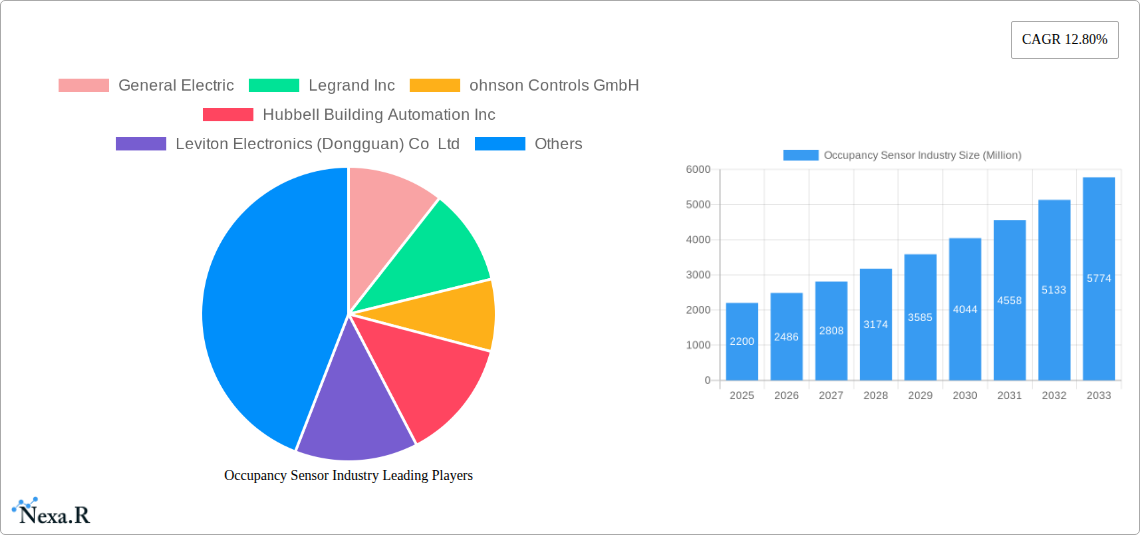
Occupancy Sensor Industry Company Market Share
Occupancy Sensor Market: Intelligence for Smarter Spaces
This comprehensive Occupancy Sensor Industry report offers an in-depth analysis of market dynamics, growth trends, and future projections from 2019 to 2033, with a base year of 2025. Delving into the intricacies of parent and child markets, we provide critical insights for industry professionals, stakeholders, and investors. Our analysis focuses on a global scale, presenting all quantitative values in millions of units.
Occupancy Sensor Industry Market Dynamics & Structure
The global occupancy sensor market exhibits a moderately concentrated structure, with key players like General Electric, Legrand Inc., and Johnson Controls GmbH holding significant sway. Technological innovation is a primary driver, fueled by advancements in AI, IoT, and energy efficiency mandates. Regulatory frameworks, particularly those focused on sustainability and smart building certifications, are increasingly influencing adoption. Competitive product substitutes, such as manual controls and simpler timed switches, are gradually being displaced by the superior automation and data capabilities of occupancy sensors. End-user demographics are shifting towards a greater demand for intelligent building solutions in both residential and commercial sectors, driven by cost savings and enhanced occupant comfort. Mergers and acquisitions (M&A) activity, while not exhaustive, has been observed as companies seek to expand their product portfolios and market reach. For instance, recent M&A activity has targeted niche technology providers to enhance existing offerings. Barriers to innovation include the high cost of sophisticated sensor development and integration challenges within existing building infrastructure. The market is estimated to be worth approximately $3,500 million units in the base year 2025.
- Market Concentration: Moderate, with a few dominant players and a growing number of specialized entrants.
- Technological Innovation Drivers: AI integration, advanced sensor accuracy, energy efficiency standards, and IoT connectivity.
- Regulatory Frameworks: Building codes, energy efficiency directives, and smart city initiatives are key influencers.
- Competitive Product Substitutes: Manual controls, timers, and basic motion detectors.
- End-User Demographics: Increasing adoption by facility managers, building owners, and environmentally conscious consumers.
- M&A Trends: Strategic acquisitions to gain technological expertise and market share.
- Innovation Barriers: High R&D costs, interoperability issues, and data security concerns.
Occupancy Sensor Industry Growth Trends & Insights
The occupancy sensor market is poised for substantial growth, projected to expand at a robust Compound Annual Growth Rate (CAGR) of approximately 12% from 2025 to 2033. This expansion is propelled by a confluence of factors, including escalating energy consciousness, stringent government regulations aimed at reducing carbon footprints, and the burgeoning smart building revolution. The adoption rate of occupancy sensors is rapidly increasing across diverse applications, moving beyond simple lighting control to encompass HVAC optimization, security enhancements, and intelligent space management. Technological disruptions, such as the integration of Artificial Intelligence (AI) and the Internet of Things (IoT), are creating more sophisticated and versatile sensor solutions. For example, the development of edge AI in sensors allows for real-time data processing and enhanced privacy. Consumer behavior is shifting towards prioritizing comfort, convenience, and sustainable living, all of which are directly addressed by the capabilities of smart occupancy sensing technology. The market penetration of occupancy sensors in new construction is rapidly increasing, while retrofitting existing buildings presents a significant untapped opportunity. The global market size is projected to grow from an estimated $3,500 million units in 2025 to over $8,000 million units by 2033.
- Market Size Evolution: Significant growth from an estimated $3,500 million units in 2025 to over $8,000 million units by 2033.
- Adoption Rates: Steadily increasing across residential, commercial, and industrial sectors.
- Technological Disruptions: Integration of AI, IoT, and advanced detection methodologies.
- Consumer Behavior Shifts: Growing demand for energy savings, comfort, and automated environments.
- Market Penetration: High in new builds, with substantial potential in retrofitting existing structures.
- CAGR: Approximately 12% from 2025 to 2033.
Dominant Regions, Countries, or Segments in Occupancy Sensor Industry
The Wireless Network Type segment is a dominant force in the occupancy sensor industry, driven by its ease of installation, flexibility, and scalability, making it ideal for both new constructions and retrofits. This dominance is particularly pronounced in the Commercial Building Type sector, where facility managers prioritize cost-effective and non-disruptive deployment for applications like Lighting Control and HVAC optimization. North America, specifically the United States, stands as a leading region due to its advanced technological infrastructure, stringent energy efficiency regulations, and a high adoption rate of smart building technologies. Government incentives for green building initiatives and a strong emphasis on operational cost reduction further bolster market growth in this region. The Passive Infrared (PIR) technology, renowned for its cost-effectiveness and reliability, continues to hold a significant market share within the broader technology landscape, though advanced technologies like Microwave and Ultrasonic are gaining traction for their enhanced accuracy and ability to detect subtle movements. The increasing smart city initiatives and the rise of IoT-enabled infrastructure are creating a fertile ground for the widespread deployment of occupancy sensors across various applications.
- Dominant Network Type: Wireless, offering flexibility and ease of installation.
- Dominant Building Type: Commercial buildings, driven by energy efficiency and operational cost savings.
- Dominant Application: Lighting Control, followed closely by HVAC optimization.
- Leading Region: North America (particularly the USA), supported by strong regulatory push and technological adoption.
- Key Drivers in Dominant Regions/Segments:
- Economic Policies: Incentives for energy-efficient buildings, smart city development grants.
- Infrastructure: Robust IoT and wireless network infrastructure.
- Regulatory Frameworks: Building codes mandating energy performance, smart building certifications.
- Technological Advancement: Continuous innovation in sensor accuracy and connectivity.
- Market Share: Wireless segment estimated to hold over 65% of the market share in 2025.
Occupancy Sensor Industry Product Landscape
The occupancy sensor product landscape is characterized by a rapid evolution of technologies and applications. Innovations are focused on enhanced detection accuracy, improved energy efficiency, seamless integration with Building Management Systems (BMS), and advanced data analytics capabilities. Products now range from simple PIR sensors for basic lighting control to sophisticated multi-technology sensors incorporating ultrasonic and microwave detection for nuanced environmental monitoring. Unique selling propositions often lie in features such as zone-based occupancy detection, daylight harvesting integration, and remote configuration via mobile applications. Key performance metrics include detection range, accuracy rates (minimizing false triggers), power consumption, and wireless connectivity stability. The integration of edge AI is enabling localized data processing for real-time insights without the need for constant cloud connectivity.
Key Drivers, Barriers & Challenges in Occupancy Sensor Industry
Key Drivers:
- Energy Efficiency Mandates: Government regulations and corporate sustainability goals are pushing for reduced energy consumption, making occupancy sensors a critical component.
- Smart Building Adoption: The increasing trend of smart buildings, driven by IoT and automation, fuels demand for intelligent sensing solutions.
- Cost Savings: Occupancy sensors significantly reduce operational costs by optimizing lighting and HVAC usage when spaces are unoccupied.
- Technological Advancements: Innovations in sensor accuracy, connectivity, and AI integration enhance performance and broaden applications.
Barriers & Challenges:
- Initial Cost of Implementation: While long-term savings are significant, the upfront investment for advanced occupancy sensor systems can be a barrier for some businesses and homeowners.
- Integration Complexity: Integrating new sensor systems with existing building infrastructure and legacy systems can be technically challenging and time-consuming.
- Data Privacy and Security Concerns: As sensors collect more data, ensuring the privacy and security of this information is paramount, posing a challenge for widespread adoption in sensitive environments.
- Consumer Awareness and Education: A lack of widespread understanding of the full benefits and capabilities of occupancy sensors can hinder adoption in the residential sector.
- Supply Chain Disruptions: Global supply chain issues can impact the availability and cost of components, affecting production and pricing. The estimated impact of these challenges on market growth in the short term is approximately 2-3%.
Emerging Opportunities in Occupancy Sensor Industry
Emerging opportunities in the occupancy sensor industry lie in the development of highly specialized sensors for niche applications, such as healthcare facilities for patient monitoring and hygiene control, and smart retail for customer flow analysis and personalized experiences. The growing focus on occupant well-being and the demand for data-driven insights into space utilization present significant untapped markets. Furthermore, the integration of occupancy data with other smart building systems (e.g., security, air quality) to create truly intelligent and responsive environments offers immense potential. The development of more affordable and user-friendly DIY occupancy sensing solutions for the residential market is also a key area for growth.
Growth Accelerators in the Occupancy Sensor Industry Industry
Long-term growth in the occupancy sensor industry is being significantly accelerated by continuous technological breakthroughs, particularly in the realms of AI-powered analytics and advanced sensor fusion. The increasing convergence of occupancy sensing with other IoT devices within smart buildings creates synergistic opportunities, leading to more comprehensive building automation and management. Strategic partnerships between sensor manufacturers, software providers, and building integrators are crucial for developing end-to-end solutions and expanding market reach. Furthermore, the growing global awareness and implementation of sustainability initiatives and smart city projects are creating a sustained demand for intelligent building technologies, with occupancy sensors at their core.
Key Players Shaping the Occupancy Sensor Industry Market
- General Electric
- Legrand Inc.
- Johnson Controls GmbH
- Hubbell Building Automation Inc.
- Leviton Electronics (Dongguan) Co Ltd.
- Honeywell International
- Schneider Electric
- Texas Instruments Incorporated
- Pammvi Group
- Philips Ltd.
- Lutron Electronics Inc.
- Eaton Corporation
Notable Milestones in Occupancy Sensor Industry Sector
- June 2022: Butlr launched as an occupancy-sensing platform that captures the presence and movement of individuals within a space in real-time, stating that the data gathered by the platform can be utilized to revolutionize the workplace. Butlr's platform's spatial insights, occupancy, and activity analytics may be utilized to make data-driven real estate and design decisions, as well as to improve the tenant experience.
- April 2022: Lumentum Holdings Inc. and Ambarella Inc. launched a new collaborative reference design for smart building applications that integrates edge artificial intelligence (AI) with privacy. This combination enables the deployment of small AIoT sensors with local processing throughout buildings for applications such as occupancy sensor systems, intelligent space management, and smart retail.
In-Depth Occupancy Sensor Industry Market Outlook
The future outlook for the occupancy sensor industry is exceptionally bright, characterized by sustained high growth and expanding application horizons. Emerging trends such as predictive maintenance, hyper-personalized building environments, and enhanced occupant safety will further solidify the role of occupancy sensors. The increasing integration of advanced analytics and machine learning will unlock deeper insights into building usage patterns, driving unprecedented levels of efficiency and user experience. Strategic collaborations and a focus on developing interoperable ecosystems will be key to capitalizing on the full potential of smart buildings. The industry is well-positioned to benefit from ongoing global initiatives promoting sustainability and digital transformation, making it a crucial component of future smart infrastructure.
Occupancy Sensor Industry Segmentation
-
1. Network Type
- 1.1. Wired
- 1.2. Wireless
-
2. Technology
- 2.1. Ultrasonic
- 2.2. Passive Infrared
- 2.3. Microwave
-
3. Building Type
- 3.1. Residential
- 3.2. Commercial
-
4. Application
- 4.1. Lighting Control
- 4.2. HVAC
- 4.3. Security and Surveillance
- 4.4. Other Applications
Occupancy Sensor Industry Segmentation By Geography
-
1. North America
- 1.1. United States
- 1.2. Canada
-
2. Europe
- 2.1. United Kingdom
- 2.2. France
- 2.3. Germany
- 2.4. Italy
- 2.5. Rest of Europe
-
3. Asia Pacific
- 3.1. China
- 3.2. Japan
- 3.3. South Korea
- 3.4. Australia
- 3.5. Rest of Asia Pacific
-
4. Latin America
- 4.1. Mexico
- 4.2. Rest of Latin America
- 5. Middle East and Africa
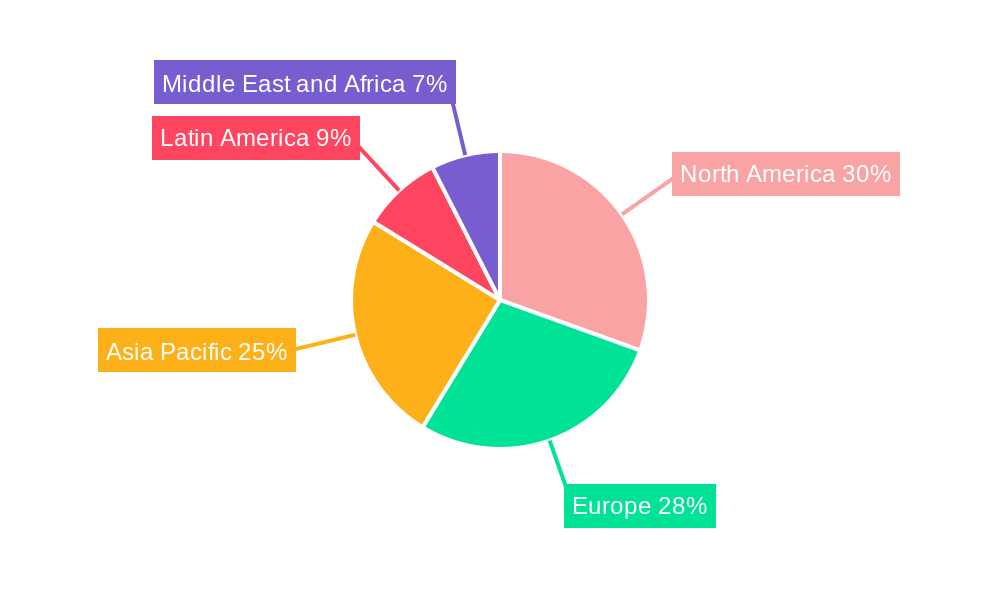
Occupancy Sensor Industry Regional Market Share
Geographic Coverage of Occupancy Sensor Industry
Occupancy Sensor Industry REPORT HIGHLIGHTS
| Aspects | Details |
|---|---|
| Study Period | 2020-2034 |
| Base Year | 2025 |
| Estimated Year | 2026 |
| Forecast Period | 2026-2034 |
| Historical Period | 2020-2025 |
| Growth Rate | CAGR of 11.92% from 2020-2034 |
| Segmentation |
|
Table of Contents
- 1. Introduction
- 1.1. Research Scope
- 1.2. Market Segmentation
- 1.3. Research Methodology
- 1.4. Definitions and Assumptions
- 2. Executive Summary
- 2.1. Introduction
- 3. Market Dynamics
- 3.1. Introduction
- 3.2. Market Drivers
- 3.2.1. Rising Demand for Energy-efficient Devices; Demand for Passive Infrared Due to Low Cost and High Energy Efficiency
- 3.3. Market Restrains
- 3.3.1. False Triggering of Switch and Inconsistency Issues Associated with Wireless Network Systems
- 3.4. Market Trends
- 3.4.1. Smart City to Increase the Growth of the Occupancy Sensor Market
- 4. Market Factor Analysis
- 4.1. Porters Five Forces
- 4.2. Supply/Value Chain
- 4.3. PESTEL analysis
- 4.4. Market Entropy
- 4.5. Patent/Trademark Analysis
- 5. Global Occupancy Sensor Industry Analysis, Insights and Forecast, 2020-2032
- 5.1. Market Analysis, Insights and Forecast - by Network Type
- 5.1.1. Wired
- 5.1.2. Wireless
- 5.2. Market Analysis, Insights and Forecast - by Technology
- 5.2.1. Ultrasonic
- 5.2.2. Passive Infrared
- 5.2.3. Microwave
- 5.3. Market Analysis, Insights and Forecast - by Building Type
- 5.3.1. Residential
- 5.3.2. Commercial
- 5.4. Market Analysis, Insights and Forecast - by Application
- 5.4.1. Lighting Control
- 5.4.2. HVAC
- 5.4.3. Security and Surveillance
- 5.4.4. Other Applications
- 5.5. Market Analysis, Insights and Forecast - by Region
- 5.5.1. North America
- 5.5.2. Europe
- 5.5.3. Asia Pacific
- 5.5.4. Latin America
- 5.5.5. Middle East and Africa
- 5.1. Market Analysis, Insights and Forecast - by Network Type
- 6. North America Occupancy Sensor Industry Analysis, Insights and Forecast, 2020-2032
- 6.1. Market Analysis, Insights and Forecast - by Network Type
- 6.1.1. Wired
- 6.1.2. Wireless
- 6.2. Market Analysis, Insights and Forecast - by Technology
- 6.2.1. Ultrasonic
- 6.2.2. Passive Infrared
- 6.2.3. Microwave
- 6.3. Market Analysis, Insights and Forecast - by Building Type
- 6.3.1. Residential
- 6.3.2. Commercial
- 6.4. Market Analysis, Insights and Forecast - by Application
- 6.4.1. Lighting Control
- 6.4.2. HVAC
- 6.4.3. Security and Surveillance
- 6.4.4. Other Applications
- 6.1. Market Analysis, Insights and Forecast - by Network Type
- 7. Europe Occupancy Sensor Industry Analysis, Insights and Forecast, 2020-2032
- 7.1. Market Analysis, Insights and Forecast - by Network Type
- 7.1.1. Wired
- 7.1.2. Wireless
- 7.2. Market Analysis, Insights and Forecast - by Technology
- 7.2.1. Ultrasonic
- 7.2.2. Passive Infrared
- 7.2.3. Microwave
- 7.3. Market Analysis, Insights and Forecast - by Building Type
- 7.3.1. Residential
- 7.3.2. Commercial
- 7.4. Market Analysis, Insights and Forecast - by Application
- 7.4.1. Lighting Control
- 7.4.2. HVAC
- 7.4.3. Security and Surveillance
- 7.4.4. Other Applications
- 7.1. Market Analysis, Insights and Forecast - by Network Type
- 8. Asia Pacific Occupancy Sensor Industry Analysis, Insights and Forecast, 2020-2032
- 8.1. Market Analysis, Insights and Forecast - by Network Type
- 8.1.1. Wired
- 8.1.2. Wireless
- 8.2. Market Analysis, Insights and Forecast - by Technology
- 8.2.1. Ultrasonic
- 8.2.2. Passive Infrared
- 8.2.3. Microwave
- 8.3. Market Analysis, Insights and Forecast - by Building Type
- 8.3.1. Residential
- 8.3.2. Commercial
- 8.4. Market Analysis, Insights and Forecast - by Application
- 8.4.1. Lighting Control
- 8.4.2. HVAC
- 8.4.3. Security and Surveillance
- 8.4.4. Other Applications
- 8.1. Market Analysis, Insights and Forecast - by Network Type
- 9. Latin America Occupancy Sensor Industry Analysis, Insights and Forecast, 2020-2032
- 9.1. Market Analysis, Insights and Forecast - by Network Type
- 9.1.1. Wired
- 9.1.2. Wireless
- 9.2. Market Analysis, Insights and Forecast - by Technology
- 9.2.1. Ultrasonic
- 9.2.2. Passive Infrared
- 9.2.3. Microwave
- 9.3. Market Analysis, Insights and Forecast - by Building Type
- 9.3.1. Residential
- 9.3.2. Commercial
- 9.4. Market Analysis, Insights and Forecast - by Application
- 9.4.1. Lighting Control
- 9.4.2. HVAC
- 9.4.3. Security and Surveillance
- 9.4.4. Other Applications
- 9.1. Market Analysis, Insights and Forecast - by Network Type
- 10. Middle East and Africa Occupancy Sensor Industry Analysis, Insights and Forecast, 2020-2032
- 10.1. Market Analysis, Insights and Forecast - by Network Type
- 10.1.1. Wired
- 10.1.2. Wireless
- 10.2. Market Analysis, Insights and Forecast - by Technology
- 10.2.1. Ultrasonic
- 10.2.2. Passive Infrared
- 10.2.3. Microwave
- 10.3. Market Analysis, Insights and Forecast - by Building Type
- 10.3.1. Residential
- 10.3.2. Commercial
- 10.4. Market Analysis, Insights and Forecast - by Application
- 10.4.1. Lighting Control
- 10.4.2. HVAC
- 10.4.3. Security and Surveillance
- 10.4.4. Other Applications
- 10.1. Market Analysis, Insights and Forecast - by Network Type
- 11. Competitive Analysis
- 11.1. Global Market Share Analysis 2025
- 11.2. Company Profiles
- 11.2.1 General Electric
- 11.2.1.1. Overview
- 11.2.1.2. Products
- 11.2.1.3. SWOT Analysis
- 11.2.1.4. Recent Developments
- 11.2.1.5. Financials (Based on Availability)
- 11.2.2 Legrand Inc
- 11.2.2.1. Overview
- 11.2.2.2. Products
- 11.2.2.3. SWOT Analysis
- 11.2.2.4. Recent Developments
- 11.2.2.5. Financials (Based on Availability)
- 11.2.3 ohnson Controls GmbH
- 11.2.3.1. Overview
- 11.2.3.2. Products
- 11.2.3.3. SWOT Analysis
- 11.2.3.4. Recent Developments
- 11.2.3.5. Financials (Based on Availability)
- 11.2.4 Hubbell Building Automation Inc
- 11.2.4.1. Overview
- 11.2.4.2. Products
- 11.2.4.3. SWOT Analysis
- 11.2.4.4. Recent Developments
- 11.2.4.5. Financials (Based on Availability)
- 11.2.5 Leviton Electronics (Dongguan) Co Ltd
- 11.2.5.1. Overview
- 11.2.5.2. Products
- 11.2.5.3. SWOT Analysis
- 11.2.5.4. Recent Developments
- 11.2.5.5. Financials (Based on Availability)
- 11.2.6 Honeywell International
- 11.2.6.1. Overview
- 11.2.6.2. Products
- 11.2.6.3. SWOT Analysis
- 11.2.6.4. Recent Developments
- 11.2.6.5. Financials (Based on Availability)
- 11.2.7 Schneider Electric
- 11.2.7.1. Overview
- 11.2.7.2. Products
- 11.2.7.3. SWOT Analysis
- 11.2.7.4. Recent Developments
- 11.2.7.5. Financials (Based on Availability)
- 11.2.8 Texas Instruments Incorporated*List Not Exhaustive
- 11.2.8.1. Overview
- 11.2.8.2. Products
- 11.2.8.3. SWOT Analysis
- 11.2.8.4. Recent Developments
- 11.2.8.5. Financials (Based on Availability)
- 11.2.9 Pammvi Group
- 11.2.9.1. Overview
- 11.2.9.2. Products
- 11.2.9.3. SWOT Analysis
- 11.2.9.4. Recent Developments
- 11.2.9.5. Financials (Based on Availability)
- 11.2.10 Philips Ltd
- 11.2.10.1. Overview
- 11.2.10.2. Products
- 11.2.10.3. SWOT Analysis
- 11.2.10.4. Recent Developments
- 11.2.10.5. Financials (Based on Availability)
- 11.2.11 Lutron Electronics Inc
- 11.2.11.1. Overview
- 11.2.11.2. Products
- 11.2.11.3. SWOT Analysis
- 11.2.11.4. Recent Developments
- 11.2.11.5. Financials (Based on Availability)
- 11.2.12 Eaton Corporation
- 11.2.12.1. Overview
- 11.2.12.2. Products
- 11.2.12.3. SWOT Analysis
- 11.2.12.4. Recent Developments
- 11.2.12.5. Financials (Based on Availability)
- 11.2.1 General Electric
List of Figures
- Figure 1: Global Occupancy Sensor Industry Revenue Breakdown (billion, %) by Region 2025 & 2033
- Figure 2: North America Occupancy Sensor Industry Revenue (billion), by Network Type 2025 & 2033
- Figure 3: North America Occupancy Sensor Industry Revenue Share (%), by Network Type 2025 & 2033
- Figure 4: North America Occupancy Sensor Industry Revenue (billion), by Technology 2025 & 2033
- Figure 5: North America Occupancy Sensor Industry Revenue Share (%), by Technology 2025 & 2033
- Figure 6: North America Occupancy Sensor Industry Revenue (billion), by Building Type 2025 & 2033
- Figure 7: North America Occupancy Sensor Industry Revenue Share (%), by Building Type 2025 & 2033
- Figure 8: North America Occupancy Sensor Industry Revenue (billion), by Application 2025 & 2033
- Figure 9: North America Occupancy Sensor Industry Revenue Share (%), by Application 2025 & 2033
- Figure 10: North America Occupancy Sensor Industry Revenue (billion), by Country 2025 & 2033
- Figure 11: North America Occupancy Sensor Industry Revenue Share (%), by Country 2025 & 2033
- Figure 12: Europe Occupancy Sensor Industry Revenue (billion), by Network Type 2025 & 2033
- Figure 13: Europe Occupancy Sensor Industry Revenue Share (%), by Network Type 2025 & 2033
- Figure 14: Europe Occupancy Sensor Industry Revenue (billion), by Technology 2025 & 2033
- Figure 15: Europe Occupancy Sensor Industry Revenue Share (%), by Technology 2025 & 2033
- Figure 16: Europe Occupancy Sensor Industry Revenue (billion), by Building Type 2025 & 2033
- Figure 17: Europe Occupancy Sensor Industry Revenue Share (%), by Building Type 2025 & 2033
- Figure 18: Europe Occupancy Sensor Industry Revenue (billion), by Application 2025 & 2033
- Figure 19: Europe Occupancy Sensor Industry Revenue Share (%), by Application 2025 & 2033
- Figure 20: Europe Occupancy Sensor Industry Revenue (billion), by Country 2025 & 2033
- Figure 21: Europe Occupancy Sensor Industry Revenue Share (%), by Country 2025 & 2033
- Figure 22: Asia Pacific Occupancy Sensor Industry Revenue (billion), by Network Type 2025 & 2033
- Figure 23: Asia Pacific Occupancy Sensor Industry Revenue Share (%), by Network Type 2025 & 2033
- Figure 24: Asia Pacific Occupancy Sensor Industry Revenue (billion), by Technology 2025 & 2033
- Figure 25: Asia Pacific Occupancy Sensor Industry Revenue Share (%), by Technology 2025 & 2033
- Figure 26: Asia Pacific Occupancy Sensor Industry Revenue (billion), by Building Type 2025 & 2033
- Figure 27: Asia Pacific Occupancy Sensor Industry Revenue Share (%), by Building Type 2025 & 2033
- Figure 28: Asia Pacific Occupancy Sensor Industry Revenue (billion), by Application 2025 & 2033
- Figure 29: Asia Pacific Occupancy Sensor Industry Revenue Share (%), by Application 2025 & 2033
- Figure 30: Asia Pacific Occupancy Sensor Industry Revenue (billion), by Country 2025 & 2033
- Figure 31: Asia Pacific Occupancy Sensor Industry Revenue Share (%), by Country 2025 & 2033
- Figure 32: Latin America Occupancy Sensor Industry Revenue (billion), by Network Type 2025 & 2033
- Figure 33: Latin America Occupancy Sensor Industry Revenue Share (%), by Network Type 2025 & 2033
- Figure 34: Latin America Occupancy Sensor Industry Revenue (billion), by Technology 2025 & 2033
- Figure 35: Latin America Occupancy Sensor Industry Revenue Share (%), by Technology 2025 & 2033
- Figure 36: Latin America Occupancy Sensor Industry Revenue (billion), by Building Type 2025 & 2033
- Figure 37: Latin America Occupancy Sensor Industry Revenue Share (%), by Building Type 2025 & 2033
- Figure 38: Latin America Occupancy Sensor Industry Revenue (billion), by Application 2025 & 2033
- Figure 39: Latin America Occupancy Sensor Industry Revenue Share (%), by Application 2025 & 2033
- Figure 40: Latin America Occupancy Sensor Industry Revenue (billion), by Country 2025 & 2033
- Figure 41: Latin America Occupancy Sensor Industry Revenue Share (%), by Country 2025 & 2033
- Figure 42: Middle East and Africa Occupancy Sensor Industry Revenue (billion), by Network Type 2025 & 2033
- Figure 43: Middle East and Africa Occupancy Sensor Industry Revenue Share (%), by Network Type 2025 & 2033
- Figure 44: Middle East and Africa Occupancy Sensor Industry Revenue (billion), by Technology 2025 & 2033
- Figure 45: Middle East and Africa Occupancy Sensor Industry Revenue Share (%), by Technology 2025 & 2033
- Figure 46: Middle East and Africa Occupancy Sensor Industry Revenue (billion), by Building Type 2025 & 2033
- Figure 47: Middle East and Africa Occupancy Sensor Industry Revenue Share (%), by Building Type 2025 & 2033
- Figure 48: Middle East and Africa Occupancy Sensor Industry Revenue (billion), by Application 2025 & 2033
- Figure 49: Middle East and Africa Occupancy Sensor Industry Revenue Share (%), by Application 2025 & 2033
- Figure 50: Middle East and Africa Occupancy Sensor Industry Revenue (billion), by Country 2025 & 2033
- Figure 51: Middle East and Africa Occupancy Sensor Industry Revenue Share (%), by Country 2025 & 2033
List of Tables
- Table 1: Global Occupancy Sensor Industry Revenue billion Forecast, by Network Type 2020 & 2033
- Table 2: Global Occupancy Sensor Industry Revenue billion Forecast, by Technology 2020 & 2033
- Table 3: Global Occupancy Sensor Industry Revenue billion Forecast, by Building Type 2020 & 2033
- Table 4: Global Occupancy Sensor Industry Revenue billion Forecast, by Application 2020 & 2033
- Table 5: Global Occupancy Sensor Industry Revenue billion Forecast, by Region 2020 & 2033
- Table 6: Global Occupancy Sensor Industry Revenue billion Forecast, by Network Type 2020 & 2033
- Table 7: Global Occupancy Sensor Industry Revenue billion Forecast, by Technology 2020 & 2033
- Table 8: Global Occupancy Sensor Industry Revenue billion Forecast, by Building Type 2020 & 2033
- Table 9: Global Occupancy Sensor Industry Revenue billion Forecast, by Application 2020 & 2033
- Table 10: Global Occupancy Sensor Industry Revenue billion Forecast, by Country 2020 & 2033
- Table 11: United States Occupancy Sensor Industry Revenue (billion) Forecast, by Application 2020 & 2033
- Table 12: Canada Occupancy Sensor Industry Revenue (billion) Forecast, by Application 2020 & 2033
- Table 13: Global Occupancy Sensor Industry Revenue billion Forecast, by Network Type 2020 & 2033
- Table 14: Global Occupancy Sensor Industry Revenue billion Forecast, by Technology 2020 & 2033
- Table 15: Global Occupancy Sensor Industry Revenue billion Forecast, by Building Type 2020 & 2033
- Table 16: Global Occupancy Sensor Industry Revenue billion Forecast, by Application 2020 & 2033
- Table 17: Global Occupancy Sensor Industry Revenue billion Forecast, by Country 2020 & 2033
- Table 18: United Kingdom Occupancy Sensor Industry Revenue (billion) Forecast, by Application 2020 & 2033
- Table 19: France Occupancy Sensor Industry Revenue (billion) Forecast, by Application 2020 & 2033
- Table 20: Germany Occupancy Sensor Industry Revenue (billion) Forecast, by Application 2020 & 2033
- Table 21: Italy Occupancy Sensor Industry Revenue (billion) Forecast, by Application 2020 & 2033
- Table 22: Rest of Europe Occupancy Sensor Industry Revenue (billion) Forecast, by Application 2020 & 2033
- Table 23: Global Occupancy Sensor Industry Revenue billion Forecast, by Network Type 2020 & 2033
- Table 24: Global Occupancy Sensor Industry Revenue billion Forecast, by Technology 2020 & 2033
- Table 25: Global Occupancy Sensor Industry Revenue billion Forecast, by Building Type 2020 & 2033
- Table 26: Global Occupancy Sensor Industry Revenue billion Forecast, by Application 2020 & 2033
- Table 27: Global Occupancy Sensor Industry Revenue billion Forecast, by Country 2020 & 2033
- Table 28: China Occupancy Sensor Industry Revenue (billion) Forecast, by Application 2020 & 2033
- Table 29: Japan Occupancy Sensor Industry Revenue (billion) Forecast, by Application 2020 & 2033
- Table 30: South Korea Occupancy Sensor Industry Revenue (billion) Forecast, by Application 2020 & 2033
- Table 31: Australia Occupancy Sensor Industry Revenue (billion) Forecast, by Application 2020 & 2033
- Table 32: Rest of Asia Pacific Occupancy Sensor Industry Revenue (billion) Forecast, by Application 2020 & 2033
- Table 33: Global Occupancy Sensor Industry Revenue billion Forecast, by Network Type 2020 & 2033
- Table 34: Global Occupancy Sensor Industry Revenue billion Forecast, by Technology 2020 & 2033
- Table 35: Global Occupancy Sensor Industry Revenue billion Forecast, by Building Type 2020 & 2033
- Table 36: Global Occupancy Sensor Industry Revenue billion Forecast, by Application 2020 & 2033
- Table 37: Global Occupancy Sensor Industry Revenue billion Forecast, by Country 2020 & 2033
- Table 38: Mexico Occupancy Sensor Industry Revenue (billion) Forecast, by Application 2020 & 2033
- Table 39: Rest of Latin America Occupancy Sensor Industry Revenue (billion) Forecast, by Application 2020 & 2033
- Table 40: Global Occupancy Sensor Industry Revenue billion Forecast, by Network Type 2020 & 2033
- Table 41: Global Occupancy Sensor Industry Revenue billion Forecast, by Technology 2020 & 2033
- Table 42: Global Occupancy Sensor Industry Revenue billion Forecast, by Building Type 2020 & 2033
- Table 43: Global Occupancy Sensor Industry Revenue billion Forecast, by Application 2020 & 2033
- Table 44: Global Occupancy Sensor Industry Revenue billion Forecast, by Country 2020 & 2033
Frequently Asked Questions
1. What is the projected Compound Annual Growth Rate (CAGR) of the Occupancy Sensor Industry?
The projected CAGR is approximately 11.92%.
2. Which companies are prominent players in the Occupancy Sensor Industry?
Key companies in the market include General Electric, Legrand Inc, ohnson Controls GmbH, Hubbell Building Automation Inc, Leviton Electronics (Dongguan) Co Ltd, Honeywell International, Schneider Electric, Texas Instruments Incorporated*List Not Exhaustive, Pammvi Group, Philips Ltd, Lutron Electronics Inc, Eaton Corporation.
3. What are the main segments of the Occupancy Sensor Industry?
The market segments include Network Type, Technology, Building Type, Application.
4. Can you provide details about the market size?
The market size is estimated to be USD 3.07 billion as of 2022.
5. What are some drivers contributing to market growth?
Rising Demand for Energy-efficient Devices; Demand for Passive Infrared Due to Low Cost and High Energy Efficiency.
6. What are the notable trends driving market growth?
Smart City to Increase the Growth of the Occupancy Sensor Market.
7. Are there any restraints impacting market growth?
False Triggering of Switch and Inconsistency Issues Associated with Wireless Network Systems.
8. Can you provide examples of recent developments in the market?
June 2022 - Butlr launched as an occupancy-sensing platform that captures the presence and movement of individuals within a space in real-time, stating that the data gathered by the platform can be utilized to revolutionize the workplace. Butlr's platform's spatial insights, occupancy, and activity analytics may be utilized to make data-driven real estate and design decisions, as well as to improve the tenant experience.
9. What pricing options are available for accessing the report?
Pricing options include single-user, multi-user, and enterprise licenses priced at USD 4750, USD 5250, and USD 8750 respectively.
10. Is the market size provided in terms of value or volume?
The market size is provided in terms of value, measured in billion.
11. Are there any specific market keywords associated with the report?
Yes, the market keyword associated with the report is "Occupancy Sensor Industry," which aids in identifying and referencing the specific market segment covered.
12. How do I determine which pricing option suits my needs best?
The pricing options vary based on user requirements and access needs. Individual users may opt for single-user licenses, while businesses requiring broader access may choose multi-user or enterprise licenses for cost-effective access to the report.
13. Are there any additional resources or data provided in the Occupancy Sensor Industry report?
While the report offers comprehensive insights, it's advisable to review the specific contents or supplementary materials provided to ascertain if additional resources or data are available.
14. How can I stay updated on further developments or reports in the Occupancy Sensor Industry?
To stay informed about further developments, trends, and reports in the Occupancy Sensor Industry, consider subscribing to industry newsletters, following relevant companies and organizations, or regularly checking reputable industry news sources and publications.
Methodology
Step 1 - Identification of Relevant Samples Size from Population Database


Step 2 - Approaches for Defining Global Market Size (Value, Volume* & Price*)

Note*: In applicable scenarios
Step 3 - Data Sources
Primary Research
- Web Analytics
- Survey Reports
- Research Institute
- Latest Research Reports
- Opinion Leaders
Secondary Research
- Annual Reports
- White Paper
- Latest Press Release
- Industry Association
- Paid Database
- Investor Presentations

Step 4 - Data Triangulation
Involves using different sources of information in order to increase the validity of a study
These sources are likely to be stakeholders in a program - participants, other researchers, program staff, other community members, and so on.
Then we put all data in single framework & apply various statistical tools to find out the dynamic on the market.
During the analysis stage, feedback from the stakeholder groups would be compared to determine areas of agreement as well as areas of divergence