

Key Insights
The global OLED DDIC foundry market is poised for significant expansion, projected to reach $5 billion in 2025 and grow at a robust compound annual growth rate (CAGR) of 15% through 2033. This impressive growth is fueled by the increasing demand for high-performance displays in consumer electronics. Smartphones, in particular, are the dominant application segment, driving the need for advanced OLED Display Driver Integrated Circuits (DDICs) that enable vibrant colors, deep blacks, and faster refresh rates. The proliferation of smart wearables, such as smartwatches and fitness trackers, further contributes to this surge, as these devices increasingly adopt OLED technology for their power efficiency and visual appeal. Beyond these core applications, emerging uses in automotive displays and other specialized electronic devices are also beginning to shape the market landscape.
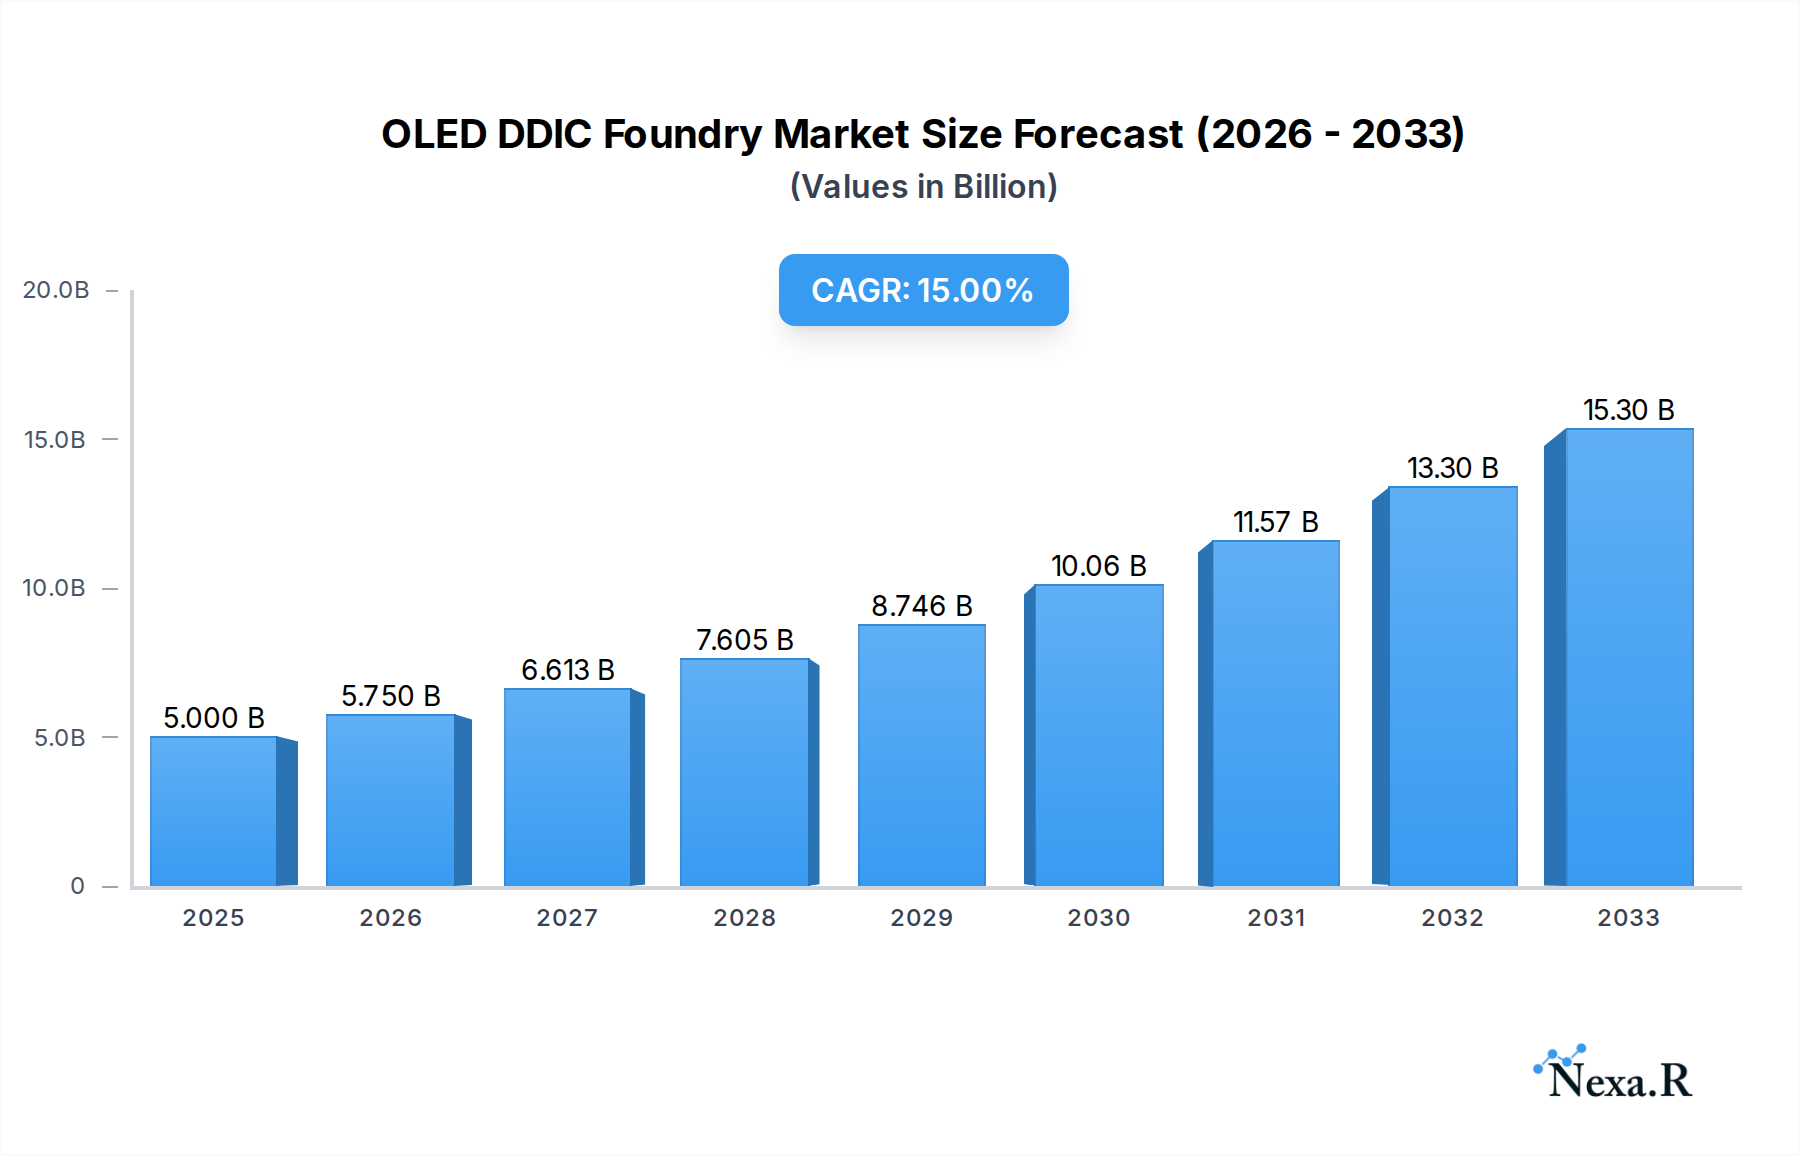
OLED DDIC Foundry Market Size (In Billion)
The foundry sector for OLED DDICs is characterized by intense competition and rapid technological advancement, particularly in process nodes. While older nodes like 28 nm and 40 nm continue to hold a share, there is a discernible trend towards more advanced nodes that offer improved power efficiency and performance. Key players such as TSMC, Samsung Foundry, and SMIC are at the forefront, investing heavily in research and development to meet the evolving needs of display manufacturers. Geographically, Asia Pacific, led by China, South Korea, and Taiwan, dominates the market due to the concentration of display panel production and semiconductor manufacturing capabilities. However, North America and Europe are also significant markets, driven by strong consumer demand for premium electronic devices and growing investments in advanced display technologies.

OLED DDIC Foundry Company Market Share
OLED DDIC Foundry Market Dynamics & Structure
The OLED DDIC (Display Driver Integrated Circuit) foundry market is characterized by a high degree of technological sophistication and intense competition. Dominated by a few key players, the market concentration remains significant, driven by substantial R&D investments and stringent intellectual property protection. Technological innovation is the primary engine, with advancements in process nodes, power efficiency, and display resolution constantly pushing the boundaries of what's possible. Regulatory frameworks, particularly concerning environmental standards and export controls, play a crucial role in shaping manufacturing practices and market access. Competitive product substitutes, though less prevalent for high-end OLED displays, are emerging in the form of advanced LCD technologies, creating pressure on pricing and performance. End-user demographics, especially the demand for premium mobile devices and immersive entertainment experiences, directly influence the trajectory of OLED adoption and, consequently, DDIC foundry requirements. Mergers and acquisitions (M&A) trends are less frequent due to the capital-intensive nature and specialized expertise required, but strategic alliances and partnerships are common to share risk and leverage complementary technologies.
- Market Concentration: Led by dominant foundries with advanced manufacturing capabilities.
- Technological Innovation: Focus on sub-28nm nodes, improved power management, and higher refresh rates.
- Regulatory Frameworks: Stringent environmental and safety compliance for semiconductor manufacturing.
- Competitive Product Substitutes: Advanced LCD technologies in lower-tier segments.
- End-User Demographics: High demand from premium smartphone, tablet, and wearable markets.
- M&A Trends: Limited, with emphasis on strategic collaborations for technology access.
OLED DDIC Foundry Growth Trends & Insights
The OLED DDIC foundry market is poised for robust expansion, projected to witness a compound annual growth rate (CAGR) of xx% from 2025 to 2033. The market size, valued at an estimated $xx billion in 2025, is anticipated to reach approximately $xx billion by the end of the forecast period. This significant growth is underpinned by the accelerating adoption of OLED technology across a widening spectrum of consumer electronics. Driven by evolving consumer preferences for superior visual experiences, including vibrant colors, deeper blacks, and faster response times, the demand for OLED displays in smartphones continues to surge. This trend is further amplified by the increasing penetration of OLED panels in smart wearables, where compact form factors and energy efficiency are paramount. The "Other" application segment, encompassing automotive displays, IT devices, and emerging flexible/foldable screens, is also expected to contribute substantially to market growth, offering significant untapped potential.
Technological disruptions are continuously reshaping the industry. The relentless pursuit of smaller process nodes, such as those below 28 nm, is enabling foundries to produce DDICs with enhanced performance, reduced power consumption, and lower costs. This technological advancement is a critical enabler for thinner, more power-efficient, and visually superior OLED displays across all form factors. Consumer behavior shifts are directly influencing market dynamics. The growing demand for immersive content consumption, from high-definition video streaming to mobile gaming, necessitates displays that can deliver unparalleled visual fidelity, a niche where OLED excels. Furthermore, the increasing sophistication of smart devices, with their demand for advanced functionalities and seamless user interfaces, directly translates into a higher requirement for complex and performant DDICs. The market penetration of OLED technology is expected to climb steadily, driven by both premium device upgrades and the gradual introduction of OLED in more mainstream product categories. The historical period of 2019-2024 has laid a strong foundation, with steady growth fueled by early adoption in flagship smartphones. The base year of 2025 marks a crucial inflection point, with sustained acceleration anticipated throughout the forecast period.
Dominant Regions, Countries, or Segments in OLED DDIC Foundry
The Application Segment of Smartphones is the undisputed dominant force driving growth in the OLED DDIC foundry market. With an estimated market share of xx% in 2025, this segment is projected to continue its leadership throughout the forecast period. The insatiable demand for premium smartphones, characterized by their large, high-resolution, and energy-efficient OLED displays, directly fuels the need for advanced OLED DDICs. The global proliferation of smartphone adoption, coupled with the premiumization trend in mobile device purchasing, ensures a consistent and expanding market for these components. Key drivers for this dominance include:
- Economic Policies: Favorable trade policies and government incentives in key manufacturing hubs encourage investment in semiconductor fabrication facilities necessary for OLED DDIC production.
- Infrastructure: Well-developed industrial infrastructure, including reliable power grids, transportation networks, and a skilled workforce, in regions like East Asia, is crucial for supporting the complex manufacturing processes involved.
- Consumer Demand: The ever-increasing consumer appetite for advanced features in smartphones, such as foldable displays, higher refresh rates, and improved camera integration, necessitates cutting-edge OLED display technology, directly impacting DDIC demand.
- Technological Advancements: Continuous innovation in smartphone form factors and display technologies, such as under-display cameras and bezel-less designs, requires increasingly sophisticated and miniaturized DDICs.
While Smartphones lead, the Smart Wearables segment is a significant and rapidly growing contributor. The miniaturization and power efficiency requirements of smartwatches and fitness trackers make OLED technology an ideal fit, driving the demand for specialized OLED DDICs. The Other application segment, encompassing automotive displays, IT devices (laptops, tablets), and emerging applications like augmented reality (AR) and virtual reality (VR) devices, represents a substantial growth opportunity. As these sectors increasingly embrace OLED technology, their contribution to the overall OLED DDIC foundry market will escalate.
In terms of Types, the 28 nm process node is currently a key driver of advanced OLED DDIC production, enabling higher performance and power efficiency. However, the foundry landscape is rapidly evolving towards even smaller nodes, including 40 nm and below, as well as proprietary architectures designed for specific OLED panel technologies. The continuous push for innovation in Other types of DDICs, catering to unique display characteristics and form factors, will also play a vital role in shaping the market's future.
OLED DDIC Foundry Product Landscape
The OLED DDIC foundry market is characterized by a landscape of highly specialized and performance-driven products. Foundries are continuously innovating to deliver integrated circuits that enable thinner, brighter, and more power-efficient OLED displays. Key product innovations include the development of DDICs with advanced pixel driving capabilities for higher refresh rates and improved color accuracy, crucial for gaming and professional content creation. Furthermore, there's a strong focus on reducing power consumption through intelligent power management features, extending battery life in mobile devices. Unique selling propositions often revolve around the foundry's ability to achieve finer process nodes (e.g., sub-28nm), offering higher integration levels, and providing tailored solutions for specific OLED panel architectures, such as WOLED and QD-OLED. These technological advancements are critical for meeting the evolving demands of smartphones, smart wearables, and increasingly, automotive and IT applications.
Key Drivers, Barriers & Challenges in OLED DDIC Foundry
Key Drivers: The OLED DDIC foundry market is propelled by several potent drivers. The relentless consumer demand for superior visual experiences in smartphones, tablets, and wearables is paramount. Technological advancements in OLED panel technology, demanding more sophisticated and integrated DDICs, serve as a significant catalyst. The increasing adoption of OLED in emerging applications like automotive displays and AR/VR devices opens new avenues for growth. Furthermore, government initiatives promoting semiconductor manufacturing and innovation in key regions contribute to the market's expansion.
Barriers & Challenges: Despite robust growth, the market faces considerable barriers and challenges. The extremely high capital expenditure required for establishing and maintaining advanced semiconductor fabrication facilities presents a significant entry barrier. Intense competition among leading foundries, particularly from Asian players, puts pressure on pricing and profit margins. Supply chain disruptions, as evidenced by recent global events, can impact material availability and lead times, posing a substantial risk. The complexity of manufacturing at advanced process nodes (below 28nm) leads to potential yield issues and higher defect rates, requiring continuous process optimization. Navigating evolving intellectual property landscapes and ensuring compliance with stringent environmental regulations also add to the operational complexities.
Emerging Opportunities in OLED DDIC Foundry
Emerging opportunities in the OLED DDIC foundry market lie in catering to the burgeoning demand for foldable and flexible displays. The development of specialized DDICs that can withstand repeated bending and folding, while maintaining performance and reliability, presents a significant untapped market. Another key area is the automotive sector, where the integration of large, high-resolution OLED displays for infotainment, instrument clusters, and heads-up displays is gaining momentum, requiring robust and automotive-grade DDIC solutions. The growing adoption of OLED in IT devices, such as laptops and monitors, also signifies a substantial opportunity for foundries to expand their market reach beyond mobile applications. Furthermore, the development of energy-efficient DDICs for next-generation AR/VR devices, where power consumption is a critical factor, offers a promising avenue for innovation and market penetration.
Growth Accelerators in the OLED DDIC Foundry Industry
The OLED DDIC foundry industry's long-term growth is significantly accelerated by ongoing technological breakthroughs, particularly in advanced lithography and materials science, enabling the production of DDICs at ever-smaller process nodes. Strategic partnerships and collaborations between foundries, display panel manufacturers, and fabless semiconductor companies are crucial for co-developing next-generation technologies and sharing R&D costs. Market expansion strategies, focusing on penetrating new geographic regions and diversifying into nascent application segments like automotive and XR (Extended Reality), are also key growth accelerators. The continuous improvement in manufacturing yields and cost efficiencies achieved through process optimization and automation further bolsters the industry's growth trajectory.
Key Players Shaping the OLED DDIC Foundry Market
- Samsung Foundry
- GlobalFoundries
- UMC
- TSMC
- SMIC
- Nexchip
- PowerChip
- DB HiTek
Notable Milestones in OLED DDIC Foundry Sector
- 2019: Increased focus on sub-28nm process nodes for next-generation OLED displays.
- 2020: Introduction of advanced power management ICs for improved battery efficiency in mobile devices.
- 2021: Growing adoption of OLED DDICs in smart wearables beyond smartwatches.
- 2022: Significant R&D investment in solutions for foldable and flexible OLED display integration.
- 2023: Emergence of specialized DDICs for automotive OLED applications, meeting stringent reliability standards.
- 2024: Continued advancements in integration of AI and machine learning for display optimization within DDICs.
In-Depth OLED DDIC Foundry Market Outlook
The OLED DDIC foundry market outlook remains exceptionally bright, driven by a confluence of accelerating growth factors. The increasing demand for immersive visual experiences across a widening array of consumer electronics, from flagship smartphones to next-generation automotive displays, will continue to fuel demand. Technological breakthroughs in enabling smaller and more efficient DDICs, coupled with strategic collaborations among industry players, will unlock new possibilities for display innovation. The continued expansion of OLED technology into emerging applications, such as foldable devices and AR/VR headsets, presents substantial market potential. Foundries that can effectively navigate the complexities of advanced manufacturing, supply chain resilience, and evolving consumer preferences are poised to capture significant market share and drive the future of high-performance display integration.
OLED DDIC Foundry Segmentation
-
1. Application
- 1.1. Smartphones
- 1.2. Smart Wearables
- 1.3. Other
-
2. Types
- 2.1. 28 nm
- 2.2. 40 nm
- 2.3. Other
OLED DDIC Foundry Segmentation By Geography
-
1. North America
- 1.1. United States
- 1.2. Canada
- 1.3. Mexico
-
2. South America
- 2.1. Brazil
- 2.2. Argentina
- 2.3. Rest of South America
-
3. Europe
- 3.1. United Kingdom
- 3.2. Germany
- 3.3. France
- 3.4. Italy
- 3.5. Spain
- 3.6. Russia
- 3.7. Benelux
- 3.8. Nordics
- 3.9. Rest of Europe
-
4. Middle East & Africa
- 4.1. Turkey
- 4.2. Israel
- 4.3. GCC
- 4.4. North Africa
- 4.5. South Africa
- 4.6. Rest of Middle East & Africa
-
5. Asia Pacific
- 5.1. China
- 5.2. India
- 5.3. Japan
- 5.4. South Korea
- 5.5. ASEAN
- 5.6. Oceania
- 5.7. Rest of Asia Pacific
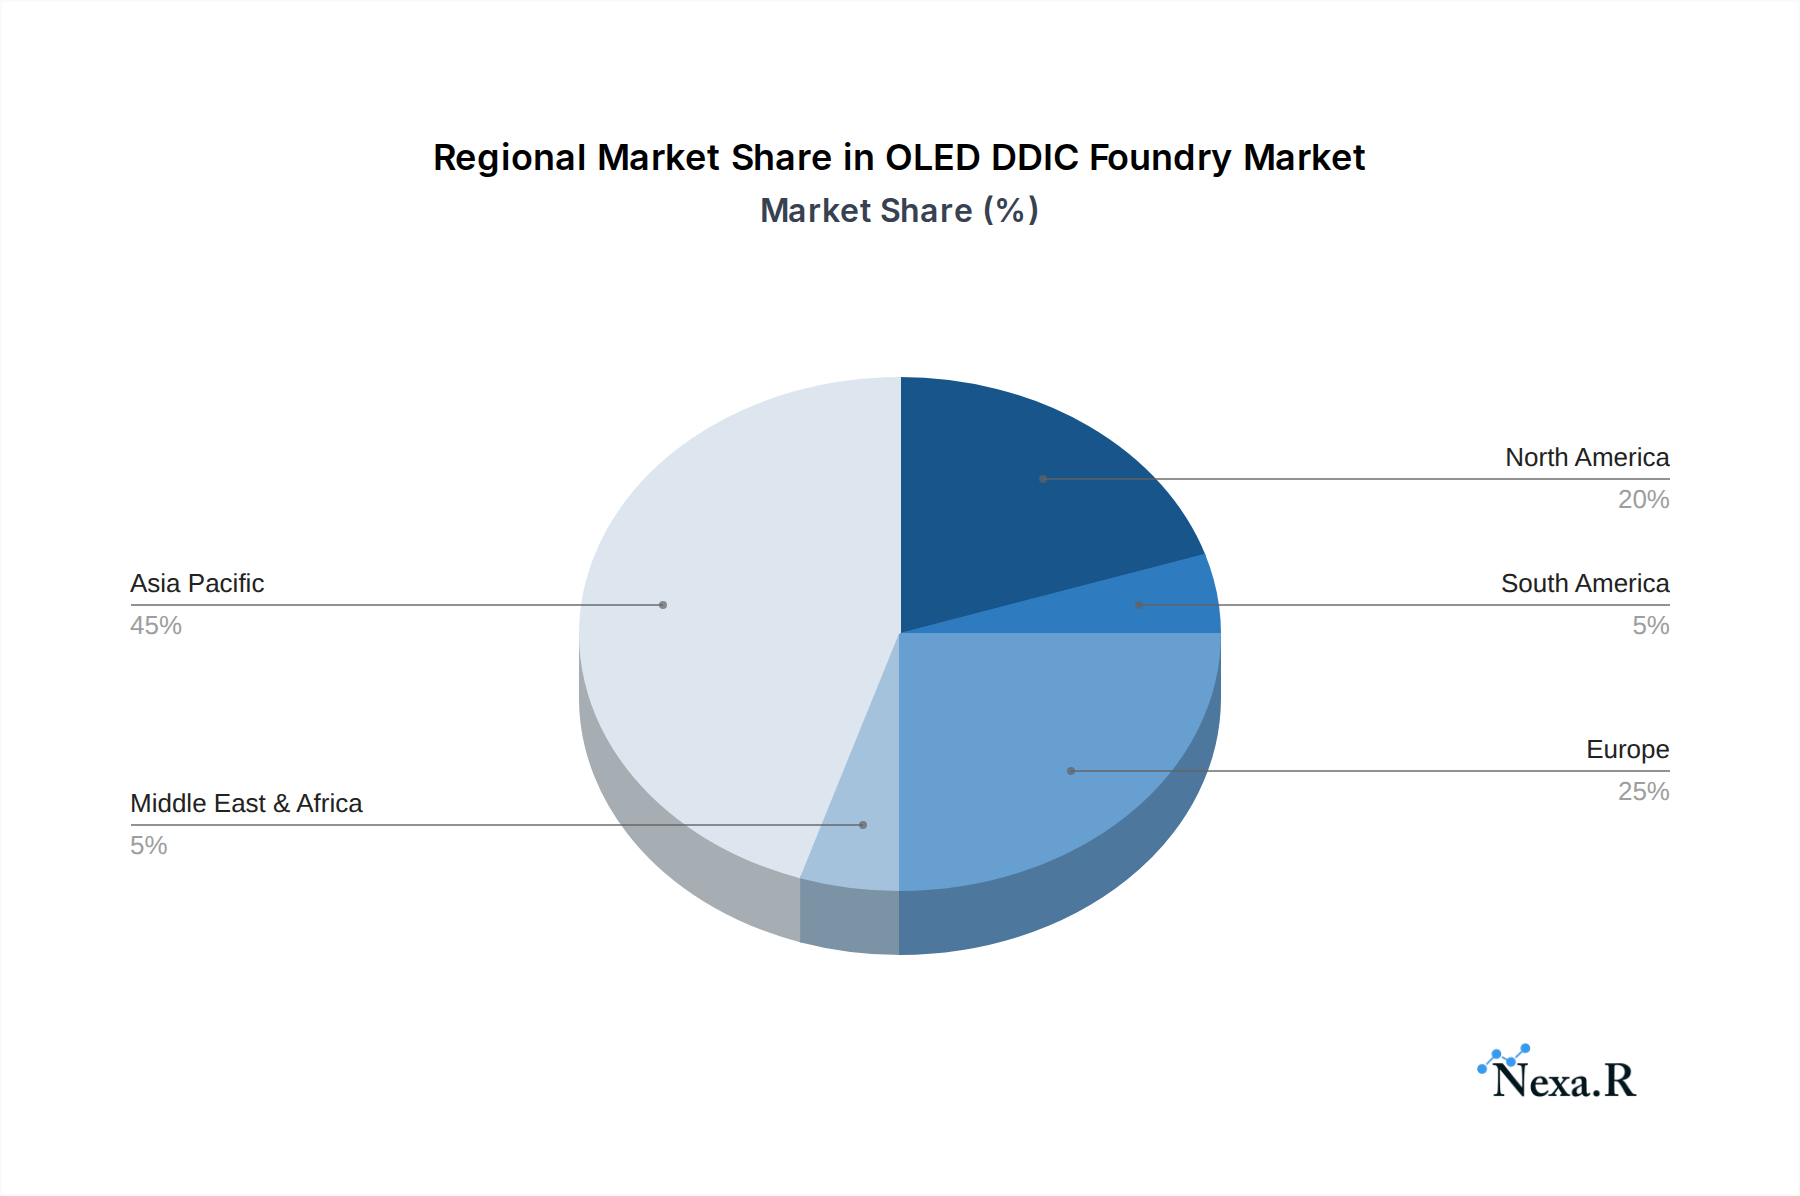
OLED DDIC Foundry Regional Market Share
Geographic Coverage of OLED DDIC Foundry
OLED DDIC Foundry REPORT HIGHLIGHTS
| Aspects | Details |
|---|---|
| Study Period | 2020-2034 |
| Base Year | 2025 |
| Estimated Year | 2026 |
| Forecast Period | 2026-2034 |
| Historical Period | 2020-2025 |
| Growth Rate | CAGR of 15% from 2020-2034 |
| Segmentation |
|
Table of Contents
- 1. Introduction
- 1.1. Research Scope
- 1.2. Market Segmentation
- 1.3. Research Objective
- 1.4. Definitions and Assumptions
- 2. Executive Summary
- 2.1. Market Snapshot
- 3. Market Dynamics
- 3.1. Market Drivers
- 3.2. Market Restrains
- 3.3. Market Trends
- 3.4. Market Opportunities
- 4. Market Factor Analysis
- 4.1. Porters Five Forces
- 4.1.1. Bargaining Power of Suppliers
- 4.1.2. Bargaining Power of Buyers
- 4.1.3. Threat of New Entrants
- 4.1.4. Threat of Substitutes
- 4.1.5. Competitive Rivalry
- 4.2. PESTEL analysis
- 4.3. BCG Analysis
- 4.3.1. Stars (High Growth, High Market Share)
- 4.3.2. Cash Cows (Low Growth, High Market Share)
- 4.3.3. Question Mark (High Growth, Low Market Share)
- 4.3.4. Dogs (Low Growth, Low Market Share)
- 4.4. Ansoff Matrix Analysis
- 4.5. Supply Chain Analysis
- 4.6. Regulatory Landscape
- 4.7. Current Market Potential and Opportunity Assessment (TAM–SAM–SOM Framework)
- 4.8. NRP Analyst Note
- 4.1. Porters Five Forces
- 5. Market Analysis, Insights and Forecast 2021-2033
- 5.1. Market Analysis, Insights and Forecast - by Application
- 5.1.1. Smartphones
- 5.1.2. Smart Wearables
- 5.1.3. Other
- 5.2. Market Analysis, Insights and Forecast - by Types
- 5.2.1. 28 nm
- 5.2.2. 40 nm
- 5.2.3. Other
- 5.3. Market Analysis, Insights and Forecast - by Region
- 5.3.1. North America
- 5.3.2. South America
- 5.3.3. Europe
- 5.3.4. Middle East & Africa
- 5.3.5. Asia Pacific
- 5.1. Market Analysis, Insights and Forecast - by Application
- 6. Global OLED DDIC Foundry Analysis, Insights and Forecast, 2021-2033
- 6.1. Market Analysis, Insights and Forecast - by Application
- 6.1.1. Smartphones
- 6.1.2. Smart Wearables
- 6.1.3. Other
- 6.2. Market Analysis, Insights and Forecast - by Types
- 6.2.1. 28 nm
- 6.2.2. 40 nm
- 6.2.3. Other
- 6.1. Market Analysis, Insights and Forecast - by Application
- 7. North America OLED DDIC Foundry Analysis, Insights and Forecast, 2020-2032
- 7.1. Market Analysis, Insights and Forecast - by Application
- 7.1.1. Smartphones
- 7.1.2. Smart Wearables
- 7.1.3. Other
- 7.2. Market Analysis, Insights and Forecast - by Types
- 7.2.1. 28 nm
- 7.2.2. 40 nm
- 7.2.3. Other
- 7.1. Market Analysis, Insights and Forecast - by Application
- 8. South America OLED DDIC Foundry Analysis, Insights and Forecast, 2020-2032
- 8.1. Market Analysis, Insights and Forecast - by Application
- 8.1.1. Smartphones
- 8.1.2. Smart Wearables
- 8.1.3. Other
- 8.2. Market Analysis, Insights and Forecast - by Types
- 8.2.1. 28 nm
- 8.2.2. 40 nm
- 8.2.3. Other
- 8.1. Market Analysis, Insights and Forecast - by Application
- 9. Europe OLED DDIC Foundry Analysis, Insights and Forecast, 2020-2032
- 9.1. Market Analysis, Insights and Forecast - by Application
- 9.1.1. Smartphones
- 9.1.2. Smart Wearables
- 9.1.3. Other
- 9.2. Market Analysis, Insights and Forecast - by Types
- 9.2.1. 28 nm
- 9.2.2. 40 nm
- 9.2.3. Other
- 9.1. Market Analysis, Insights and Forecast - by Application
- 10. Middle East & Africa OLED DDIC Foundry Analysis, Insights and Forecast, 2020-2032
- 10.1. Market Analysis, Insights and Forecast - by Application
- 10.1.1. Smartphones
- 10.1.2. Smart Wearables
- 10.1.3. Other
- 10.2. Market Analysis, Insights and Forecast - by Types
- 10.2.1. 28 nm
- 10.2.2. 40 nm
- 10.2.3. Other
- 10.1. Market Analysis, Insights and Forecast - by Application
- 11. Asia Pacific OLED DDIC Foundry Analysis, Insights and Forecast, 2020-2032
- 11.1. Market Analysis, Insights and Forecast - by Application
- 11.1.1. Smartphones
- 11.1.2. Smart Wearables
- 11.1.3. Other
- 11.2. Market Analysis, Insights and Forecast - by Types
- 11.2.1. 28 nm
- 11.2.2. 40 nm
- 11.2.3. Other
- 11.1. Market Analysis, Insights and Forecast - by Application
- 12. Competitive Analysis
- 12.1. Company Profiles
- 12.1.1 Samsung Foundry
- 12.1.1.1. Company Overview
- 12.1.1.2. Products
- 12.1.1.3. Company Financials
- 12.1.1.4. SWOT Analysis
- 12.1.2 GlobalFoundries
- 12.1.2.1. Company Overview
- 12.1.2.2. Products
- 12.1.2.3. Company Financials
- 12.1.2.4. SWOT Analysis
- 12.1.3 UMC
- 12.1.3.1. Company Overview
- 12.1.3.2. Products
- 12.1.3.3. Company Financials
- 12.1.3.4. SWOT Analysis
- 12.1.4 TSMC
- 12.1.4.1. Company Overview
- 12.1.4.2. Products
- 12.1.4.3. Company Financials
- 12.1.4.4. SWOT Analysis
- 12.1.5 SMIC
- 12.1.5.1. Company Overview
- 12.1.5.2. Products
- 12.1.5.3. Company Financials
- 12.1.5.4. SWOT Analysis
- 12.1.6 Nexchip
- 12.1.6.1. Company Overview
- 12.1.6.2. Products
- 12.1.6.3. Company Financials
- 12.1.6.4. SWOT Analysis
- 12.1.7 PowerChip
- 12.1.7.1. Company Overview
- 12.1.7.2. Products
- 12.1.7.3. Company Financials
- 12.1.7.4. SWOT Analysis
- 12.1.8 DB HiTek
- 12.1.8.1. Company Overview
- 12.1.8.2. Products
- 12.1.8.3. Company Financials
- 12.1.8.4. SWOT Analysis
- 12.1.1 Samsung Foundry
- 12.2. Market Entropy
- 12.2.1 Company's Key Areas Served
- 12.2.2 Recent Developments
- 12.3. Company Market Share Analysis 2025
- 12.3.1 Top 5 Companies Market Share Analysis
- 12.3.2 Top 3 Companies Market Share Analysis
- 12.4. List of Potential Customers
- 13. Research Methodology
List of Figures
- Figure 1: Global OLED DDIC Foundry Revenue Breakdown (undefined, %) by Region 2025 & 2033
- Figure 2: North America OLED DDIC Foundry Revenue (undefined), by Application 2025 & 2033
- Figure 3: North America OLED DDIC Foundry Revenue Share (%), by Application 2025 & 2033
- Figure 4: North America OLED DDIC Foundry Revenue (undefined), by Types 2025 & 2033
- Figure 5: North America OLED DDIC Foundry Revenue Share (%), by Types 2025 & 2033
- Figure 6: North America OLED DDIC Foundry Revenue (undefined), by Country 2025 & 2033
- Figure 7: North America OLED DDIC Foundry Revenue Share (%), by Country 2025 & 2033
- Figure 8: South America OLED DDIC Foundry Revenue (undefined), by Application 2025 & 2033
- Figure 9: South America OLED DDIC Foundry Revenue Share (%), by Application 2025 & 2033
- Figure 10: South America OLED DDIC Foundry Revenue (undefined), by Types 2025 & 2033
- Figure 11: South America OLED DDIC Foundry Revenue Share (%), by Types 2025 & 2033
- Figure 12: South America OLED DDIC Foundry Revenue (undefined), by Country 2025 & 2033
- Figure 13: South America OLED DDIC Foundry Revenue Share (%), by Country 2025 & 2033
- Figure 14: Europe OLED DDIC Foundry Revenue (undefined), by Application 2025 & 2033
- Figure 15: Europe OLED DDIC Foundry Revenue Share (%), by Application 2025 & 2033
- Figure 16: Europe OLED DDIC Foundry Revenue (undefined), by Types 2025 & 2033
- Figure 17: Europe OLED DDIC Foundry Revenue Share (%), by Types 2025 & 2033
- Figure 18: Europe OLED DDIC Foundry Revenue (undefined), by Country 2025 & 2033
- Figure 19: Europe OLED DDIC Foundry Revenue Share (%), by Country 2025 & 2033
- Figure 20: Middle East & Africa OLED DDIC Foundry Revenue (undefined), by Application 2025 & 2033
- Figure 21: Middle East & Africa OLED DDIC Foundry Revenue Share (%), by Application 2025 & 2033
- Figure 22: Middle East & Africa OLED DDIC Foundry Revenue (undefined), by Types 2025 & 2033
- Figure 23: Middle East & Africa OLED DDIC Foundry Revenue Share (%), by Types 2025 & 2033
- Figure 24: Middle East & Africa OLED DDIC Foundry Revenue (undefined), by Country 2025 & 2033
- Figure 25: Middle East & Africa OLED DDIC Foundry Revenue Share (%), by Country 2025 & 2033
- Figure 26: Asia Pacific OLED DDIC Foundry Revenue (undefined), by Application 2025 & 2033
- Figure 27: Asia Pacific OLED DDIC Foundry Revenue Share (%), by Application 2025 & 2033
- Figure 28: Asia Pacific OLED DDIC Foundry Revenue (undefined), by Types 2025 & 2033
- Figure 29: Asia Pacific OLED DDIC Foundry Revenue Share (%), by Types 2025 & 2033
- Figure 30: Asia Pacific OLED DDIC Foundry Revenue (undefined), by Country 2025 & 2033
- Figure 31: Asia Pacific OLED DDIC Foundry Revenue Share (%), by Country 2025 & 2033
List of Tables
- Table 1: Global OLED DDIC Foundry Revenue undefined Forecast, by Application 2020 & 2033
- Table 2: Global OLED DDIC Foundry Revenue undefined Forecast, by Types 2020 & 2033
- Table 3: Global OLED DDIC Foundry Revenue undefined Forecast, by Region 2020 & 2033
- Table 4: Global OLED DDIC Foundry Revenue undefined Forecast, by Application 2020 & 2033
- Table 5: Global OLED DDIC Foundry Revenue undefined Forecast, by Types 2020 & 2033
- Table 6: Global OLED DDIC Foundry Revenue undefined Forecast, by Country 2020 & 2033
- Table 7: United States OLED DDIC Foundry Revenue (undefined) Forecast, by Application 2020 & 2033
- Table 8: Canada OLED DDIC Foundry Revenue (undefined) Forecast, by Application 2020 & 2033
- Table 9: Mexico OLED DDIC Foundry Revenue (undefined) Forecast, by Application 2020 & 2033
- Table 10: Global OLED DDIC Foundry Revenue undefined Forecast, by Application 2020 & 2033
- Table 11: Global OLED DDIC Foundry Revenue undefined Forecast, by Types 2020 & 2033
- Table 12: Global OLED DDIC Foundry Revenue undefined Forecast, by Country 2020 & 2033
- Table 13: Brazil OLED DDIC Foundry Revenue (undefined) Forecast, by Application 2020 & 2033
- Table 14: Argentina OLED DDIC Foundry Revenue (undefined) Forecast, by Application 2020 & 2033
- Table 15: Rest of South America OLED DDIC Foundry Revenue (undefined) Forecast, by Application 2020 & 2033
- Table 16: Global OLED DDIC Foundry Revenue undefined Forecast, by Application 2020 & 2033
- Table 17: Global OLED DDIC Foundry Revenue undefined Forecast, by Types 2020 & 2033
- Table 18: Global OLED DDIC Foundry Revenue undefined Forecast, by Country 2020 & 2033
- Table 19: United Kingdom OLED DDIC Foundry Revenue (undefined) Forecast, by Application 2020 & 2033
- Table 20: Germany OLED DDIC Foundry Revenue (undefined) Forecast, by Application 2020 & 2033
- Table 21: France OLED DDIC Foundry Revenue (undefined) Forecast, by Application 2020 & 2033
- Table 22: Italy OLED DDIC Foundry Revenue (undefined) Forecast, by Application 2020 & 2033
- Table 23: Spain OLED DDIC Foundry Revenue (undefined) Forecast, by Application 2020 & 2033
- Table 24: Russia OLED DDIC Foundry Revenue (undefined) Forecast, by Application 2020 & 2033
- Table 25: Benelux OLED DDIC Foundry Revenue (undefined) Forecast, by Application 2020 & 2033
- Table 26: Nordics OLED DDIC Foundry Revenue (undefined) Forecast, by Application 2020 & 2033
- Table 27: Rest of Europe OLED DDIC Foundry Revenue (undefined) Forecast, by Application 2020 & 2033
- Table 28: Global OLED DDIC Foundry Revenue undefined Forecast, by Application 2020 & 2033
- Table 29: Global OLED DDIC Foundry Revenue undefined Forecast, by Types 2020 & 2033
- Table 30: Global OLED DDIC Foundry Revenue undefined Forecast, by Country 2020 & 2033
- Table 31: Turkey OLED DDIC Foundry Revenue (undefined) Forecast, by Application 2020 & 2033
- Table 32: Israel OLED DDIC Foundry Revenue (undefined) Forecast, by Application 2020 & 2033
- Table 33: GCC OLED DDIC Foundry Revenue (undefined) Forecast, by Application 2020 & 2033
- Table 34: North Africa OLED DDIC Foundry Revenue (undefined) Forecast, by Application 2020 & 2033
- Table 35: South Africa OLED DDIC Foundry Revenue (undefined) Forecast, by Application 2020 & 2033
- Table 36: Rest of Middle East & Africa OLED DDIC Foundry Revenue (undefined) Forecast, by Application 2020 & 2033
- Table 37: Global OLED DDIC Foundry Revenue undefined Forecast, by Application 2020 & 2033
- Table 38: Global OLED DDIC Foundry Revenue undefined Forecast, by Types 2020 & 2033
- Table 39: Global OLED DDIC Foundry Revenue undefined Forecast, by Country 2020 & 2033
- Table 40: China OLED DDIC Foundry Revenue (undefined) Forecast, by Application 2020 & 2033
- Table 41: India OLED DDIC Foundry Revenue (undefined) Forecast, by Application 2020 & 2033
- Table 42: Japan OLED DDIC Foundry Revenue (undefined) Forecast, by Application 2020 & 2033
- Table 43: South Korea OLED DDIC Foundry Revenue (undefined) Forecast, by Application 2020 & 2033
- Table 44: ASEAN OLED DDIC Foundry Revenue (undefined) Forecast, by Application 2020 & 2033
- Table 45: Oceania OLED DDIC Foundry Revenue (undefined) Forecast, by Application 2020 & 2033
- Table 46: Rest of Asia Pacific OLED DDIC Foundry Revenue (undefined) Forecast, by Application 2020 & 2033
Frequently Asked Questions
1. What is the projected Compound Annual Growth Rate (CAGR) of the OLED DDIC Foundry?
The projected CAGR is approximately 15%.
2. Which companies are prominent players in the OLED DDIC Foundry?
Key companies in the market include Samsung Foundry, GlobalFoundries, UMC, TSMC, SMIC, Nexchip, PowerChip, DB HiTek.
3. What are the main segments of the OLED DDIC Foundry?
The market segments include Application, Types.
4. Can you provide details about the market size?
The market size is estimated to be USD XXX N/A as of 2022.
5. What are some drivers contributing to market growth?
N/A
6. What are the notable trends driving market growth?
N/A
7. Are there any restraints impacting market growth?
N/A
8. Can you provide examples of recent developments in the market?
N/A
9. What pricing options are available for accessing the report?
Pricing options include single-user, multi-user, and enterprise licenses priced at USD 3950.00, USD 5925.00, and USD 7900.00 respectively.
10. Is the market size provided in terms of value or volume?
The market size is provided in terms of value, measured in N/A.
11. Are there any specific market keywords associated with the report?
Yes, the market keyword associated with the report is "OLED DDIC Foundry," which aids in identifying and referencing the specific market segment covered.
12. How do I determine which pricing option suits my needs best?
The pricing options vary based on user requirements and access needs. Individual users may opt for single-user licenses, while businesses requiring broader access may choose multi-user or enterprise licenses for cost-effective access to the report.
13. Are there any additional resources or data provided in the OLED DDIC Foundry report?
While the report offers comprehensive insights, it's advisable to review the specific contents or supplementary materials provided to ascertain if additional resources or data are available.
14. How can I stay updated on further developments or reports in the OLED DDIC Foundry?
To stay informed about further developments, trends, and reports in the OLED DDIC Foundry, consider subscribing to industry newsletters, following relevant companies and organizations, or regularly checking reputable industry news sources and publications.
Methodology
Step 1 - Identification of Relevant Samples Size from Population Database


Step 2 - Approaches for Defining Global Market Size (Value, Volume* & Price*)

Note*: In applicable scenarios
Step 3 - Data Sources
Primary Research
- Web Analytics
- Survey Reports
- Research Institute
- Latest Research Reports
- Opinion Leaders
Secondary Research
- Annual Reports
- White Paper
- Latest Press Release
- Industry Association
- Paid Database
- Investor Presentations

Step 4 - Data Triangulation
Involves using different sources of information in order to increase the validity of a study
These sources are likely to be stakeholders in a program - participants, other researchers, program staff, other community members, and so on.
Then we put all data in single framework & apply various statistical tools to find out the dynamic on the market.
During the analysis stage, feedback from the stakeholder groups would be compared to determine areas of agreement as well as areas of divergence