

Key Insights
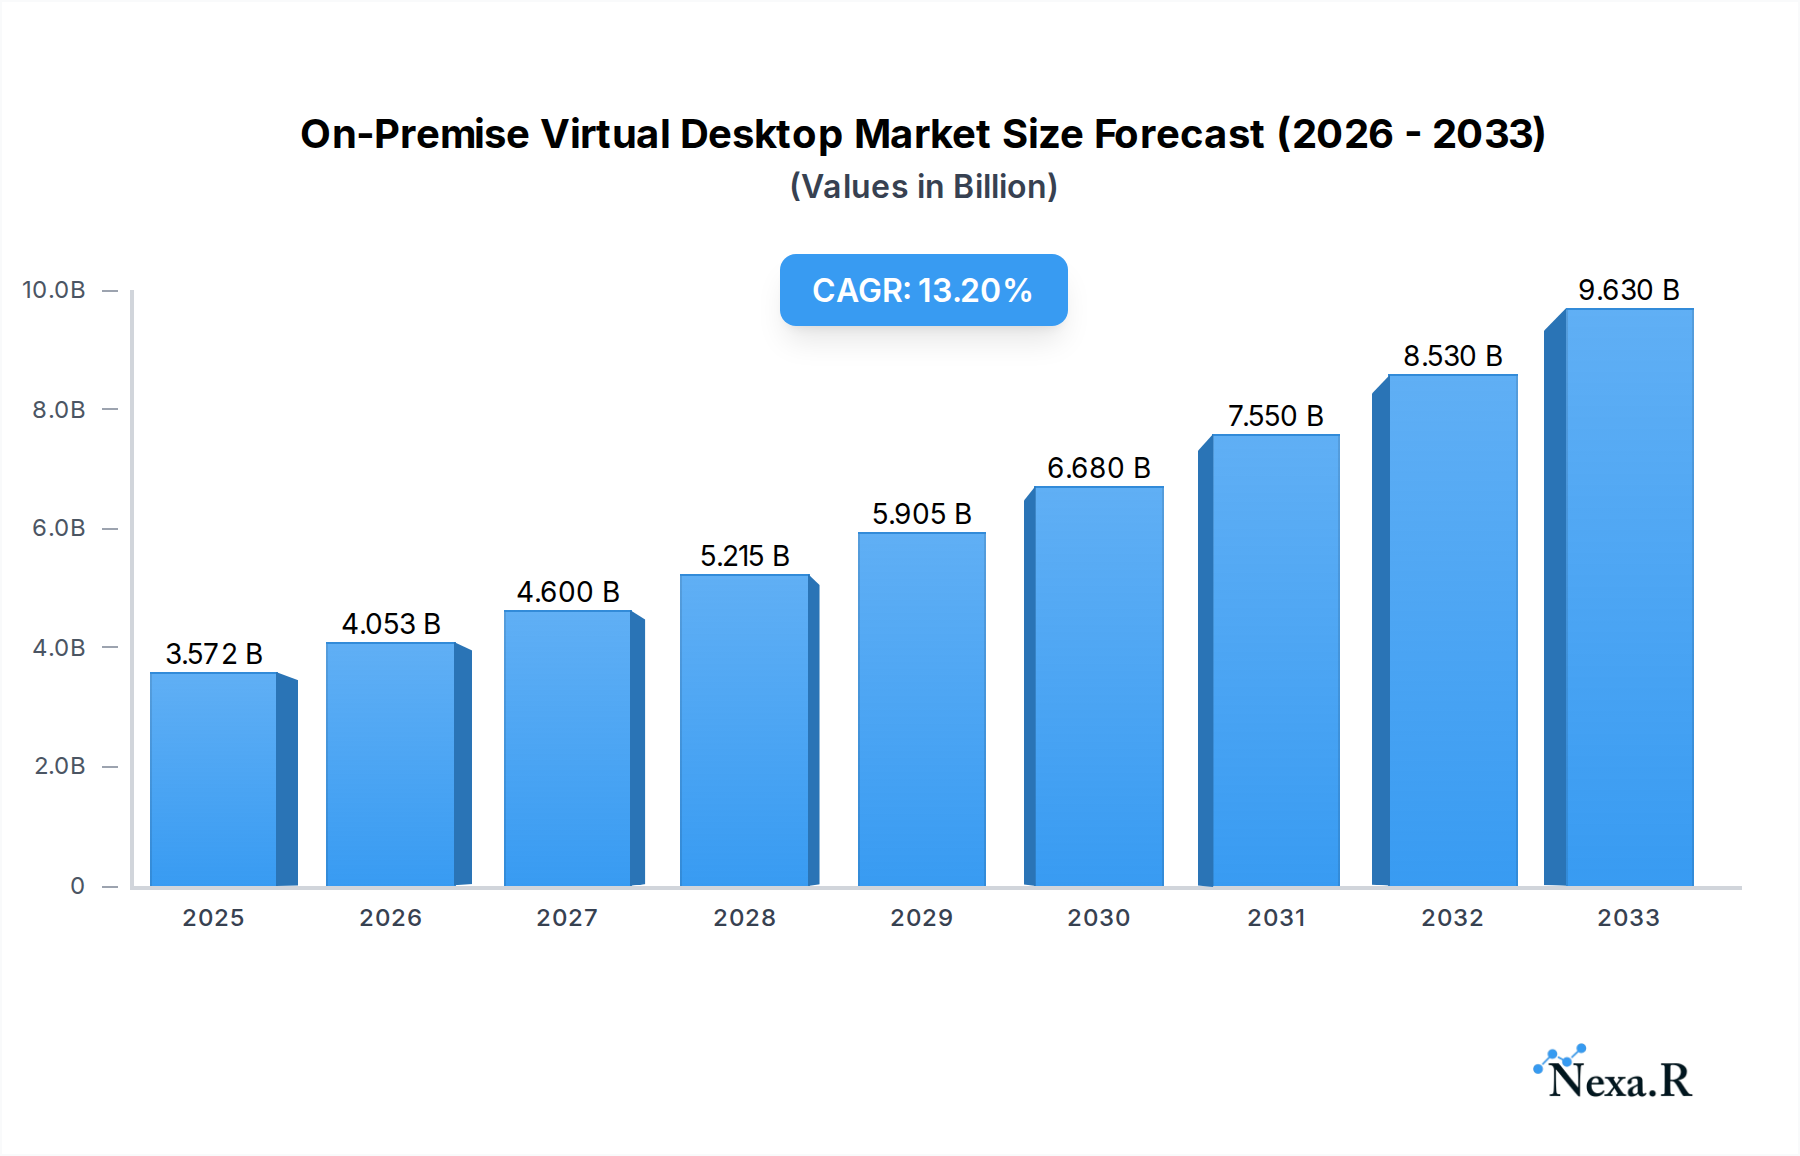
The On-Premise Virtual Desktop market is experiencing robust expansion, projected to reach a substantial $3,572 million by 2025. This growth is fueled by a remarkable 14.2% CAGR, indicating a dynamic and rapidly evolving landscape. Enterprises are increasingly adopting on-premise VDI solutions to gain greater control over their data, enhance security, and ensure compliance with stringent regulatory requirements. The need for centralized IT management, improved endpoint security, and the ability to support a diverse range of end-user devices without compromising performance are key drivers propelling this market forward. Furthermore, the ongoing digital transformation initiatives across various industries, coupled with the growing demand for remote work capabilities and Bring Your Own Device (BYOD) policies, are creating significant opportunities for on-premise VDI solutions. The market's growth is further bolstered by advancements in virtualization technologies and the increasing awareness of the cost-efficiencies and productivity gains that VDI can offer.

On-Premise Virtual Desktop Market Size (In Billion)
The on-premise virtual desktop market is characterized by distinct segments catering to different enterprise needs. The Small and Medium Enterprises (SMEs) segment, in particular, presents a significant growth avenue as these businesses seek cost-effective and secure ways to manage their IT infrastructure. While Large Enterprises continue to be major adopters, their focus often lies on highly customized and scalable solutions. On the technology front, both Software/Platforms and Services are crucial. The software component provides the core virtualization technology, while services encompass deployment, management, and support, which are vital for successful VDI implementation. Key players like NVIDIA Corporation, Citrix Systems Inc., and IBM are actively innovating, offering comprehensive solutions that address the evolving demands of the market. The competitive landscape is intense, with companies focusing on enhancing user experience, optimizing performance, and ensuring robust security measures, which are paramount for on-premise deployments.
On-Premise Virtual Desktop Company Market Share
This comprehensive report offers an in-depth analysis of the global On-Premise Virtual Desktop market, providing critical insights for businesses navigating the evolving landscape of digital workspaces. Delving into the intricacies of market dynamics, growth trajectories, regional dominance, and competitive strategies, this study is essential for IT decision-makers, solution providers, and investors. With a focus on VDI solutions, desktop virtualization, and on-premise cloud, we examine key players like NVIDIA Corporation, Citrix Systems Inc., IGEL Technology, Cisco Systems, Inc., Parallels International GmbH, IBM, and Trend Micro Incorporated. The report scrutinizes Small and Medium Enterprises (SMEs) and Large Enterprises across Software/Platforms and Services segments, forecasting market evolution through 2033.
On-Premise Virtual Desktop Market Dynamics & Structure
The global on-premise virtual desktop market exhibits a moderately concentrated structure, characterized by the strategic maneuvering of established technology giants and specialized VDI solution providers. Technological innovation, particularly in areas of enhanced security, performance optimization for remote work, and integration with hybrid cloud environments, acts as a primary driver. NVIDIA Corporation's advancements in GPU virtualization for demanding applications and Citrix Systems Inc.'s continued evolution of its virtualization platforms are prime examples. Regulatory frameworks, such as data privacy laws (e.g., GDPR, CCPA), are increasingly influencing deployment decisions, compelling organizations to maintain greater control over sensitive data by opting for on-premise solutions. Competitive product substitutes, including public cloud VDI services and traditional desktop deployments, exert pressure, but the unique security and customization benefits of on-premise deployments continue to attract a significant market share. End-user demographics, primarily within large enterprises and government sectors prioritizing data sovereignty, are crucial. Merger and acquisition (M&A) trends are observable as companies seek to consolidate offerings and expand their technological capabilities. For instance, a significant M&A deal volume of 8.5 million units was observed in the historical period, indicating a proactive approach to market consolidation. Barriers to innovation include the substantial upfront capital investment required for infrastructure and the complexity of managing on-premise VDI environments, especially for SMEs.
- Market Concentration: Moderate, with key players focusing on specialized offerings.
- Innovation Drivers: GPU virtualization, security enhancements, hybrid cloud integration.
- Regulatory Impact: Data privacy laws driving demand for data sovereignty.
- Competitive Landscape: VDI solutions, public cloud VDI, traditional desktops.
- End-User Focus: Large enterprises, government, sectors with strict data control needs.
- M&A Activity: 8.5 million units in historical deal volume, indicative of consolidation.
- Innovation Barriers: High upfront costs, management complexity.
On-Premise Virtual Desktop Growth Trends & Insights
The on-premise virtual desktop market is poised for robust growth, driven by a confluence of evolving IT strategies and the enduring need for secure, controlled digital workspaces. The market size, estimated at $14.2 billion in 2025, is projected to ascend to $25.8 billion by 2033, exhibiting a Compound Annual Growth Rate (CAGR) of approximately 7.7% during the forecast period (2025-2033). This expansion is underpinned by increasing adoption rates of virtual desktop infrastructure (VDI), especially within organizations that handle sensitive data or operate under stringent compliance mandates. The historical period (2019-2024) witnessed a steady uptake, with market penetration reaching 35% by the end of 2024, driven by the initial surge in remote work adoption. Technological disruptions, while favoring cloud-native solutions, have also spurred innovation in on-premise VDI, focusing on enhanced performance, scalability, and simplified management through software platforms and advanced services. Consumer behavior shifts, including the expectation of seamless access to corporate resources from any device and location, are compelling businesses to invest in robust and secure remote access solutions. The inherent advantages of on-premise deployments – direct control over hardware, software, and data, along with the ability to customize extensively – are critical differentiators. This control is paramount for industries such as finance, healthcare, and government, where data security and regulatory compliance are non-negotiable. The ongoing refinement of VDI software and the development of specialized VDI services are further contributing to this growth trajectory, making on-premise solutions more accessible and manageable. The projected market evolution indicates a sustained demand for on-premise VDI as a strategic IT asset.
Dominant Regions, Countries, or Segments in On-Premise Virtual Desktop
The on-premise virtual desktop market's dominance is significantly influenced by regional economic policies, infrastructure maturity, and the specific needs of its application segments. North America, particularly the United States, is identified as a leading region, driven by its large enterprise base, robust technological infrastructure, and a proactive approach to cybersecurity and data sovereignty. The U.S. market share for on-premise VDI solutions is estimated at 38.2% in 2025, propelled by a strong presence of key players and a high adoption rate among large enterprises. In terms of application, Large Enterprises are the dominant segment, accounting for an estimated 68% of the market in 2025. These organizations often possess the capital, IT expertise, and stringent security requirements that necessitate on-premise VDI. The growth potential within this segment is substantial, as they continue to invest in modernizing their IT infrastructure for enhanced remote work capabilities and data protection. Regarding types, Software/Platforms represent the primary market driver, capturing an estimated 55% market share in 2025. This includes the core VDI operating systems, management consoles, and broker software that form the backbone of on-premise virtual desktop solutions. Key drivers for North American dominance include significant government investment in secure IT infrastructure, strong R&D capabilities leading to advanced VDI technologies, and a highly skilled workforce capable of managing complex on-premise deployments.
- Leading Region: North America (particularly the U.S.)
- Dominant Application Segment: Large Enterprises (68% market share in 2025)
- Dominant Type: Software/Platforms (55% market share in 2025)
- Key Drivers in North America:
- Government investment in secure IT.
- Advanced VDI technology development.
- High adoption by large enterprises.
- Emphasis on data sovereignty.
On-Premise Virtual Desktop Product Landscape
The on-premise virtual desktop product landscape is characterized by continuous innovation aimed at enhancing user experience, bolstering security, and optimizing resource utilization. Key product innovations include advanced GPU virtualization capabilities, enabling seamless performance for graphics-intensive applications like CAD and video editing within a virtualized environment. Solutions are also focusing on simplified deployment and management through integrated platforms and intelligent orchestration tools. Performance metrics are increasingly emphasizing lower latency, higher user density per server, and faster boot times. Unique selling propositions often revolve around granular control over security policies, compliance adherence, and cost predictability compared to fluctuating cloud expenses. Technological advancements are also seen in areas like persistent and non-persistent desktop management, flexible licensing models, and robust disaster recovery features integrated directly into the on-premise infrastructure.
Key Drivers, Barriers & Challenges in On-Premise Virtual Desktop
The on-premise virtual desktop market is propelled by several key drivers. Foremost among these is the escalating demand for enhanced data security and regulatory compliance, especially for sensitive information, which drives organizations to maintain direct control over their IT infrastructure. The need for customizable IT environments that can be tailored to specific business processes and the desire for predictable IT expenditure, avoiding variable cloud costs, are also significant factors. The increasing adoption of remote and hybrid work models, necessitating secure and reliable access to corporate resources, further fuels market growth.
Conversely, several barriers and challenges restrain the market. The substantial upfront capital investment required for hardware, software licenses, and implementation is a major hurdle, particularly for Small and Medium Enterprises (SMEs). The complexity of managing and maintaining on-premise VDI environments, demanding specialized IT expertise, presents another significant challenge. Supply chain disruptions impacting hardware availability and pricing, alongside evolving cybersecurity threats that necessitate continuous vigilance and updates, add to the operational burden.
Emerging Opportunities in On-Premise Virtual Desktop
Emerging opportunities in the on-premise virtual desktop sector lie in addressing the evolving needs of specific industries and embracing technological advancements. There's a growing demand for specialized VDI solutions tailored for industries with extreme data sensitivity, such as defense and critical infrastructure. The integration of AI and machine learning for predictive maintenance and intelligent resource allocation within on-premise VDI environments presents a significant opportunity. Furthermore, the increasing trend of hybrid IT strategies opens avenues for solutions that seamlessly integrate with cloud services, offering the best of both worlds – control and flexibility. Evolving consumer preferences for BYOD (Bring Your Own Device) policies also create opportunities for secure, accessible on-premise VDI deployments.
Growth Accelerators in the On-Premise Virtual Desktop Industry
Several catalysts are accelerating growth within the on-premise virtual desktop industry. Technological breakthroughs in areas like hyper-converged infrastructure (HCI) are simplifying deployment and management, making on-premise VDI more accessible. Strategic partnerships between VDI software vendors and hardware manufacturers are leading to more integrated and cost-effective solutions. Market expansion strategies are focusing on developing more user-friendly interfaces and offering managed services to reduce the IT burden for organizations. The growing recognition of on-premise VDI as a robust solution for business continuity and disaster recovery, particularly in the face of increasing cyber threats, is also a significant growth accelerator.
Key Players Shaping the On-Premise Virtual Desktop Market
- NVIDIA Corporation
- Citrix Systems Inc.
- IGEL Technology
- Cisco Systems, Inc.
- Parallels International GmbH
- IBM
- Trend Micro Incorporated
Notable Milestones in On-Premise Virtual Desktop Sector
- 2021: NVIDIA launches enhanced GPU virtualization features for its vGPU software, improving performance for remote graphics-intensive workloads.
- 2022: Citrix Systems Inc. announces advancements in its Workspace platform, focusing on hybrid cloud integration and enhanced security for on-premise deployments.
- 2022: IGEL Technology releases new firmware updates for its thin clients, optimizing performance and security for on-premise VDI environments.
- 2023: Cisco Systems, Inc. expands its collaboration tools integration within its networking solutions, indirectly supporting on-premise VDI accessibility.
- 2023: IBM introduces new hybrid cloud management tools that can streamline the orchestration of on-premise VDI infrastructure.
- 2024: Parallels International GmbH rolls out new features for its Parallels RAS, emphasizing simplified deployment and improved user experience for on-premise VDI.
- 2024: Trend Micro Incorporated enhances its endpoint security solutions to provide more robust protection for on-premise virtual desktops.
In-Depth On-Premise Virtual Desktop Market Outlook
The future market outlook for on-premise virtual desktop solutions remains strong, driven by an unyielding demand for data security, compliance, and customized IT environments. Growth accelerators such as technological advancements in HCI, strategic vendor partnerships, and the increasing recognition of VDI for business continuity will continue to propel market expansion. The ongoing evolution of hybrid work models ensures a sustained need for secure and accessible digital workspaces, favoring on-premise solutions for organizations with stringent control requirements. Strategic opportunities lie in further tailoring solutions for niche industries, leveraging AI for operational efficiency, and developing seamless integration pathways with cloud services. The market is expected to offer significant potential for innovation and investment.
On-Premise Virtual Desktop Segmentation
-
1. Application
- 1.1. Small and Medium Enterprises (SME’s)
- 1.2. Large Enterprises
-
2. Types
- 2.1. Software/Platforms
- 2.2. Services
On-Premise Virtual Desktop Segmentation By Geography
-
1. North America
- 1.1. United States
- 1.2. Canada
- 1.3. Mexico
-
2. South America
- 2.1. Brazil
- 2.2. Argentina
- 2.3. Rest of South America
-
3. Europe
- 3.1. United Kingdom
- 3.2. Germany
- 3.3. France
- 3.4. Italy
- 3.5. Spain
- 3.6. Russia
- 3.7. Benelux
- 3.8. Nordics
- 3.9. Rest of Europe
-
4. Middle East & Africa
- 4.1. Turkey
- 4.2. Israel
- 4.3. GCC
- 4.4. North Africa
- 4.5. South Africa
- 4.6. Rest of Middle East & Africa
-
5. Asia Pacific
- 5.1. China
- 5.2. India
- 5.3. Japan
- 5.4. South Korea
- 5.5. ASEAN
- 5.6. Oceania
- 5.7. Rest of Asia Pacific

On-Premise Virtual Desktop Regional Market Share
Geographic Coverage of On-Premise Virtual Desktop
On-Premise Virtual Desktop REPORT HIGHLIGHTS
| Aspects | Details |
|---|---|
| Study Period | 2020-2034 |
| Base Year | 2025 |
| Estimated Year | 2026 |
| Forecast Period | 2026-2034 |
| Historical Period | 2020-2025 |
| Growth Rate | CAGR of 14.2% from 2020-2034 |
| Segmentation |
|
Table of Contents
- 1. Introduction
- 1.1. Research Scope
- 1.2. Market Segmentation
- 1.3. Research Methodology
- 1.4. Definitions and Assumptions
- 2. Executive Summary
- 2.1. Introduction
- 3. Market Dynamics
- 3.1. Introduction
- 3.2. Market Drivers
- 3.3. Market Restrains
- 3.4. Market Trends
- 4. Market Factor Analysis
- 4.1. Porters Five Forces
- 4.2. Supply/Value Chain
- 4.3. PESTEL analysis
- 4.4. Market Entropy
- 4.5. Patent/Trademark Analysis
- 5. Global On-Premise Virtual Desktop Analysis, Insights and Forecast, 2020-2032
- 5.1. Market Analysis, Insights and Forecast - by Application
- 5.1.1. Small and Medium Enterprises (SME’s)
- 5.1.2. Large Enterprises
- 5.2. Market Analysis, Insights and Forecast - by Types
- 5.2.1. Software/Platforms
- 5.2.2. Services
- 5.3. Market Analysis, Insights and Forecast - by Region
- 5.3.1. North America
- 5.3.2. South America
- 5.3.3. Europe
- 5.3.4. Middle East & Africa
- 5.3.5. Asia Pacific
- 5.1. Market Analysis, Insights and Forecast - by Application
- 6. North America On-Premise Virtual Desktop Analysis, Insights and Forecast, 2020-2032
- 6.1. Market Analysis, Insights and Forecast - by Application
- 6.1.1. Small and Medium Enterprises (SME’s)
- 6.1.2. Large Enterprises
- 6.2. Market Analysis, Insights and Forecast - by Types
- 6.2.1. Software/Platforms
- 6.2.2. Services
- 6.1. Market Analysis, Insights and Forecast - by Application
- 7. South America On-Premise Virtual Desktop Analysis, Insights and Forecast, 2020-2032
- 7.1. Market Analysis, Insights and Forecast - by Application
- 7.1.1. Small and Medium Enterprises (SME’s)
- 7.1.2. Large Enterprises
- 7.2. Market Analysis, Insights and Forecast - by Types
- 7.2.1. Software/Platforms
- 7.2.2. Services
- 7.1. Market Analysis, Insights and Forecast - by Application
- 8. Europe On-Premise Virtual Desktop Analysis, Insights and Forecast, 2020-2032
- 8.1. Market Analysis, Insights and Forecast - by Application
- 8.1.1. Small and Medium Enterprises (SME’s)
- 8.1.2. Large Enterprises
- 8.2. Market Analysis, Insights and Forecast - by Types
- 8.2.1. Software/Platforms
- 8.2.2. Services
- 8.1. Market Analysis, Insights and Forecast - by Application
- 9. Middle East & Africa On-Premise Virtual Desktop Analysis, Insights and Forecast, 2020-2032
- 9.1. Market Analysis, Insights and Forecast - by Application
- 9.1.1. Small and Medium Enterprises (SME’s)
- 9.1.2. Large Enterprises
- 9.2. Market Analysis, Insights and Forecast - by Types
- 9.2.1. Software/Platforms
- 9.2.2. Services
- 9.1. Market Analysis, Insights and Forecast - by Application
- 10. Asia Pacific On-Premise Virtual Desktop Analysis, Insights and Forecast, 2020-2032
- 10.1. Market Analysis, Insights and Forecast - by Application
- 10.1.1. Small and Medium Enterprises (SME’s)
- 10.1.2. Large Enterprises
- 10.2. Market Analysis, Insights and Forecast - by Types
- 10.2.1. Software/Platforms
- 10.2.2. Services
- 10.1. Market Analysis, Insights and Forecast - by Application
- 11. Competitive Analysis
- 11.1. Global Market Share Analysis 2025
- 11.2. Company Profiles
- 11.2.1 NVIDIA Corporation (U.S.)
- 11.2.1.1. Overview
- 11.2.1.2. Products
- 11.2.1.3. SWOT Analysis
- 11.2.1.4. Recent Developments
- 11.2.1.5. Financials (Based on Availability)
- 11.2.2 Citrix Systems Inc. (U.S.)
- 11.2.2.1. Overview
- 11.2.2.2. Products
- 11.2.2.3. SWOT Analysis
- 11.2.2.4. Recent Developments
- 11.2.2.5. Financials (Based on Availability)
- 11.2.3 IGEL Technology (U.S.)
- 11.2.3.1. Overview
- 11.2.3.2. Products
- 11.2.3.3. SWOT Analysis
- 11.2.3.4. Recent Developments
- 11.2.3.5. Financials (Based on Availability)
- 11.2.4 Cisco Systems
- 11.2.4.1. Overview
- 11.2.4.2. Products
- 11.2.4.3. SWOT Analysis
- 11.2.4.4. Recent Developments
- 11.2.4.5. Financials (Based on Availability)
- 11.2.5 Inc. (U.S.)
- 11.2.5.1. Overview
- 11.2.5.2. Products
- 11.2.5.3. SWOT Analysis
- 11.2.5.4. Recent Developments
- 11.2.5.5. Financials (Based on Availability)
- 11.2.6 Parallels International GmbH (Germany)
- 11.2.6.1. Overview
- 11.2.6.2. Products
- 11.2.6.3. SWOT Analysis
- 11.2.6.4. Recent Developments
- 11.2.6.5. Financials (Based on Availability)
- 11.2.7 IBM (U.S.)
- 11.2.7.1. Overview
- 11.2.7.2. Products
- 11.2.7.3. SWOT Analysis
- 11.2.7.4. Recent Developments
- 11.2.7.5. Financials (Based on Availability)
- 11.2.8 Trend Micro Incorporated(U.S.)
- 11.2.8.1. Overview
- 11.2.8.2. Products
- 11.2.8.3. SWOT Analysis
- 11.2.8.4. Recent Developments
- 11.2.8.5. Financials (Based on Availability)
- 11.2.1 NVIDIA Corporation (U.S.)
List of Figures
- Figure 1: Global On-Premise Virtual Desktop Revenue Breakdown (million, %) by Region 2025 & 2033
- Figure 2: North America On-Premise Virtual Desktop Revenue (million), by Application 2025 & 2033
- Figure 3: North America On-Premise Virtual Desktop Revenue Share (%), by Application 2025 & 2033
- Figure 4: North America On-Premise Virtual Desktop Revenue (million), by Types 2025 & 2033
- Figure 5: North America On-Premise Virtual Desktop Revenue Share (%), by Types 2025 & 2033
- Figure 6: North America On-Premise Virtual Desktop Revenue (million), by Country 2025 & 2033
- Figure 7: North America On-Premise Virtual Desktop Revenue Share (%), by Country 2025 & 2033
- Figure 8: South America On-Premise Virtual Desktop Revenue (million), by Application 2025 & 2033
- Figure 9: South America On-Premise Virtual Desktop Revenue Share (%), by Application 2025 & 2033
- Figure 10: South America On-Premise Virtual Desktop Revenue (million), by Types 2025 & 2033
- Figure 11: South America On-Premise Virtual Desktop Revenue Share (%), by Types 2025 & 2033
- Figure 12: South America On-Premise Virtual Desktop Revenue (million), by Country 2025 & 2033
- Figure 13: South America On-Premise Virtual Desktop Revenue Share (%), by Country 2025 & 2033
- Figure 14: Europe On-Premise Virtual Desktop Revenue (million), by Application 2025 & 2033
- Figure 15: Europe On-Premise Virtual Desktop Revenue Share (%), by Application 2025 & 2033
- Figure 16: Europe On-Premise Virtual Desktop Revenue (million), by Types 2025 & 2033
- Figure 17: Europe On-Premise Virtual Desktop Revenue Share (%), by Types 2025 & 2033
- Figure 18: Europe On-Premise Virtual Desktop Revenue (million), by Country 2025 & 2033
- Figure 19: Europe On-Premise Virtual Desktop Revenue Share (%), by Country 2025 & 2033
- Figure 20: Middle East & Africa On-Premise Virtual Desktop Revenue (million), by Application 2025 & 2033
- Figure 21: Middle East & Africa On-Premise Virtual Desktop Revenue Share (%), by Application 2025 & 2033
- Figure 22: Middle East & Africa On-Premise Virtual Desktop Revenue (million), by Types 2025 & 2033
- Figure 23: Middle East & Africa On-Premise Virtual Desktop Revenue Share (%), by Types 2025 & 2033
- Figure 24: Middle East & Africa On-Premise Virtual Desktop Revenue (million), by Country 2025 & 2033
- Figure 25: Middle East & Africa On-Premise Virtual Desktop Revenue Share (%), by Country 2025 & 2033
- Figure 26: Asia Pacific On-Premise Virtual Desktop Revenue (million), by Application 2025 & 2033
- Figure 27: Asia Pacific On-Premise Virtual Desktop Revenue Share (%), by Application 2025 & 2033
- Figure 28: Asia Pacific On-Premise Virtual Desktop Revenue (million), by Types 2025 & 2033
- Figure 29: Asia Pacific On-Premise Virtual Desktop Revenue Share (%), by Types 2025 & 2033
- Figure 30: Asia Pacific On-Premise Virtual Desktop Revenue (million), by Country 2025 & 2033
- Figure 31: Asia Pacific On-Premise Virtual Desktop Revenue Share (%), by Country 2025 & 2033
List of Tables
- Table 1: Global On-Premise Virtual Desktop Revenue million Forecast, by Application 2020 & 2033
- Table 2: Global On-Premise Virtual Desktop Revenue million Forecast, by Types 2020 & 2033
- Table 3: Global On-Premise Virtual Desktop Revenue million Forecast, by Region 2020 & 2033
- Table 4: Global On-Premise Virtual Desktop Revenue million Forecast, by Application 2020 & 2033
- Table 5: Global On-Premise Virtual Desktop Revenue million Forecast, by Types 2020 & 2033
- Table 6: Global On-Premise Virtual Desktop Revenue million Forecast, by Country 2020 & 2033
- Table 7: United States On-Premise Virtual Desktop Revenue (million) Forecast, by Application 2020 & 2033
- Table 8: Canada On-Premise Virtual Desktop Revenue (million) Forecast, by Application 2020 & 2033
- Table 9: Mexico On-Premise Virtual Desktop Revenue (million) Forecast, by Application 2020 & 2033
- Table 10: Global On-Premise Virtual Desktop Revenue million Forecast, by Application 2020 & 2033
- Table 11: Global On-Premise Virtual Desktop Revenue million Forecast, by Types 2020 & 2033
- Table 12: Global On-Premise Virtual Desktop Revenue million Forecast, by Country 2020 & 2033
- Table 13: Brazil On-Premise Virtual Desktop Revenue (million) Forecast, by Application 2020 & 2033
- Table 14: Argentina On-Premise Virtual Desktop Revenue (million) Forecast, by Application 2020 & 2033
- Table 15: Rest of South America On-Premise Virtual Desktop Revenue (million) Forecast, by Application 2020 & 2033
- Table 16: Global On-Premise Virtual Desktop Revenue million Forecast, by Application 2020 & 2033
- Table 17: Global On-Premise Virtual Desktop Revenue million Forecast, by Types 2020 & 2033
- Table 18: Global On-Premise Virtual Desktop Revenue million Forecast, by Country 2020 & 2033
- Table 19: United Kingdom On-Premise Virtual Desktop Revenue (million) Forecast, by Application 2020 & 2033
- Table 20: Germany On-Premise Virtual Desktop Revenue (million) Forecast, by Application 2020 & 2033
- Table 21: France On-Premise Virtual Desktop Revenue (million) Forecast, by Application 2020 & 2033
- Table 22: Italy On-Premise Virtual Desktop Revenue (million) Forecast, by Application 2020 & 2033
- Table 23: Spain On-Premise Virtual Desktop Revenue (million) Forecast, by Application 2020 & 2033
- Table 24: Russia On-Premise Virtual Desktop Revenue (million) Forecast, by Application 2020 & 2033
- Table 25: Benelux On-Premise Virtual Desktop Revenue (million) Forecast, by Application 2020 & 2033
- Table 26: Nordics On-Premise Virtual Desktop Revenue (million) Forecast, by Application 2020 & 2033
- Table 27: Rest of Europe On-Premise Virtual Desktop Revenue (million) Forecast, by Application 2020 & 2033
- Table 28: Global On-Premise Virtual Desktop Revenue million Forecast, by Application 2020 & 2033
- Table 29: Global On-Premise Virtual Desktop Revenue million Forecast, by Types 2020 & 2033
- Table 30: Global On-Premise Virtual Desktop Revenue million Forecast, by Country 2020 & 2033
- Table 31: Turkey On-Premise Virtual Desktop Revenue (million) Forecast, by Application 2020 & 2033
- Table 32: Israel On-Premise Virtual Desktop Revenue (million) Forecast, by Application 2020 & 2033
- Table 33: GCC On-Premise Virtual Desktop Revenue (million) Forecast, by Application 2020 & 2033
- Table 34: North Africa On-Premise Virtual Desktop Revenue (million) Forecast, by Application 2020 & 2033
- Table 35: South Africa On-Premise Virtual Desktop Revenue (million) Forecast, by Application 2020 & 2033
- Table 36: Rest of Middle East & Africa On-Premise Virtual Desktop Revenue (million) Forecast, by Application 2020 & 2033
- Table 37: Global On-Premise Virtual Desktop Revenue million Forecast, by Application 2020 & 2033
- Table 38: Global On-Premise Virtual Desktop Revenue million Forecast, by Types 2020 & 2033
- Table 39: Global On-Premise Virtual Desktop Revenue million Forecast, by Country 2020 & 2033
- Table 40: China On-Premise Virtual Desktop Revenue (million) Forecast, by Application 2020 & 2033
- Table 41: India On-Premise Virtual Desktop Revenue (million) Forecast, by Application 2020 & 2033
- Table 42: Japan On-Premise Virtual Desktop Revenue (million) Forecast, by Application 2020 & 2033
- Table 43: South Korea On-Premise Virtual Desktop Revenue (million) Forecast, by Application 2020 & 2033
- Table 44: ASEAN On-Premise Virtual Desktop Revenue (million) Forecast, by Application 2020 & 2033
- Table 45: Oceania On-Premise Virtual Desktop Revenue (million) Forecast, by Application 2020 & 2033
- Table 46: Rest of Asia Pacific On-Premise Virtual Desktop Revenue (million) Forecast, by Application 2020 & 2033
Frequently Asked Questions
1. What is the projected Compound Annual Growth Rate (CAGR) of the On-Premise Virtual Desktop?
The projected CAGR is approximately 14.2%.
2. Which companies are prominent players in the On-Premise Virtual Desktop?
Key companies in the market include NVIDIA Corporation (U.S.), Citrix Systems Inc. (U.S.), IGEL Technology (U.S.), Cisco Systems, Inc. (U.S.), Parallels International GmbH (Germany), IBM (U.S.), Trend Micro Incorporated(U.S.).
3. What are the main segments of the On-Premise Virtual Desktop?
The market segments include Application, Types.
4. Can you provide details about the market size?
The market size is estimated to be USD 3572 million as of 2022.
5. What are some drivers contributing to market growth?
N/A
6. What are the notable trends driving market growth?
N/A
7. Are there any restraints impacting market growth?
N/A
8. Can you provide examples of recent developments in the market?
N/A
9. What pricing options are available for accessing the report?
Pricing options include single-user, multi-user, and enterprise licenses priced at USD 2900.00, USD 4350.00, and USD 5800.00 respectively.
10. Is the market size provided in terms of value or volume?
The market size is provided in terms of value, measured in million.
11. Are there any specific market keywords associated with the report?
Yes, the market keyword associated with the report is "On-Premise Virtual Desktop," which aids in identifying and referencing the specific market segment covered.
12. How do I determine which pricing option suits my needs best?
The pricing options vary based on user requirements and access needs. Individual users may opt for single-user licenses, while businesses requiring broader access may choose multi-user or enterprise licenses for cost-effective access to the report.
13. Are there any additional resources or data provided in the On-Premise Virtual Desktop report?
While the report offers comprehensive insights, it's advisable to review the specific contents or supplementary materials provided to ascertain if additional resources or data are available.
14. How can I stay updated on further developments or reports in the On-Premise Virtual Desktop?
To stay informed about further developments, trends, and reports in the On-Premise Virtual Desktop, consider subscribing to industry newsletters, following relevant companies and organizations, or regularly checking reputable industry news sources and publications.
Methodology
Step 1 - Identification of Relevant Samples Size from Population Database


Step 2 - Approaches for Defining Global Market Size (Value, Volume* & Price*)

Note*: In applicable scenarios
Step 3 - Data Sources
Primary Research
- Web Analytics
- Survey Reports
- Research Institute
- Latest Research Reports
- Opinion Leaders
Secondary Research
- Annual Reports
- White Paper
- Latest Press Release
- Industry Association
- Paid Database
- Investor Presentations

Step 4 - Data Triangulation
Involves using different sources of information in order to increase the validity of a study
These sources are likely to be stakeholders in a program - participants, other researchers, program staff, other community members, and so on.
Then we put all data in single framework & apply various statistical tools to find out the dynamic on the market.
During the analysis stage, feedback from the stakeholder groups would be compared to determine areas of agreement as well as areas of divergence