

Key Insights
The global rectifiers market is projected to reach $2.36 billion by 2025, with an anticipated compound annual growth rate (CAGR) of 4.1% from 2025 to 2033. This growth is propelled by escalating demand for power electronics across key sectors like automotive, IT/telecom, and renewable energy. The burgeoning electric vehicle (EV) and hybrid electric vehicle (HEV) markets are significant contributors to automotive rectifier demand. Simultaneously, the need for efficient power management in data centers and telecommunication infrastructure is driving substantial growth in the IT/telecom segment. Technological innovations, including the development of high-efficiency rectifiers with enhanced power density and compact designs, are further accelerating market expansion. The market is segmented by application (power & utility, automotive, IT/telecom, consumer electronics, others) and type (single-phase, three-phase, rectifier current rating above/below 35 Amps). While specific regional data is limited, the Asia Pacific region, with its strong electronics manufacturing base and expanding renewable energy sector, is expected to lead, followed by North America and Europe.
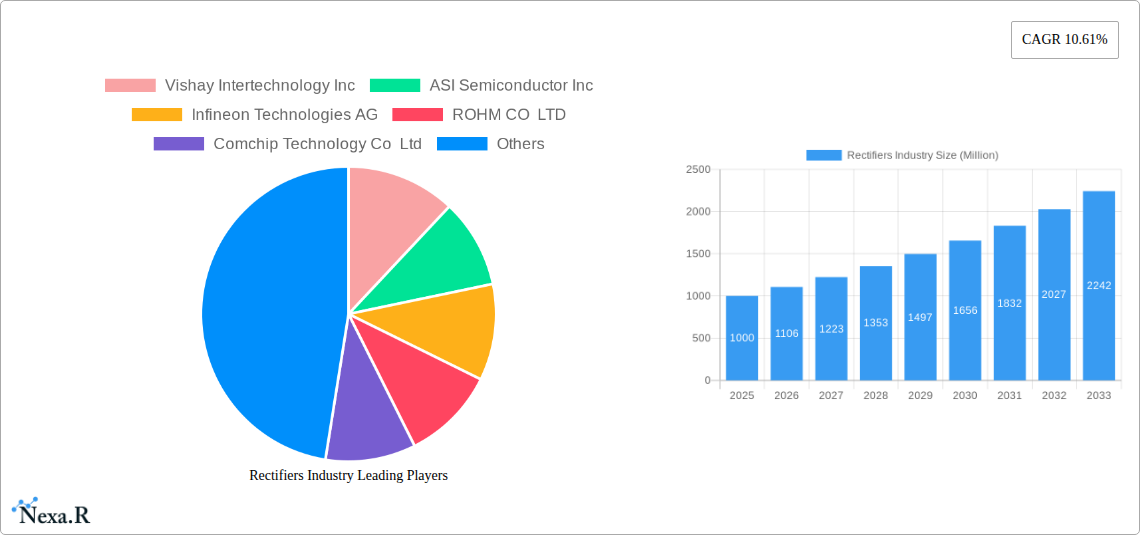
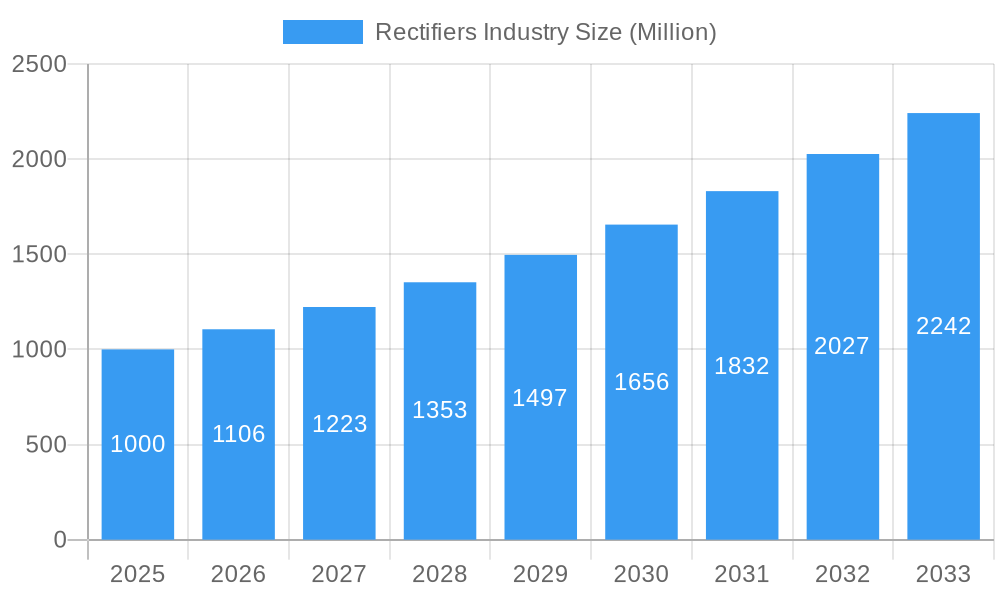
Rectifiers Industry Market Size (In Billion)
Market challenges include the cyclical nature of the semiconductor industry, impacting production and pricing, and fluctuations in raw material costs. Despite these, the long-term outlook remains favorable, supported by ongoing technological advancements and sustained demand. Leading companies such as Vishay Intertechnology, Infineon Technologies, and ROHM are investing in research and development to improve rectifier efficiency and performance, fostering market innovation and investment. The competitive environment, featuring both established and emerging players, drives growth through technological progress and cost optimization. Future market success will depend on continuous innovation to meet evolving power management requirements and adapt to global energy shifts.
Rectifiers Industry Company Market Share
Rectifiers Industry Market Report: 2019-2033
This comprehensive report provides a detailed analysis of the Rectifiers industry, encompassing market dynamics, growth trends, regional performance, competitive landscape, and future outlook. With a study period spanning 2019-2033, a base year of 2025, and a forecast period of 2025-2033, this report is an invaluable resource for industry professionals, investors, and strategic decision-makers. The report covers both parent markets (Semiconductors) and child markets (specific rectifier applications), offering a granular understanding of market segmentation by application (Power & Utility, Automotive, IT/Telecom, Consumer Electronics, Others) and type (Single Phase Rectifier, Three Phase Rectifier, Below 35 Amps, Above 35 Amps).
Rectifiers Industry Market Dynamics & Structure
The global rectifiers market, valued at xx Million units in 2024, exhibits a moderately consolidated structure. Key players like Vishay Intertechnology Inc, ASI Semiconductor Inc, Infineon Technologies AG, ROHM CO LTD, Comchip Technology Co Ltd, Toshiba Corporation, Microchip Technologies, STMicroelectronics, PANJIT International Inc, Diodes Incorporated, Micro Commercial Components (MCC), Semiconductor Components Industries LLC, Vicor Corporation, and SHINDENGEN ELECTRIC MANUFACTURING CO LTD hold significant market share, though the exact distribution is highly dynamic.
- Market Concentration: The market exhibits moderate concentration, with the top 5 players accounting for approximately xx% of the global market share in 2024.
- Technological Innovation: Continuous advancements in semiconductor technology, including the development of high-efficiency, high-power rectifiers and SiC-based devices, are primary drivers of market growth.
- Regulatory Frameworks: Stringent environmental regulations and safety standards, particularly in automotive and power electronics, significantly influence rectifier design and adoption.
- Competitive Product Substitutes: While few direct substitutes exist, alternative power conversion technologies like inverters and DC-DC converters pose some competitive pressure.
- End-User Demographics: Growth is largely driven by increasing demand from the automotive, IT/telecom, and renewable energy sectors.
- M&A Trends: The past five years have witnessed xx M&A deals in the rectifier industry, primarily focused on consolidating market share and accessing new technologies. These deals have primarily involved smaller companies being acquired by larger players.
Rectifiers Industry Growth Trends & Insights
The rectifiers market has witnessed robust growth over the historical period (2019-2024), driven by the increasing adoption of renewable energy sources, the rise of electric vehicles, and the expansion of data centers. The market size exhibited a CAGR of xx% during this period. The forecast period (2025-2033) projects continued growth, albeit at a slightly moderated pace, with a projected CAGR of xx%. This is partly attributable to the maturation of some key segments and increasing competition. The increasing adoption of energy-efficient appliances and the growth of the Internet of Things (IoT) are expected to further boost demand for high-efficiency rectifiers. Technological disruptions, such as the introduction of wide bandgap semiconductors (SiC and GaN), are expected to significantly influence market growth by improving efficiency and power density. Consumer behavior shifts towards sustainable and energy-efficient technologies are also major growth drivers. Market penetration in key application segments like automotive and renewable energy is expected to increase significantly over the forecast period.
Dominant Regions, Countries, or Segments in Rectifiers Industry
North America and Asia-Pacific currently dominate the rectifiers market, accounting for a combined xx% of global revenue in 2024. Within these regions, specific countries such as the US, China, and Japan are particularly important.
By Application:
- Automotive: The automotive segment is the fastest-growing application, driven by the proliferation of electric and hybrid vehicles. Stringent emission norms globally are pushing manufacturers to adopt high-efficiency power systems, which utilize advanced rectifiers.
- Power & Utility: The demand for high-power rectifiers in power transmission and distribution systems, driven by renewable energy integration and grid modernization initiatives, is another significant growth driver.
- IT/Telecom: The growth of data centers and cloud computing infrastructure fuels demand for rectifiers in power supplies for servers and networking equipment.
By Type:
- Three Phase Rectifiers: This segment holds a larger market share than single-phase rectifiers due to its higher power handling capabilities and use in industrial applications.
- Above 35 Amps: High-current rectifiers are in demand due to the need for high-power applications in various segments.
Key drivers for regional dominance include robust economic growth, supportive government policies, and well-established manufacturing infrastructure. However, emerging markets in Southeast Asia and Latin America also present significant growth potential.
Rectifiers Industry Product Landscape
The rectifier market offers a diverse range of products tailored to specific applications, with continuous innovation focused on improving efficiency, power density, and reliability. Key product developments include the adoption of wide bandgap semiconductors (SiC and GaN), which enable higher switching frequencies and reduced energy losses. New designs emphasize smaller form factors, improved thermal management, and increased integration with other power electronics components. These advancements enhance the performance and competitiveness of rectifiers in various applications.
Key Drivers, Barriers & Challenges in Rectifiers Industry
Key Drivers:
- Increasing demand for renewable energy and electric vehicles.
- Growth of data centers and cloud computing.
- Advancements in semiconductor technology.
- Supportive government policies and regulations.
Key Challenges:
- Intense competition from established and emerging players.
- Fluctuations in raw material prices (e.g., silicon).
- Supply chain disruptions impacting production and delivery times.
- Stringent regulatory compliance requirements for certain applications. These add to the cost and complexity of product development and manufacturing.
Emerging Opportunities in Rectifiers Industry
- Growing adoption of renewable energy technologies, including solar and wind power.
- Expansion of the electric vehicle market.
- Development of high-power density rectifiers for aerospace and defense applications.
- Increased demand for smart grids and energy storage systems.
Growth Accelerators in the Rectifiers Industry
Long-term growth will be fueled by technological breakthroughs in wide bandgap semiconductor technology, strategic partnerships between rectifier manufacturers and end-users to develop customized solutions, and expansion into emerging markets. Investments in research and development, coupled with strategic acquisitions, will further accelerate market growth.
Key Players Shaping the Rectifiers Industry Market
- Vishay Intertechnology Inc
- ASI Semiconductor Inc
- Infineon Technologies AG
- ROHM CO LTD
- Comchip Technology Co Ltd
- Toshiba Corporation
- Microchip Technologies
- STMicroelectronics
- PANJIT International Inc
- Diodes Incorporated
- Micro Commercial Components (MCC)
- Semiconductor Components Industries LLC
- Vicor Corporation
- SHINDENGEN ELECTRIC MANUFACTURING CO LTD
Notable Milestones in Rectifiers Industry Sector
- 2020: Introduction of a new generation of SiC-based rectifiers by [Company Name].
- 2022: Acquisition of [Company A] by [Company B], expanding market share and product portfolio.
- 2023: Launch of a high-efficiency rectifier designed for electric vehicle applications. (Specific details dependent on real-world events)
In-Depth Rectifiers Industry Market Outlook
The future of the rectifiers market looks bright, with significant growth potential driven by the aforementioned accelerators. Strategic opportunities exist for companies that can successfully innovate in wide bandgap semiconductor technology, develop cost-effective solutions, and cater to the specific needs of emerging markets and growing applications like electric vehicles and renewable energy. The market is expected to continue its expansion, presenting lucrative opportunities for both established and emerging players alike.
Rectifiers Industry Segmentation
-
1. Type
- 1.1. Single Phase Rectifier
- 1.2. Three Phase Rectifier
-
2. Range
- 2.1. 0.5 - 3.0 Amps
- 2.2. 3.1 - 35 Amps
- 2.3. Above 35 Amps
-
3. Application
- 3.1. Power & Utility
- 3.2. Automotive
- 3.3. IT/Telecom
- 3.4. Consumer Electronics
- 3.5. Others
Rectifiers Industry Segmentation By Geography
- 1. North America
- 2. Europe
- 3. Asia Pacific
- 4. Middle East and Africa
- 5. Latin America
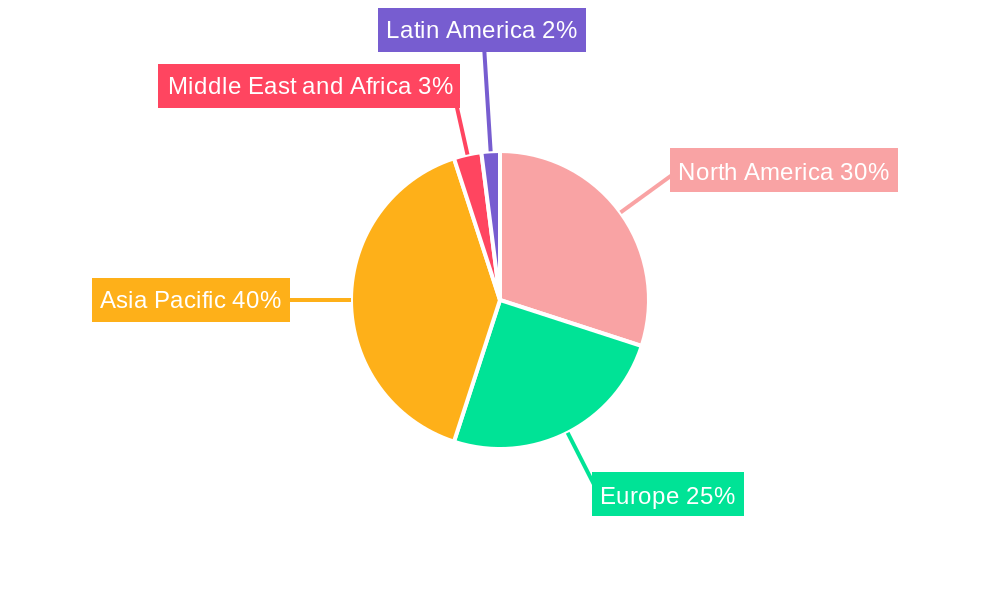
Rectifiers Industry Regional Market Share
Geographic Coverage of Rectifiers Industry
Rectifiers Industry REPORT HIGHLIGHTS
| Aspects | Details |
|---|---|
| Study Period | 2020-2034 |
| Base Year | 2025 |
| Estimated Year | 2026 |
| Forecast Period | 2026-2034 |
| Historical Period | 2020-2025 |
| Growth Rate | CAGR of 4.1% from 2020-2034 |
| Segmentation |
|
Table of Contents
- 1. Introduction
- 1.1. Research Scope
- 1.2. Market Segmentation
- 1.3. Research Objective
- 1.4. Definitions and Assumptions
- 2. Executive Summary
- 2.1. Market Snapshot
- 3. Market Dynamics
- 3.1. Market Drivers
- 3.2. Market Restrains
- 3.3. Market Trends
- 3.4. Market Opportunities
- 4. Market Factor Analysis
- 4.1. Porters Five Forces
- 4.1.1. Bargaining Power of Suppliers
- 4.1.2. Bargaining Power of Buyers
- 4.1.3. Threat of New Entrants
- 4.1.4. Threat of Substitutes
- 4.1.5. Competitive Rivalry
- 4.2. PESTEL analysis
- 4.3. BCG Analysis
- 4.3.1. Stars (High Growth, High Market Share)
- 4.3.2. Cash Cows (Low Growth, High Market Share)
- 4.3.3. Question Mark (High Growth, Low Market Share)
- 4.3.4. Dogs (Low Growth, Low Market Share)
- 4.4. Ansoff Matrix Analysis
- 4.5. Supply Chain Analysis
- 4.6. Regulatory Landscape
- 4.7. Current Market Potential and Opportunity Assessment (TAM–SAM–SOM Framework)
- 4.8. NRP Analyst Note
- 4.1. Porters Five Forces
- 5. Market Analysis, Insights and Forecast 2021-2033
- 5.1. Market Analysis, Insights and Forecast - by Type
- 5.1.1. Single Phase Rectifier
- 5.1.2. Three Phase Rectifier
- 5.2. Market Analysis, Insights and Forecast - by Range
- 5.2.1. 0.5 - 3.0 Amps
- 5.2.2. 3.1 - 35 Amps
- 5.2.3. Above 35 Amps
- 5.3. Market Analysis, Insights and Forecast - by Application
- 5.3.1. Power & Utility
- 5.3.2. Automotive
- 5.3.3. IT/Telecom
- 5.3.4. Consumer Electronics
- 5.3.5. Others
- 5.4. Market Analysis, Insights and Forecast - by Region
- 5.4.1. North America
- 5.4.2. Europe
- 5.4.3. Asia Pacific
- 5.4.4. Middle East and Africa
- 5.4.5. Latin America
- 5.1. Market Analysis, Insights and Forecast - by Type
- 6. Global Rectifiers Industry Analysis, Insights and Forecast, 2021-2033
- 6.1. Market Analysis, Insights and Forecast - by Type
- 6.1.1. Single Phase Rectifier
- 6.1.2. Three Phase Rectifier
- 6.2. Market Analysis, Insights and Forecast - by Range
- 6.2.1. 0.5 - 3.0 Amps
- 6.2.2. 3.1 - 35 Amps
- 6.2.3. Above 35 Amps
- 6.3. Market Analysis, Insights and Forecast - by Application
- 6.3.1. Power & Utility
- 6.3.2. Automotive
- 6.3.3. IT/Telecom
- 6.3.4. Consumer Electronics
- 6.3.5. Others
- 6.1. Market Analysis, Insights and Forecast - by Type
- 7. North America Rectifiers Industry Analysis, Insights and Forecast, 2020-2032
- 7.1. Market Analysis, Insights and Forecast - by Type
- 7.1.1. Single Phase Rectifier
- 7.1.2. Three Phase Rectifier
- 7.2. Market Analysis, Insights and Forecast - by Range
- 7.2.1. 0.5 - 3.0 Amps
- 7.2.2. 3.1 - 35 Amps
- 7.2.3. Above 35 Amps
- 7.3. Market Analysis, Insights and Forecast - by Application
- 7.3.1. Power & Utility
- 7.3.2. Automotive
- 7.3.3. IT/Telecom
- 7.3.4. Consumer Electronics
- 7.3.5. Others
- 7.1. Market Analysis, Insights and Forecast - by Type
- 8. Europe Rectifiers Industry Analysis, Insights and Forecast, 2020-2032
- 8.1. Market Analysis, Insights and Forecast - by Type
- 8.1.1. Single Phase Rectifier
- 8.1.2. Three Phase Rectifier
- 8.2. Market Analysis, Insights and Forecast - by Range
- 8.2.1. 0.5 - 3.0 Amps
- 8.2.2. 3.1 - 35 Amps
- 8.2.3. Above 35 Amps
- 8.3. Market Analysis, Insights and Forecast - by Application
- 8.3.1. Power & Utility
- 8.3.2. Automotive
- 8.3.3. IT/Telecom
- 8.3.4. Consumer Electronics
- 8.3.5. Others
- 8.1. Market Analysis, Insights and Forecast - by Type
- 9. Asia Pacific Rectifiers Industry Analysis, Insights and Forecast, 2020-2032
- 9.1. Market Analysis, Insights and Forecast - by Type
- 9.1.1. Single Phase Rectifier
- 9.1.2. Three Phase Rectifier
- 9.2. Market Analysis, Insights and Forecast - by Range
- 9.2.1. 0.5 - 3.0 Amps
- 9.2.2. 3.1 - 35 Amps
- 9.2.3. Above 35 Amps
- 9.3. Market Analysis, Insights and Forecast - by Application
- 9.3.1. Power & Utility
- 9.3.2. Automotive
- 9.3.3. IT/Telecom
- 9.3.4. Consumer Electronics
- 9.3.5. Others
- 9.1. Market Analysis, Insights and Forecast - by Type
- 10. Middle East and Africa Rectifiers Industry Analysis, Insights and Forecast, 2020-2032
- 10.1. Market Analysis, Insights and Forecast - by Type
- 10.1.1. Single Phase Rectifier
- 10.1.2. Three Phase Rectifier
- 10.2. Market Analysis, Insights and Forecast - by Range
- 10.2.1. 0.5 - 3.0 Amps
- 10.2.2. 3.1 - 35 Amps
- 10.2.3. Above 35 Amps
- 10.3. Market Analysis, Insights and Forecast - by Application
- 10.3.1. Power & Utility
- 10.3.2. Automotive
- 10.3.3. IT/Telecom
- 10.3.4. Consumer Electronics
- 10.3.5. Others
- 10.1. Market Analysis, Insights and Forecast - by Type
- 11. Latin America Rectifiers Industry Analysis, Insights and Forecast, 2020-2032
- 11.1. Market Analysis, Insights and Forecast - by Type
- 11.1.1. Single Phase Rectifier
- 11.1.2. Three Phase Rectifier
- 11.2. Market Analysis, Insights and Forecast - by Range
- 11.2.1. 0.5 - 3.0 Amps
- 11.2.2. 3.1 - 35 Amps
- 11.2.3. Above 35 Amps
- 11.3. Market Analysis, Insights and Forecast - by Application
- 11.3.1. Power & Utility
- 11.3.2. Automotive
- 11.3.3. IT/Telecom
- 11.3.4. Consumer Electronics
- 11.3.5. Others
- 11.1. Market Analysis, Insights and Forecast - by Type
- 12. Competitive Analysis
- 12.1. Company Profiles
- 12.1.1 Vishay Intertechnology Inc
- 12.1.1.1. Company Overview
- 12.1.1.2. Products
- 12.1.1.3. Company Financials
- 12.1.1.4. SWOT Analysis
- 12.1.2 ASI Semiconductor Inc
- 12.1.2.1. Company Overview
- 12.1.2.2. Products
- 12.1.2.3. Company Financials
- 12.1.2.4. SWOT Analysis
- 12.1.3 Infineon Technologies AG
- 12.1.3.1. Company Overview
- 12.1.3.2. Products
- 12.1.3.3. Company Financials
- 12.1.3.4. SWOT Analysis
- 12.1.4 ROHM CO LTD
- 12.1.4.1. Company Overview
- 12.1.4.2. Products
- 12.1.4.3. Company Financials
- 12.1.4.4. SWOT Analysis
- 12.1.5 Comchip Technology Co Ltd
- 12.1.5.1. Company Overview
- 12.1.5.2. Products
- 12.1.5.3. Company Financials
- 12.1.5.4. SWOT Analysis
- 12.1.6 Toshiba Corporation
- 12.1.6.1. Company Overview
- 12.1.6.2. Products
- 12.1.6.3. Company Financials
- 12.1.6.4. SWOT Analysis
- 12.1.7 Microchip Technologies
- 12.1.7.1. Company Overview
- 12.1.7.2. Products
- 12.1.7.3. Company Financials
- 12.1.7.4. SWOT Analysis
- 12.1.8 STMicroelectronics
- 12.1.8.1. Company Overview
- 12.1.8.2. Products
- 12.1.8.3. Company Financials
- 12.1.8.4. SWOT Analysis
- 12.1.9 PANJIT International Inc
- 12.1.9.1. Company Overview
- 12.1.9.2. Products
- 12.1.9.3. Company Financials
- 12.1.9.4. SWOT Analysis
- 12.1.10 Diodes Incorporated
- 12.1.10.1. Company Overview
- 12.1.10.2. Products
- 12.1.10.3. Company Financials
- 12.1.10.4. SWOT Analysis
- 12.1.11 Micro Commercial Components (MCC)
- 12.1.11.1. Company Overview
- 12.1.11.2. Products
- 12.1.11.3. Company Financials
- 12.1.11.4. SWOT Analysis
- 12.1.12 Semiconductor Components Industries LLC*List Not Exhaustive
- 12.1.12.1. Company Overview
- 12.1.12.2. Products
- 12.1.12.3. Company Financials
- 12.1.12.4. SWOT Analysis
- 12.1.13 Semiconductor Components Industries LLC
- 12.1.13.1. Company Overview
- 12.1.13.2. Products
- 12.1.13.3. Company Financials
- 12.1.13.4. SWOT Analysis
- 12.1.14 Vicor Corporation
- 12.1.14.1. Company Overview
- 12.1.14.2. Products
- 12.1.14.3. Company Financials
- 12.1.14.4. SWOT Analysis
- 12.1.15 SHINDENGEN ELECTRIC MANUFACTURING CO LTD
- 12.1.15.1. Company Overview
- 12.1.15.2. Products
- 12.1.15.3. Company Financials
- 12.1.15.4. SWOT Analysis
- 12.1.1 Vishay Intertechnology Inc
- 12.2. Market Entropy
- 12.2.1 Company's Key Areas Served
- 12.2.2 Recent Developments
- 12.3. Company Market Share Analysis 2025
- 12.3.1 Top 5 Companies Market Share Analysis
- 12.3.2 Top 3 Companies Market Share Analysis
- 12.4. List of Potential Customers
- 13. Research Methodology
List of Figures
- Figure 1: Global Rectifiers Industry Revenue Breakdown (billion, %) by Region 2025 & 2033
- Figure 2: North America Rectifiers Industry Revenue (billion), by Type 2025 & 2033
- Figure 3: North America Rectifiers Industry Revenue Share (%), by Type 2025 & 2033
- Figure 4: North America Rectifiers Industry Revenue (billion), by Range 2025 & 2033
- Figure 5: North America Rectifiers Industry Revenue Share (%), by Range 2025 & 2033
- Figure 6: North America Rectifiers Industry Revenue (billion), by Application 2025 & 2033
- Figure 7: North America Rectifiers Industry Revenue Share (%), by Application 2025 & 2033
- Figure 8: North America Rectifiers Industry Revenue (billion), by Country 2025 & 2033
- Figure 9: North America Rectifiers Industry Revenue Share (%), by Country 2025 & 2033
- Figure 10: Europe Rectifiers Industry Revenue (billion), by Type 2025 & 2033
- Figure 11: Europe Rectifiers Industry Revenue Share (%), by Type 2025 & 2033
- Figure 12: Europe Rectifiers Industry Revenue (billion), by Range 2025 & 2033
- Figure 13: Europe Rectifiers Industry Revenue Share (%), by Range 2025 & 2033
- Figure 14: Europe Rectifiers Industry Revenue (billion), by Application 2025 & 2033
- Figure 15: Europe Rectifiers Industry Revenue Share (%), by Application 2025 & 2033
- Figure 16: Europe Rectifiers Industry Revenue (billion), by Country 2025 & 2033
- Figure 17: Europe Rectifiers Industry Revenue Share (%), by Country 2025 & 2033
- Figure 18: Asia Pacific Rectifiers Industry Revenue (billion), by Type 2025 & 2033
- Figure 19: Asia Pacific Rectifiers Industry Revenue Share (%), by Type 2025 & 2033
- Figure 20: Asia Pacific Rectifiers Industry Revenue (billion), by Range 2025 & 2033
- Figure 21: Asia Pacific Rectifiers Industry Revenue Share (%), by Range 2025 & 2033
- Figure 22: Asia Pacific Rectifiers Industry Revenue (billion), by Application 2025 & 2033
- Figure 23: Asia Pacific Rectifiers Industry Revenue Share (%), by Application 2025 & 2033
- Figure 24: Asia Pacific Rectifiers Industry Revenue (billion), by Country 2025 & 2033
- Figure 25: Asia Pacific Rectifiers Industry Revenue Share (%), by Country 2025 & 2033
- Figure 26: Middle East and Africa Rectifiers Industry Revenue (billion), by Type 2025 & 2033
- Figure 27: Middle East and Africa Rectifiers Industry Revenue Share (%), by Type 2025 & 2033
- Figure 28: Middle East and Africa Rectifiers Industry Revenue (billion), by Range 2025 & 2033
- Figure 29: Middle East and Africa Rectifiers Industry Revenue Share (%), by Range 2025 & 2033
- Figure 30: Middle East and Africa Rectifiers Industry Revenue (billion), by Application 2025 & 2033
- Figure 31: Middle East and Africa Rectifiers Industry Revenue Share (%), by Application 2025 & 2033
- Figure 32: Middle East and Africa Rectifiers Industry Revenue (billion), by Country 2025 & 2033
- Figure 33: Middle East and Africa Rectifiers Industry Revenue Share (%), by Country 2025 & 2033
- Figure 34: Latin America Rectifiers Industry Revenue (billion), by Type 2025 & 2033
- Figure 35: Latin America Rectifiers Industry Revenue Share (%), by Type 2025 & 2033
- Figure 36: Latin America Rectifiers Industry Revenue (billion), by Range 2025 & 2033
- Figure 37: Latin America Rectifiers Industry Revenue Share (%), by Range 2025 & 2033
- Figure 38: Latin America Rectifiers Industry Revenue (billion), by Application 2025 & 2033
- Figure 39: Latin America Rectifiers Industry Revenue Share (%), by Application 2025 & 2033
- Figure 40: Latin America Rectifiers Industry Revenue (billion), by Country 2025 & 2033
- Figure 41: Latin America Rectifiers Industry Revenue Share (%), by Country 2025 & 2033
List of Tables
- Table 1: Global Rectifiers Industry Revenue billion Forecast, by Type 2020 & 2033
- Table 2: Global Rectifiers Industry Revenue billion Forecast, by Range 2020 & 2033
- Table 3: Global Rectifiers Industry Revenue billion Forecast, by Application 2020 & 2033
- Table 4: Global Rectifiers Industry Revenue billion Forecast, by Region 2020 & 2033
- Table 5: Global Rectifiers Industry Revenue billion Forecast, by Type 2020 & 2033
- Table 6: Global Rectifiers Industry Revenue billion Forecast, by Range 2020 & 2033
- Table 7: Global Rectifiers Industry Revenue billion Forecast, by Application 2020 & 2033
- Table 8: Global Rectifiers Industry Revenue billion Forecast, by Country 2020 & 2033
- Table 9: Global Rectifiers Industry Revenue billion Forecast, by Type 2020 & 2033
- Table 10: Global Rectifiers Industry Revenue billion Forecast, by Range 2020 & 2033
- Table 11: Global Rectifiers Industry Revenue billion Forecast, by Application 2020 & 2033
- Table 12: Global Rectifiers Industry Revenue billion Forecast, by Country 2020 & 2033
- Table 13: Global Rectifiers Industry Revenue billion Forecast, by Type 2020 & 2033
- Table 14: Global Rectifiers Industry Revenue billion Forecast, by Range 2020 & 2033
- Table 15: Global Rectifiers Industry Revenue billion Forecast, by Application 2020 & 2033
- Table 16: Global Rectifiers Industry Revenue billion Forecast, by Country 2020 & 2033
- Table 17: Global Rectifiers Industry Revenue billion Forecast, by Type 2020 & 2033
- Table 18: Global Rectifiers Industry Revenue billion Forecast, by Range 2020 & 2033
- Table 19: Global Rectifiers Industry Revenue billion Forecast, by Application 2020 & 2033
- Table 20: Global Rectifiers Industry Revenue billion Forecast, by Country 2020 & 2033
- Table 21: Global Rectifiers Industry Revenue billion Forecast, by Type 2020 & 2033
- Table 22: Global Rectifiers Industry Revenue billion Forecast, by Range 2020 & 2033
- Table 23: Global Rectifiers Industry Revenue billion Forecast, by Application 2020 & 2033
- Table 24: Global Rectifiers Industry Revenue billion Forecast, by Country 2020 & 2033
Frequently Asked Questions
1. What is the projected Compound Annual Growth Rate (CAGR) of the Rectifiers Industry?
The projected CAGR is approximately 4.1%.
2. Which companies are prominent players in the Rectifiers Industry?
Key companies in the market include Vishay Intertechnology Inc, ASI Semiconductor Inc, Infineon Technologies AG, ROHM CO LTD, Comchip Technology Co Ltd, Toshiba Corporation, Microchip Technologies, STMicroelectronics, PANJIT International Inc, Diodes Incorporated, Micro Commercial Components (MCC), Semiconductor Components Industries LLC*List Not Exhaustive, Semiconductor Components Industries LLC, Vicor Corporation, SHINDENGEN ELECTRIC MANUFACTURING CO LTD.
3. What are the main segments of the Rectifiers Industry?
The market segments include Type, Range, Application.
4. Can you provide details about the market size?
The market size is estimated to be USD 2.36 billion as of 2022.
5. What are some drivers contributing to market growth?
Increase in Demand For Rectifier Diodes for Various Applications in the Automotive Sector; Growth in Deployment of Smart Grids Across the Developing Countries.
6. What are the notable trends driving market growth?
Automotive Segment to Hold Significant Market Share.
7. Are there any restraints impacting market growth?
Affect in Supply Chain Distribution Due to Covid-19 Pandemic.
8. Can you provide examples of recent developments in the market?
N/A
9. What pricing options are available for accessing the report?
Pricing options include single-user, multi-user, and enterprise licenses priced at USD 4750, USD 5250, and USD 8750 respectively.
10. Is the market size provided in terms of value or volume?
The market size is provided in terms of value, measured in billion.
11. Are there any specific market keywords associated with the report?
Yes, the market keyword associated with the report is "Rectifiers Industry," which aids in identifying and referencing the specific market segment covered.
12. How do I determine which pricing option suits my needs best?
The pricing options vary based on user requirements and access needs. Individual users may opt for single-user licenses, while businesses requiring broader access may choose multi-user or enterprise licenses for cost-effective access to the report.
13. Are there any additional resources or data provided in the Rectifiers Industry report?
While the report offers comprehensive insights, it's advisable to review the specific contents or supplementary materials provided to ascertain if additional resources or data are available.
14. How can I stay updated on further developments or reports in the Rectifiers Industry?
To stay informed about further developments, trends, and reports in the Rectifiers Industry, consider subscribing to industry newsletters, following relevant companies and organizations, or regularly checking reputable industry news sources and publications.
Methodology
Step 1 - Identification of Relevant Samples Size from Population Database


Step 2 - Approaches for Defining Global Market Size (Value, Volume* & Price*)

Note*: In applicable scenarios
Step 3 - Data Sources
Primary Research
- Web Analytics
- Survey Reports
- Research Institute
- Latest Research Reports
- Opinion Leaders
Secondary Research
- Annual Reports
- White Paper
- Latest Press Release
- Industry Association
- Paid Database
- Investor Presentations

Step 4 - Data Triangulation
Involves using different sources of information in order to increase the validity of a study
These sources are likely to be stakeholders in a program - participants, other researchers, program staff, other community members, and so on.
Then we put all data in single framework & apply various statistical tools to find out the dynamic on the market.
During the analysis stage, feedback from the stakeholder groups would be compared to determine areas of agreement as well as areas of divergence