

Key Insights
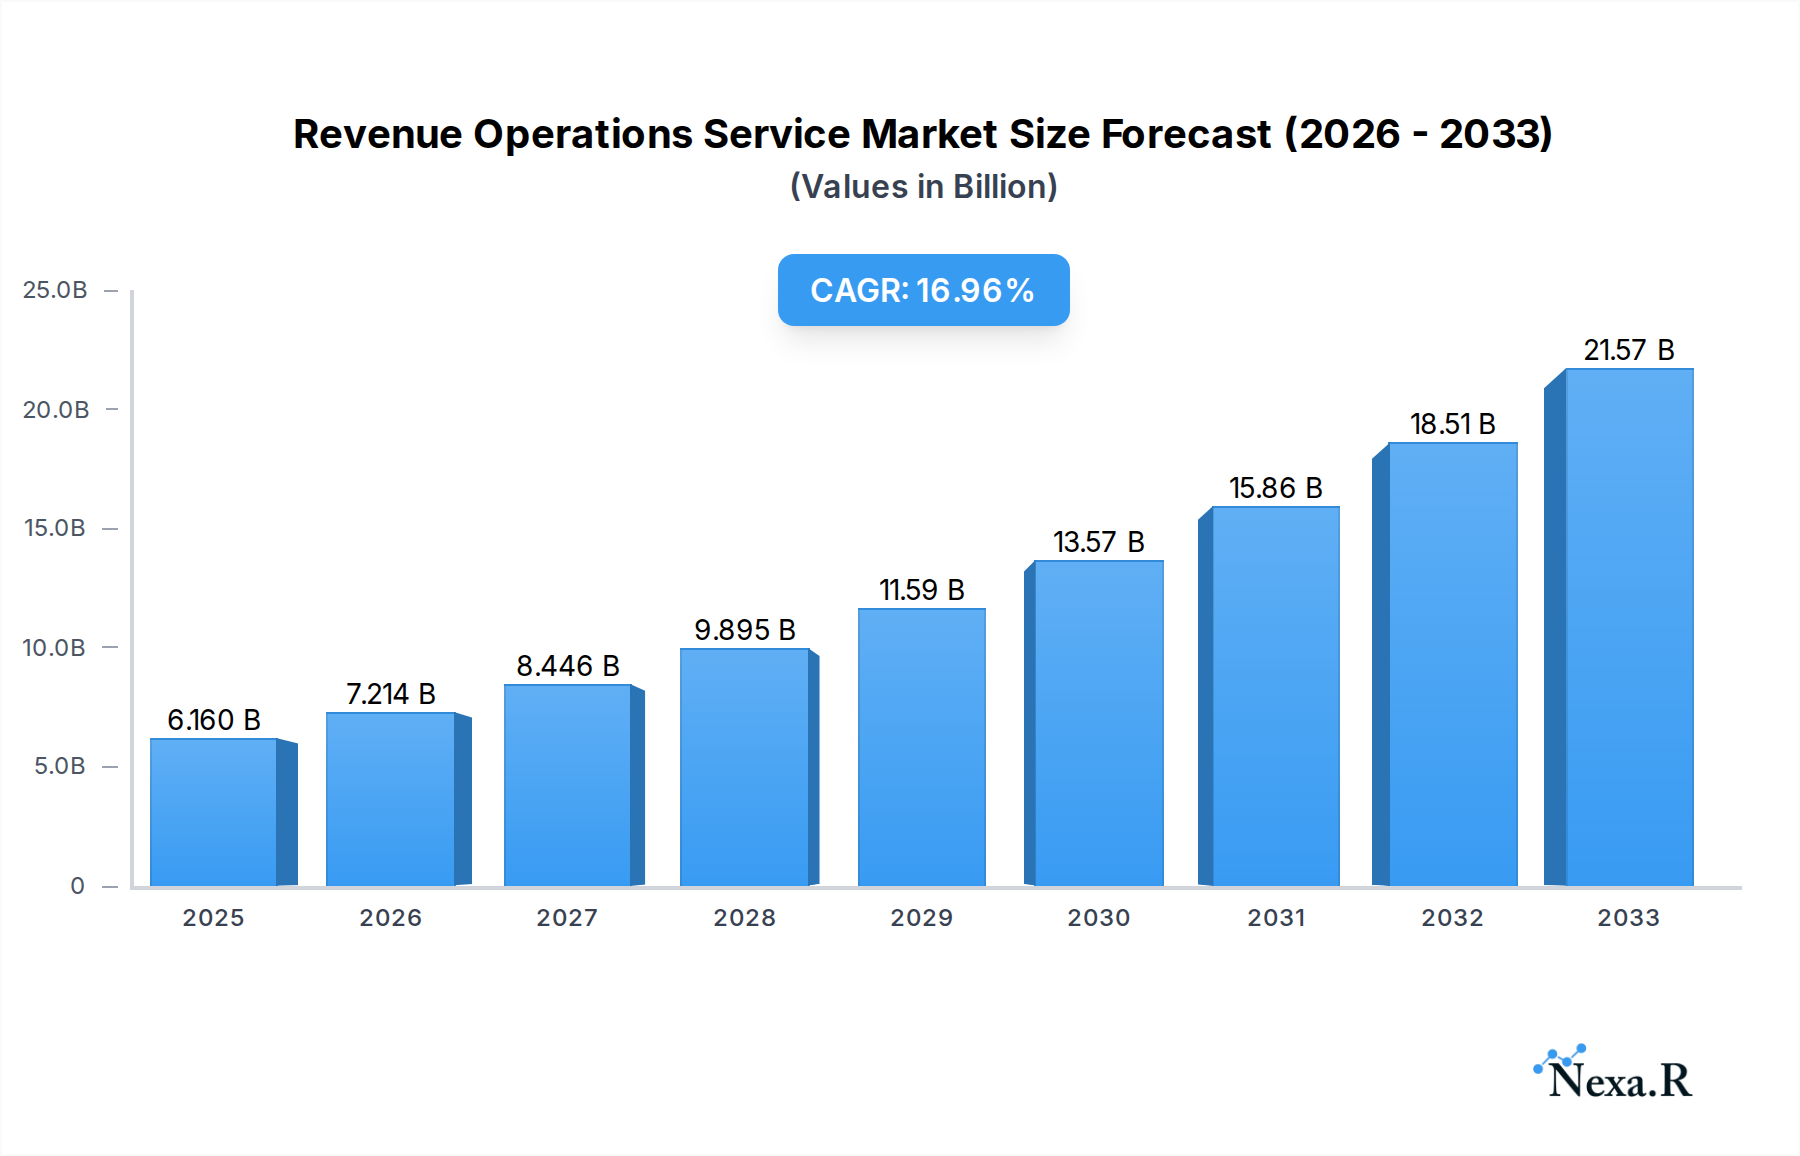
The Revenue Operations (RevOps) Service market is poised for significant expansion, projected to reach $6.16 billion by 2025. This robust growth is fueled by an impressive Compound Annual Growth Rate (CAGR) of 17.16% throughout the forecast period from 2019 to 2033. The escalating complexity of the buyer's journey, coupled with the increasing demand for seamless customer experiences across sales, marketing, and service departments, are primary market drivers. Businesses are increasingly recognizing the strategic imperative of aligning these functions to optimize revenue generation and enhance customer retention. This convergence is essential for breaking down operational silos, improving data visibility, and enabling proactive decision-making, all of which are critical in today's competitive landscape.

Revenue Operations Service Market Size (In Billion)
The market segmentation reveals a strong demand across both Large Enterprises and Small and Medium-sized Enterprises (SMEs), indicating the universal applicability of RevOps principles. The primary applications of RevOps services lie within Sales Operations, Services Operations, and Marketing Operations, highlighting the comprehensive nature of this discipline. Emerging trends include the widespread adoption of AI and machine learning for predictive analytics, hyper-personalization of customer interactions, and the development of integrated technology stacks. However, the market faces certain restraints, such as the initial cost of implementation, a shortage of skilled RevOps professionals, and the challenge of integrating disparate legacy systems. Key players are actively innovating to address these challenges, offering comprehensive solutions and strategic guidance to facilitate smoother RevOps adoption and maximize its benefits.
Revenue Operations Service Company Market Share
Revenue Operations Service Market: Comprehensive Report & Analysis (2019-2033)
This comprehensive report offers an in-depth analysis of the global Revenue Operations Service market, providing critical insights into its dynamics, growth trajectory, and future outlook. With a study period spanning from 2019 to 2033, and a base year of 2025, this report delves into market size evolution, key drivers, prominent segments, and the competitive landscape. It is an essential resource for industry professionals seeking to understand and capitalize on the burgeoning opportunities within the Revenue Operations Service sector.
Revenue Operations Service Market Dynamics & Structure
The Revenue Operations Service market is characterized by a moderately consolidated structure, driven by increasing demand for integrated solutions that streamline sales, marketing, and customer success operations. Technological innovation remains a primary catalyst, with advancements in AI, machine learning, and data analytics enabling sophisticated revenue forecasting, pipeline management, and customer journey optimization. Regulatory frameworks, while not overtly restrictive, are evolving to emphasize data privacy and compliance, influencing service providers to adopt robust security measures. Competitive product substitutes, primarily in the form of standalone sales automation or marketing automation tools, are increasingly being superseded by holistic RevOps platforms. End-user demographics are shifting, with both Large Enterprises and SMEs recognizing the strategic imperative of RevOps for sustainable growth. Merger and Acquisition (M&A) trends are actively shaping the market, with a notable increase in deal volumes as larger players consolidate capabilities and smaller, innovative firms seek strategic partnerships for market access.
- Market Concentration: Moderately consolidated, with key players vying for market share through specialized offerings and integrated solutions.
- Technological Innovation Drivers: AI-powered analytics, predictive modeling, automation of repetitive tasks, and advanced CRM integrations.
- Regulatory Frameworks: Emphasis on data security, privacy (e.g., GDPR, CCPA), and ethical data utilization.
- Competitive Product Substitutes: Standalone CRM, sales enablement, marketing automation, and customer service platforms are increasingly integrated into RevOps.
- End-User Demographics: Growing adoption across Large Enterprises and SMEs seeking efficiency and predictable revenue growth.
- M&A Trends: Increasing consolidation and strategic acquisitions to enhance service portfolios and expand market reach.
Revenue Operations Service Growth Trends & Insights
The global Revenue Operations Service market is poised for robust expansion, projected to reach an estimated $xx billion in 2025, with a Compound Annual Growth Rate (CAGR) of xx% during the forecast period of 2025–2033. This significant growth is fueled by an increasing awareness among businesses of all sizes about the tangible benefits of aligning their revenue-generating functions. Historically, from 2019 to 2024, the market witnessed steady adoption as companies began to understand the limitations of siloed operations. The base year of 2025 marks a pivotal point where RevOps services are transitioning from a niche offering to a mainstream business strategy. Adoption rates are accelerating, particularly among SMEs, who are increasingly seeking cost-effective solutions to optimize their limited resources for maximum revenue impact. Technological disruptions are at the forefront of this growth. The integration of AI and machine learning into RevOps platforms is enabling unprecedented levels of predictive analytics, allowing businesses to forecast sales with greater accuracy, identify at-risk deals, and personalize customer outreach at scale. Furthermore, the increasing sophistication of marketing automation tools, coupled with advanced sales enablement platforms, is creating a seamless customer journey from initial touchpoint to post-sale engagement.
Consumer behavior shifts are also playing a crucial role. Today's B2B buyers expect a highly personalized and consistent experience across all touchpoints. RevOps services enable businesses to deliver this by unifying customer data, ensuring that sales, marketing, and customer success teams have a complete and up-to-date view of each prospect and customer. This leads to more effective engagement, higher conversion rates, and improved customer retention. The market penetration of RevOps services, while still having significant room for growth, is expanding rapidly as more organizations realize the ROI associated with streamlined processes, reduced operational costs, and increased revenue predictability. The historical period (2019-2024) laid the groundwork, demonstrating the efficacy of RevOps principles. The forecast period (2025-2033) will see widespread implementation, driven by the tangible business outcomes and competitive advantages that a mature RevOps strategy provides. The interplay of technological advancements and evolving customer expectations is creating a fertile ground for sustained and accelerated growth in the Revenue Operations Service market, projected to reach $xx billion by 2033.
Dominant Regions, Countries, or Segments in Revenue Operations Service
The North American region is currently the dominant force in the global Revenue Operations Service market, driven by a highly developed business ecosystem, a strong culture of technological adoption, and a significant presence of Large Enterprises and SMEs actively seeking to optimize their revenue generation strategies. The United States, in particular, accounts for a substantial share of this dominance, benefiting from a mature venture capital landscape that fuels innovation and the rapid scaling of RevOps service providers. The emphasis on data-driven decision-making and the pursuit of operational efficiency are deeply ingrained in the American business ethos, making RevOps a strategic imperative rather than a mere trend. The robust presence of leading technology companies and a highly skilled workforce further bolster this leadership. The market share within North America is heavily influenced by the application of RevOps services in both Large Enterprises and SMEs, with the latter increasingly leveraging RevOps to compete effectively against larger counterparts.
The types of services driving growth within this dominant region are primarily Sales Operations and Marketing Operations, which are foundational to revenue generation. However, Services Operations is rapidly gaining traction as businesses recognize the importance of customer success and recurring revenue models. The economic policies in North America have historically favored innovation and business growth, with government initiatives and tax incentives often supporting technology adoption. The well-established infrastructure, encompassing advanced digital connectivity and a sophisticated financial services sector, further facilitates the growth and scalability of RevOps service providers and their clients. The competitive landscape within North America is dynamic, with a mix of established players and agile startups constantly pushing the boundaries of what RevOps can achieve. The growth potential in this region remains immense, as many organizations are still in the process of maturing their RevOps strategies, indicating a sustained demand for specialized services.
Across other regions, Europe exhibits strong growth potential, driven by increasing digital transformation initiatives and a growing recognition of RevOps benefits, particularly in countries like the UK, Germany, and France. Asia-Pacific is emerging as a rapidly growing market, fueled by the burgeoning tech startup scene in countries like India and Singapore, and the increasing adoption of advanced sales and marketing technologies by businesses across the region. The market share of Services Operations is expected to see significant expansion globally as the subscription economy matures and customer retention becomes a paramount concern for businesses.
- Dominant Region: North America, led by the United States.
- Key Drivers in North America: Strong technological adoption, presence of Large Enterprises and SMEs, data-driven business culture, robust VC funding, skilled workforce.
- Application Dominance: Significant adoption by both Large Enterprises and SMEs.
- Type Dominance: Sales Operations and Marketing Operations are leading, with Services Operations showing accelerated growth.
- Economic Policies & Infrastructure: Favorable business policies, advanced digital infrastructure, and strong financial services sector.
- Growth Potential: High, with many organizations still optimizing their RevOps maturity.
Revenue Operations Service Product Landscape
The Revenue Operations Service product landscape is characterized by a continuous stream of innovations focused on enhancing efficiency, providing actionable insights, and fostering seamless integration across revenue-generating functions. Products now offer sophisticated AI-driven predictive analytics for sales forecasting and pipeline management, enabling businesses to anticipate revenue more accurately and identify potential bottlenecks. Advanced customer data platforms (CDPs) are central to these offerings, unifying disparate data sources to create a single, comprehensive view of the customer journey. Automation capabilities are expanding beyond basic task management to encompass intelligent lead scoring, automated campaign optimization, and proactive customer support interventions. Unique selling propositions revolve around the ability of these services to deliver measurable ROI through increased conversion rates, reduced customer acquisition costs, and improved customer lifetime value. Technological advancements are also emphasizing robust security protocols and compliance features to address growing data privacy concerns.
Key Drivers, Barriers & Challenges in Revenue Operations Service
Key Drivers: The primary forces propelling the Revenue Operations Service market are the escalating demand for operational efficiency across sales, marketing, and customer success departments. Technological advancements, particularly in AI and data analytics, are enabling more sophisticated forecasting and personalized customer engagement, which are critical for business growth. The increasing complexity of the B2B buyer journey necessitates a unified approach to customer experience, which RevOps services provide. Furthermore, the pressure to achieve predictable revenue growth in competitive markets is a significant motivator for businesses to adopt RevOps strategies.
Barriers & Challenges: Key challenges include the initial investment and perceived complexity of implementing integrated RevOps solutions, especially for smaller businesses. Resistance to change within organizations and the difficulty in finding skilled RevOps professionals can also hinder adoption. Supply chain issues are less directly relevant to services, but the reliance on integrated software platforms means that disruptions in the tech ecosystem can indirectly impact service delivery. Regulatory hurdles related to data privacy and compliance, while driving the need for robust RevOps, can also add complexity to service implementation. Finally, intense competitive pressures from both specialized service providers and in-house solutions demand continuous innovation and demonstrable value.
Emerging Opportunities in Revenue Operations Service
Emerging opportunities in the Revenue Operations Service sector are largely centered around the deeper integration of AI and machine learning to provide hyper-personalized customer experiences and predictive revenue management. Untapped markets include the mid-market segment in developing economies, where businesses are increasingly digitalizing and seeking to professionalize their sales and marketing operations. Innovative applications are emerging in the realm of customer success analytics, focusing on proactive churn prediction and revenue expansion opportunities within existing customer bases. Evolving consumer preferences for seamless, omnichannel interactions are driving demand for RevOps solutions that can orchestrate customer journeys across all touchpoints, from initial marketing engagement to post-sales support and loyalty programs.
Growth Accelerators in the Revenue Operations Service Industry
Several catalysts are accelerating long-term growth in the Revenue Operations Service industry. Technological breakthroughs in areas like natural language processing (NLP) for sales call analysis and sentiment analysis for customer feedback are enhancing the intelligence of RevOps platforms. Strategic partnerships between RevOps service providers, CRM vendors, and marketing automation companies are creating more comprehensive and integrated solutions, offering greater value to clients. Market expansion strategies, including targeting new industry verticals and geographical regions with tailored RevOps offerings, are also driving growth. The increasing availability of data analytics talent and the development of standardized RevOps frameworks are further professionalizing the industry and making it more accessible to a wider range of businesses.
Key Players Shaping the Revenue Operations Service Market
- Alexander Group
- Centric Consulting
- Winning by Design
- Go Nimbly
- LeadMD
- Atomic Revenue
- New Breed
- Altus Alliance
- CloudKettle
- MASS Engines
- Process Pro Consulting
- Iceberg RevOps
Notable Milestones in Revenue Operations Service Sector
- 2019: Increased focus on integrating Sales and Marketing Operations, leading to the formalization of the RevOps concept.
- 2020: Accelerated adoption of digital sales and marketing tools due to the global pandemic, highlighting the need for integrated revenue operations.
- 2021: Rise of AI and machine learning applications in RevOps for predictive analytics and customer journey optimization.
- 2022: Growing demand for specialized Services Operations for customer success and retention, especially in SaaS models.
- 2023: Increased M&A activity as larger consulting firms and technology providers acquire niche RevOps specialists.
- 2024: Maturation of RevOps platforms with advanced automation and seamless integration capabilities across the entire revenue funnel.
In-Depth Revenue Operations Service Market Outlook
The future outlook for the Revenue Operations Service market is exceptionally bright, driven by a sustained demand for predictable revenue growth and enhanced operational efficiency. Growth accelerators, including the continuous evolution of AI for predictive insights and hyper-personalization, alongside strategic partnerships that deliver end-to-end revenue solutions, will be critical. The increasing adoption across SMEs, coupled with the expansion into emerging economies, presents significant untapped market potential. As businesses increasingly prioritize customer lifetime value and seamless customer journeys, the role of integrated RevOps strategies will become indispensable, positioning the market for continued robust expansion and innovation.
Revenue Operations Service Segmentation
-
1. Application
- 1.1. Large Enterprises
- 1.2. SMEs
-
2. Types
- 2.1. Sales Operations
- 2.2. Services Operations
- 2.3. Marketing Operations
Revenue Operations Service Segmentation By Geography
-
1. North America
- 1.1. United States
- 1.2. Canada
- 1.3. Mexico
-
2. South America
- 2.1. Brazil
- 2.2. Argentina
- 2.3. Rest of South America
-
3. Europe
- 3.1. United Kingdom
- 3.2. Germany
- 3.3. France
- 3.4. Italy
- 3.5. Spain
- 3.6. Russia
- 3.7. Benelux
- 3.8. Nordics
- 3.9. Rest of Europe
-
4. Middle East & Africa
- 4.1. Turkey
- 4.2. Israel
- 4.3. GCC
- 4.4. North Africa
- 4.5. South Africa
- 4.6. Rest of Middle East & Africa
-
5. Asia Pacific
- 5.1. China
- 5.2. India
- 5.3. Japan
- 5.4. South Korea
- 5.5. ASEAN
- 5.6. Oceania
- 5.7. Rest of Asia Pacific
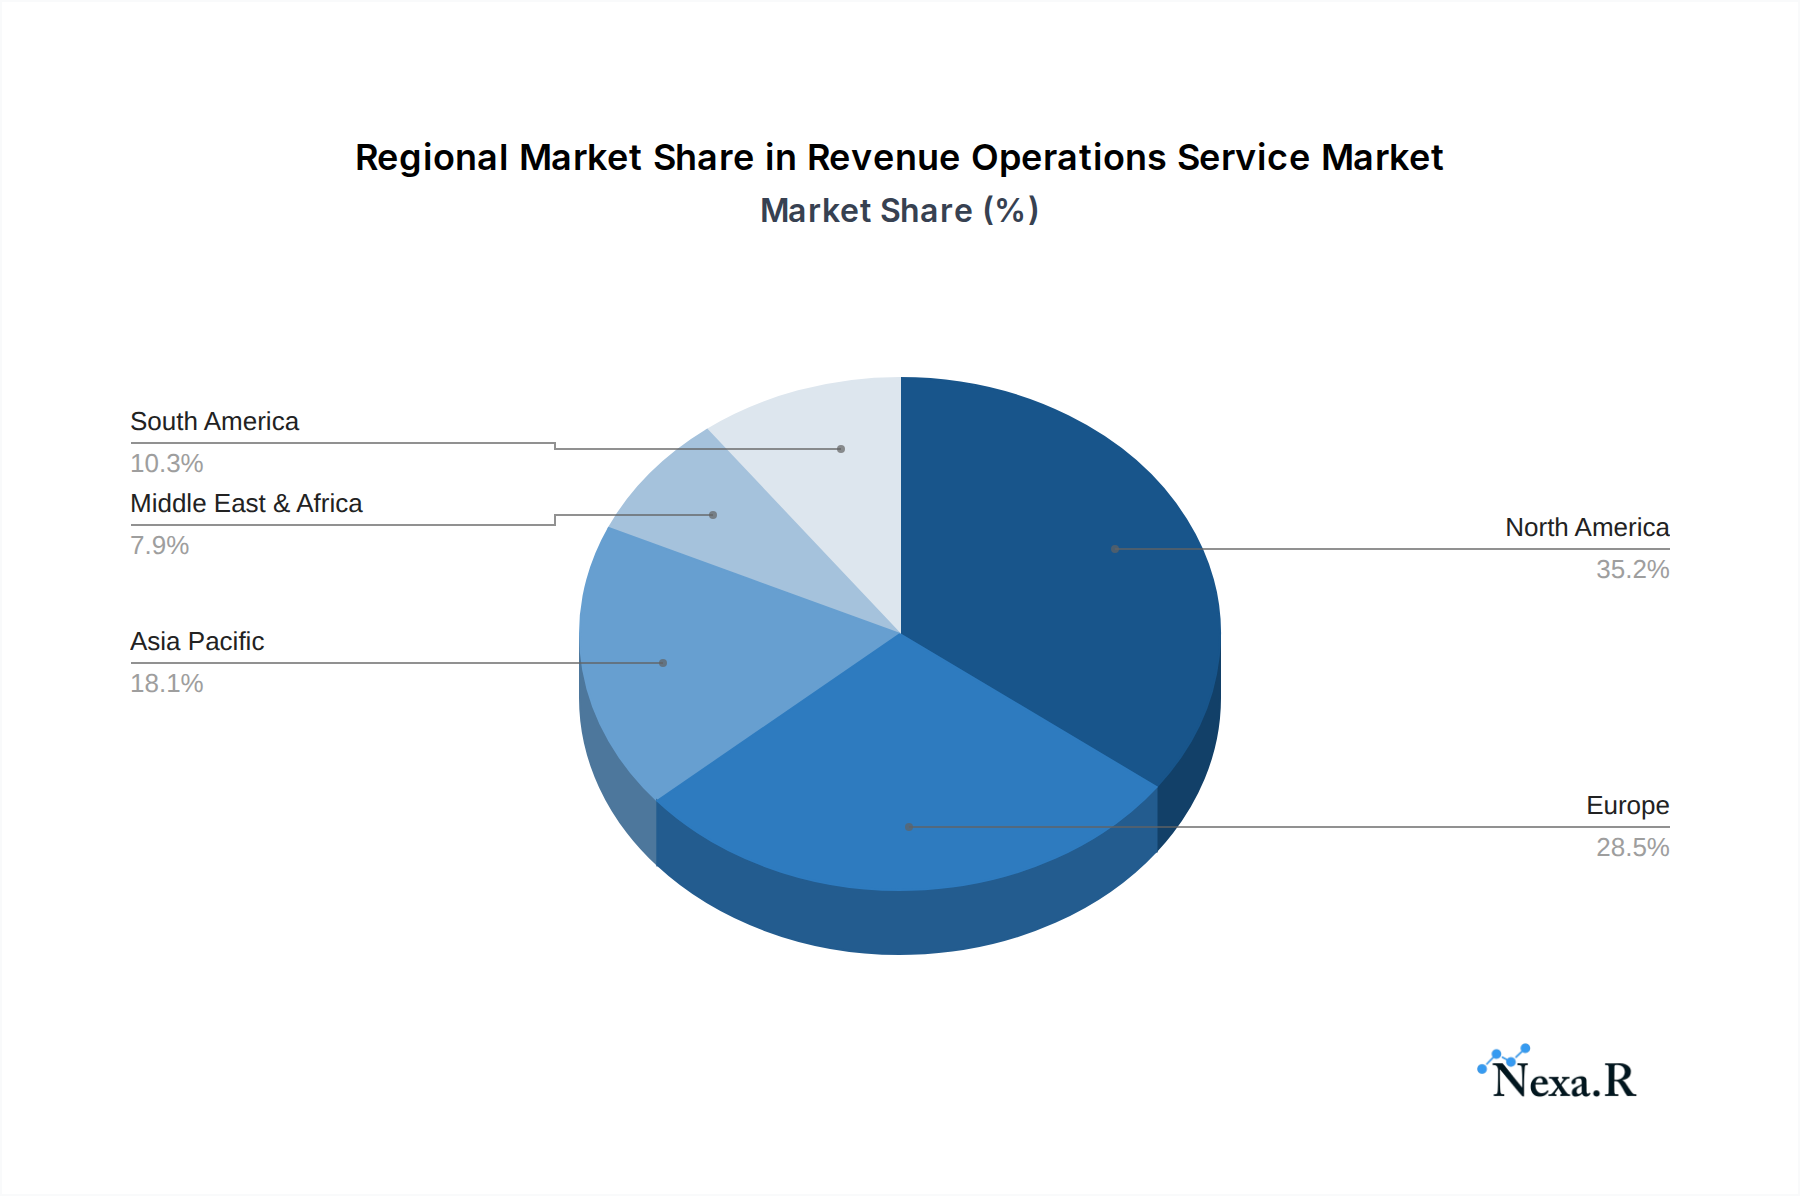
Revenue Operations Service Regional Market Share
Geographic Coverage of Revenue Operations Service
Revenue Operations Service REPORT HIGHLIGHTS
| Aspects | Details |
|---|---|
| Study Period | 2020-2034 |
| Base Year | 2025 |
| Estimated Year | 2026 |
| Forecast Period | 2026-2034 |
| Historical Period | 2020-2025 |
| Growth Rate | CAGR of 17.16% from 2020-2034 |
| Segmentation |
|
Table of Contents
- 1. Introduction
- 1.1. Research Scope
- 1.2. Market Segmentation
- 1.3. Research Methodology
- 1.4. Definitions and Assumptions
- 2. Executive Summary
- 2.1. Introduction
- 3. Market Dynamics
- 3.1. Introduction
- 3.2. Market Drivers
- 3.3. Market Restrains
- 3.4. Market Trends
- 4. Market Factor Analysis
- 4.1. Porters Five Forces
- 4.2. Supply/Value Chain
- 4.3. PESTEL analysis
- 4.4. Market Entropy
- 4.5. Patent/Trademark Analysis
- 5. Global Revenue Operations Service Analysis, Insights and Forecast, 2020-2032
- 5.1. Market Analysis, Insights and Forecast - by Application
- 5.1.1. Large Enterprises
- 5.1.2. SMEs
- 5.2. Market Analysis, Insights and Forecast - by Types
- 5.2.1. Sales Operations
- 5.2.2. Services Operations
- 5.2.3. Marketing Operations
- 5.3. Market Analysis, Insights and Forecast - by Region
- 5.3.1. North America
- 5.3.2. South America
- 5.3.3. Europe
- 5.3.4. Middle East & Africa
- 5.3.5. Asia Pacific
- 5.1. Market Analysis, Insights and Forecast - by Application
- 6. North America Revenue Operations Service Analysis, Insights and Forecast, 2020-2032
- 6.1. Market Analysis, Insights and Forecast - by Application
- 6.1.1. Large Enterprises
- 6.1.2. SMEs
- 6.2. Market Analysis, Insights and Forecast - by Types
- 6.2.1. Sales Operations
- 6.2.2. Services Operations
- 6.2.3. Marketing Operations
- 6.1. Market Analysis, Insights and Forecast - by Application
- 7. South America Revenue Operations Service Analysis, Insights and Forecast, 2020-2032
- 7.1. Market Analysis, Insights and Forecast - by Application
- 7.1.1. Large Enterprises
- 7.1.2. SMEs
- 7.2. Market Analysis, Insights and Forecast - by Types
- 7.2.1. Sales Operations
- 7.2.2. Services Operations
- 7.2.3. Marketing Operations
- 7.1. Market Analysis, Insights and Forecast - by Application
- 8. Europe Revenue Operations Service Analysis, Insights and Forecast, 2020-2032
- 8.1. Market Analysis, Insights and Forecast - by Application
- 8.1.1. Large Enterprises
- 8.1.2. SMEs
- 8.2. Market Analysis, Insights and Forecast - by Types
- 8.2.1. Sales Operations
- 8.2.2. Services Operations
- 8.2.3. Marketing Operations
- 8.1. Market Analysis, Insights and Forecast - by Application
- 9. Middle East & Africa Revenue Operations Service Analysis, Insights and Forecast, 2020-2032
- 9.1. Market Analysis, Insights and Forecast - by Application
- 9.1.1. Large Enterprises
- 9.1.2. SMEs
- 9.2. Market Analysis, Insights and Forecast - by Types
- 9.2.1. Sales Operations
- 9.2.2. Services Operations
- 9.2.3. Marketing Operations
- 9.1. Market Analysis, Insights and Forecast - by Application
- 10. Asia Pacific Revenue Operations Service Analysis, Insights and Forecast, 2020-2032
- 10.1. Market Analysis, Insights and Forecast - by Application
- 10.1.1. Large Enterprises
- 10.1.2. SMEs
- 10.2. Market Analysis, Insights and Forecast - by Types
- 10.2.1. Sales Operations
- 10.2.2. Services Operations
- 10.2.3. Marketing Operations
- 10.1. Market Analysis, Insights and Forecast - by Application
- 11. Competitive Analysis
- 11.1. Global Market Share Analysis 2025
- 11.2. Company Profiles
- 11.2.1 Alexander Group
- 11.2.1.1. Overview
- 11.2.1.2. Products
- 11.2.1.3. SWOT Analysis
- 11.2.1.4. Recent Developments
- 11.2.1.5. Financials (Based on Availability)
- 11.2.2 Centric Consulting
- 11.2.2.1. Overview
- 11.2.2.2. Products
- 11.2.2.3. SWOT Analysis
- 11.2.2.4. Recent Developments
- 11.2.2.5. Financials (Based on Availability)
- 11.2.3 Winning by Design
- 11.2.3.1. Overview
- 11.2.3.2. Products
- 11.2.3.3. SWOT Analysis
- 11.2.3.4. Recent Developments
- 11.2.3.5. Financials (Based on Availability)
- 11.2.4 Go Nimbly
- 11.2.4.1. Overview
- 11.2.4.2. Products
- 11.2.4.3. SWOT Analysis
- 11.2.4.4. Recent Developments
- 11.2.4.5. Financials (Based on Availability)
- 11.2.5 LeadMD
- 11.2.5.1. Overview
- 11.2.5.2. Products
- 11.2.5.3. SWOT Analysis
- 11.2.5.4. Recent Developments
- 11.2.5.5. Financials (Based on Availability)
- 11.2.6 Atomic Revenue
- 11.2.6.1. Overview
- 11.2.6.2. Products
- 11.2.6.3. SWOT Analysis
- 11.2.6.4. Recent Developments
- 11.2.6.5. Financials (Based on Availability)
- 11.2.7 New Breed
- 11.2.7.1. Overview
- 11.2.7.2. Products
- 11.2.7.3. SWOT Analysis
- 11.2.7.4. Recent Developments
- 11.2.7.5. Financials (Based on Availability)
- 11.2.8 Altus Alliance
- 11.2.8.1. Overview
- 11.2.8.2. Products
- 11.2.8.3. SWOT Analysis
- 11.2.8.4. Recent Developments
- 11.2.8.5. Financials (Based on Availability)
- 11.2.9 CloudKettle
- 11.2.9.1. Overview
- 11.2.9.2. Products
- 11.2.9.3. SWOT Analysis
- 11.2.9.4. Recent Developments
- 11.2.9.5. Financials (Based on Availability)
- 11.2.10 MASS Engines
- 11.2.10.1. Overview
- 11.2.10.2. Products
- 11.2.10.3. SWOT Analysis
- 11.2.10.4. Recent Developments
- 11.2.10.5. Financials (Based on Availability)
- 11.2.11 Process Pro Consulting
- 11.2.11.1. Overview
- 11.2.11.2. Products
- 11.2.11.3. SWOT Analysis
- 11.2.11.4. Recent Developments
- 11.2.11.5. Financials (Based on Availability)
- 11.2.12 Iceberg RevOps
- 11.2.12.1. Overview
- 11.2.12.2. Products
- 11.2.12.3. SWOT Analysis
- 11.2.12.4. Recent Developments
- 11.2.12.5. Financials (Based on Availability)
- 11.2.1 Alexander Group
List of Figures
- Figure 1: Global Revenue Operations Service Revenue Breakdown (undefined, %) by Region 2025 & 2033
- Figure 2: North America Revenue Operations Service Revenue (undefined), by Application 2025 & 2033
- Figure 3: North America Revenue Operations Service Revenue Share (%), by Application 2025 & 2033
- Figure 4: North America Revenue Operations Service Revenue (undefined), by Types 2025 & 2033
- Figure 5: North America Revenue Operations Service Revenue Share (%), by Types 2025 & 2033
- Figure 6: North America Revenue Operations Service Revenue (undefined), by Country 2025 & 2033
- Figure 7: North America Revenue Operations Service Revenue Share (%), by Country 2025 & 2033
- Figure 8: South America Revenue Operations Service Revenue (undefined), by Application 2025 & 2033
- Figure 9: South America Revenue Operations Service Revenue Share (%), by Application 2025 & 2033
- Figure 10: South America Revenue Operations Service Revenue (undefined), by Types 2025 & 2033
- Figure 11: South America Revenue Operations Service Revenue Share (%), by Types 2025 & 2033
- Figure 12: South America Revenue Operations Service Revenue (undefined), by Country 2025 & 2033
- Figure 13: South America Revenue Operations Service Revenue Share (%), by Country 2025 & 2033
- Figure 14: Europe Revenue Operations Service Revenue (undefined), by Application 2025 & 2033
- Figure 15: Europe Revenue Operations Service Revenue Share (%), by Application 2025 & 2033
- Figure 16: Europe Revenue Operations Service Revenue (undefined), by Types 2025 & 2033
- Figure 17: Europe Revenue Operations Service Revenue Share (%), by Types 2025 & 2033
- Figure 18: Europe Revenue Operations Service Revenue (undefined), by Country 2025 & 2033
- Figure 19: Europe Revenue Operations Service Revenue Share (%), by Country 2025 & 2033
- Figure 20: Middle East & Africa Revenue Operations Service Revenue (undefined), by Application 2025 & 2033
- Figure 21: Middle East & Africa Revenue Operations Service Revenue Share (%), by Application 2025 & 2033
- Figure 22: Middle East & Africa Revenue Operations Service Revenue (undefined), by Types 2025 & 2033
- Figure 23: Middle East & Africa Revenue Operations Service Revenue Share (%), by Types 2025 & 2033
- Figure 24: Middle East & Africa Revenue Operations Service Revenue (undefined), by Country 2025 & 2033
- Figure 25: Middle East & Africa Revenue Operations Service Revenue Share (%), by Country 2025 & 2033
- Figure 26: Asia Pacific Revenue Operations Service Revenue (undefined), by Application 2025 & 2033
- Figure 27: Asia Pacific Revenue Operations Service Revenue Share (%), by Application 2025 & 2033
- Figure 28: Asia Pacific Revenue Operations Service Revenue (undefined), by Types 2025 & 2033
- Figure 29: Asia Pacific Revenue Operations Service Revenue Share (%), by Types 2025 & 2033
- Figure 30: Asia Pacific Revenue Operations Service Revenue (undefined), by Country 2025 & 2033
- Figure 31: Asia Pacific Revenue Operations Service Revenue Share (%), by Country 2025 & 2033
List of Tables
- Table 1: Global Revenue Operations Service Revenue undefined Forecast, by Application 2020 & 2033
- Table 2: Global Revenue Operations Service Revenue undefined Forecast, by Types 2020 & 2033
- Table 3: Global Revenue Operations Service Revenue undefined Forecast, by Region 2020 & 2033
- Table 4: Global Revenue Operations Service Revenue undefined Forecast, by Application 2020 & 2033
- Table 5: Global Revenue Operations Service Revenue undefined Forecast, by Types 2020 & 2033
- Table 6: Global Revenue Operations Service Revenue undefined Forecast, by Country 2020 & 2033
- Table 7: United States Revenue Operations Service Revenue (undefined) Forecast, by Application 2020 & 2033
- Table 8: Canada Revenue Operations Service Revenue (undefined) Forecast, by Application 2020 & 2033
- Table 9: Mexico Revenue Operations Service Revenue (undefined) Forecast, by Application 2020 & 2033
- Table 10: Global Revenue Operations Service Revenue undefined Forecast, by Application 2020 & 2033
- Table 11: Global Revenue Operations Service Revenue undefined Forecast, by Types 2020 & 2033
- Table 12: Global Revenue Operations Service Revenue undefined Forecast, by Country 2020 & 2033
- Table 13: Brazil Revenue Operations Service Revenue (undefined) Forecast, by Application 2020 & 2033
- Table 14: Argentina Revenue Operations Service Revenue (undefined) Forecast, by Application 2020 & 2033
- Table 15: Rest of South America Revenue Operations Service Revenue (undefined) Forecast, by Application 2020 & 2033
- Table 16: Global Revenue Operations Service Revenue undefined Forecast, by Application 2020 & 2033
- Table 17: Global Revenue Operations Service Revenue undefined Forecast, by Types 2020 & 2033
- Table 18: Global Revenue Operations Service Revenue undefined Forecast, by Country 2020 & 2033
- Table 19: United Kingdom Revenue Operations Service Revenue (undefined) Forecast, by Application 2020 & 2033
- Table 20: Germany Revenue Operations Service Revenue (undefined) Forecast, by Application 2020 & 2033
- Table 21: France Revenue Operations Service Revenue (undefined) Forecast, by Application 2020 & 2033
- Table 22: Italy Revenue Operations Service Revenue (undefined) Forecast, by Application 2020 & 2033
- Table 23: Spain Revenue Operations Service Revenue (undefined) Forecast, by Application 2020 & 2033
- Table 24: Russia Revenue Operations Service Revenue (undefined) Forecast, by Application 2020 & 2033
- Table 25: Benelux Revenue Operations Service Revenue (undefined) Forecast, by Application 2020 & 2033
- Table 26: Nordics Revenue Operations Service Revenue (undefined) Forecast, by Application 2020 & 2033
- Table 27: Rest of Europe Revenue Operations Service Revenue (undefined) Forecast, by Application 2020 & 2033
- Table 28: Global Revenue Operations Service Revenue undefined Forecast, by Application 2020 & 2033
- Table 29: Global Revenue Operations Service Revenue undefined Forecast, by Types 2020 & 2033
- Table 30: Global Revenue Operations Service Revenue undefined Forecast, by Country 2020 & 2033
- Table 31: Turkey Revenue Operations Service Revenue (undefined) Forecast, by Application 2020 & 2033
- Table 32: Israel Revenue Operations Service Revenue (undefined) Forecast, by Application 2020 & 2033
- Table 33: GCC Revenue Operations Service Revenue (undefined) Forecast, by Application 2020 & 2033
- Table 34: North Africa Revenue Operations Service Revenue (undefined) Forecast, by Application 2020 & 2033
- Table 35: South Africa Revenue Operations Service Revenue (undefined) Forecast, by Application 2020 & 2033
- Table 36: Rest of Middle East & Africa Revenue Operations Service Revenue (undefined) Forecast, by Application 2020 & 2033
- Table 37: Global Revenue Operations Service Revenue undefined Forecast, by Application 2020 & 2033
- Table 38: Global Revenue Operations Service Revenue undefined Forecast, by Types 2020 & 2033
- Table 39: Global Revenue Operations Service Revenue undefined Forecast, by Country 2020 & 2033
- Table 40: China Revenue Operations Service Revenue (undefined) Forecast, by Application 2020 & 2033
- Table 41: India Revenue Operations Service Revenue (undefined) Forecast, by Application 2020 & 2033
- Table 42: Japan Revenue Operations Service Revenue (undefined) Forecast, by Application 2020 & 2033
- Table 43: South Korea Revenue Operations Service Revenue (undefined) Forecast, by Application 2020 & 2033
- Table 44: ASEAN Revenue Operations Service Revenue (undefined) Forecast, by Application 2020 & 2033
- Table 45: Oceania Revenue Operations Service Revenue (undefined) Forecast, by Application 2020 & 2033
- Table 46: Rest of Asia Pacific Revenue Operations Service Revenue (undefined) Forecast, by Application 2020 & 2033
Frequently Asked Questions
1. What is the projected Compound Annual Growth Rate (CAGR) of the Revenue Operations Service?
The projected CAGR is approximately 17.16%.
2. Which companies are prominent players in the Revenue Operations Service?
Key companies in the market include Alexander Group, Centric Consulting, Winning by Design, Go Nimbly, LeadMD, Atomic Revenue, New Breed, Altus Alliance, CloudKettle, MASS Engines, Process Pro Consulting, Iceberg RevOps.
3. What are the main segments of the Revenue Operations Service?
The market segments include Application, Types.
4. Can you provide details about the market size?
The market size is estimated to be USD XXX N/A as of 2022.
5. What are some drivers contributing to market growth?
N/A
6. What are the notable trends driving market growth?
N/A
7. Are there any restraints impacting market growth?
N/A
8. Can you provide examples of recent developments in the market?
N/A
9. What pricing options are available for accessing the report?
Pricing options include single-user, multi-user, and enterprise licenses priced at USD 3350.00, USD 5025.00, and USD 6700.00 respectively.
10. Is the market size provided in terms of value or volume?
The market size is provided in terms of value, measured in N/A.
11. Are there any specific market keywords associated with the report?
Yes, the market keyword associated with the report is "Revenue Operations Service," which aids in identifying and referencing the specific market segment covered.
12. How do I determine which pricing option suits my needs best?
The pricing options vary based on user requirements and access needs. Individual users may opt for single-user licenses, while businesses requiring broader access may choose multi-user or enterprise licenses for cost-effective access to the report.
13. Are there any additional resources or data provided in the Revenue Operations Service report?
While the report offers comprehensive insights, it's advisable to review the specific contents or supplementary materials provided to ascertain if additional resources or data are available.
14. How can I stay updated on further developments or reports in the Revenue Operations Service?
To stay informed about further developments, trends, and reports in the Revenue Operations Service, consider subscribing to industry newsletters, following relevant companies and organizations, or regularly checking reputable industry news sources and publications.
Methodology
Step 1 - Identification of Relevant Samples Size from Population Database


Step 2 - Approaches for Defining Global Market Size (Value, Volume* & Price*)

Note*: In applicable scenarios
Step 3 - Data Sources
Primary Research
- Web Analytics
- Survey Reports
- Research Institute
- Latest Research Reports
- Opinion Leaders
Secondary Research
- Annual Reports
- White Paper
- Latest Press Release
- Industry Association
- Paid Database
- Investor Presentations

Step 4 - Data Triangulation
Involves using different sources of information in order to increase the validity of a study
These sources are likely to be stakeholders in a program - participants, other researchers, program staff, other community members, and so on.
Then we put all data in single framework & apply various statistical tools to find out the dynamic on the market.
During the analysis stage, feedback from the stakeholder groups would be compared to determine areas of agreement as well as areas of divergence