

Key Insights
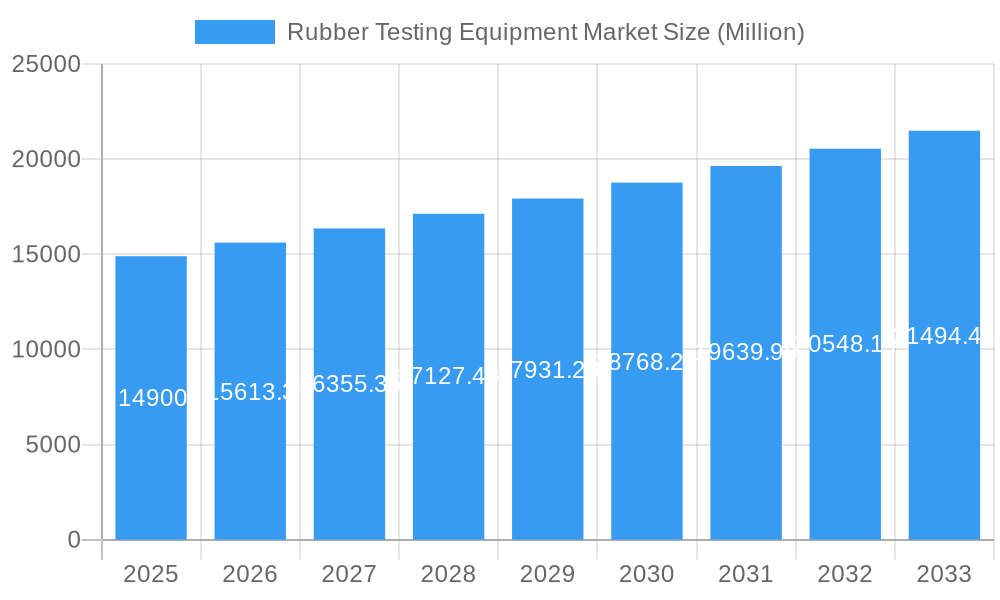
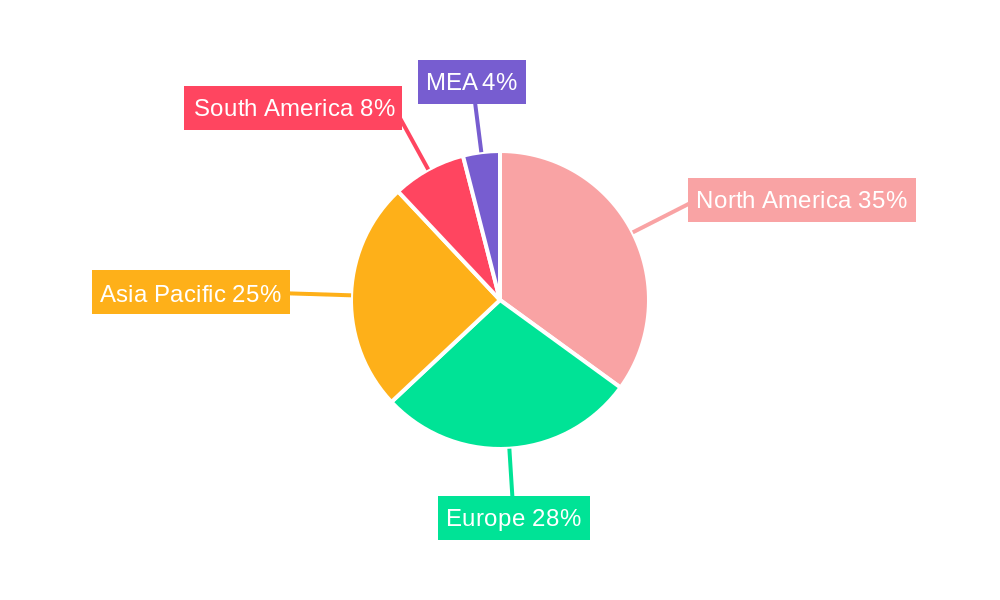
The global rubber testing equipment market, valued at $14.90 billion in 2025, is projected to experience robust growth, driven by a compound annual growth rate (CAGR) of 4.70% from 2025 to 2033. This expansion is fueled by several key factors. Firstly, the increasing demand for high-quality rubber products across diverse industries, including automotive, aerospace, and construction, necessitates rigorous testing to ensure performance and safety standards. Advancements in rubber material science and the development of novel rubber compounds further contribute to market growth, as manufacturers require sophisticated equipment to evaluate these new materials. The rising adoption of automation and digital technologies in testing procedures is also boosting efficiency and precision, driving demand for advanced testing equipment. Geographically, North America and Asia-Pacific are expected to be major contributors to market growth, owing to established manufacturing bases and burgeoning industrial activity in these regions. The tire industry is a significant end-user segment, accounting for a substantial portion of market demand. However, challenges such as the high initial investment costs associated with advanced equipment and potential regulatory hurdles in some regions could moderately restrain market expansion.
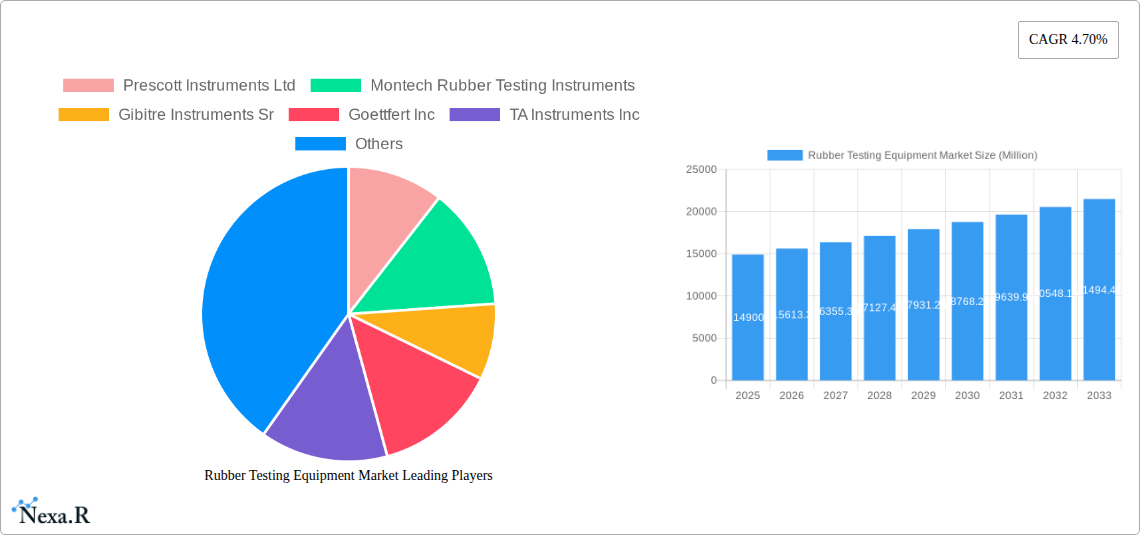
Rubber Testing Equipment Market Market Size (In Billion)
The market segmentation reveals a diverse landscape. Density, viscosity, hardness, and flex testing constitute the major types of testing, each catering to specific product characteristics. The end-user applications span various sectors, with the tire industry, general rubber goods, industrial rubber products, and general polymer compounds being prominent consumers. Competitive dynamics are characterized by a mix of established players and emerging companies, with Prescott Instruments Ltd, Montech Rubber Testing Instruments, and others vying for market share through technological innovation, strategic partnerships, and geographic expansion. The forecast period (2025-2033) anticipates sustained growth, driven by continuous improvements in testing technologies and the increasing demand for robust quality control across the rubber industry. Further regional analysis shows significant opportunities in emerging economies of Asia-Pacific and South America where infrastructure development and industrialization are driving demand.
Rubber Testing Equipment Market Company Market Share
Rubber Testing Equipment Market: A Comprehensive Report (2019-2033)
This comprehensive report provides an in-depth analysis of the Rubber Testing Equipment market, encompassing market dynamics, growth trends, regional analysis, competitive landscape, and future outlook. The report covers the period from 2019 to 2033, with a base year of 2025 and a forecast period of 2025-2033. The market is segmented by type of testing (Density, Viscosity, Hardness, Flex, and Other) and end-user application (Tire, General Rubber Goods, Industrial Rubber Products, General Polymer, and Compound). The total market size in 2025 is estimated at XX Million units.
This report will be invaluable for industry professionals, investors, and researchers seeking a detailed understanding of this dynamic market.
Rubber Testing Equipment Market Dynamics & Structure
The Rubber Testing Equipment market is characterized by a moderately concentrated structure, with a few key players holding significant market share. Technological innovation is a major driver, with ongoing advancements in testing methods and automation increasing efficiency and accuracy. Stringent regulatory frameworks governing product safety and quality assurance further influence market growth. The market also faces competition from substitute materials and testing techniques. End-user demographics are diverse, spanning various industries with varying testing needs. M&A activity in the sector has been moderate, with strategic acquisitions aimed at expanding product portfolios and market reach.
- Market Concentration: XX% market share held by top 5 players in 2025.
- Technological Innovation: Focus on automation, precision, and non-destructive testing methods.
- Regulatory Framework: Compliance with ISO and ASTM standards significantly impacts market dynamics.
- Competitive Substitutes: Advanced analytical techniques and alternative materials pose a competitive threat.
- End-user Demographics: Diverse range of industries, from automotive to medical, drives market demand.
- M&A Trends: XX M&A deals recorded between 2019-2024, primarily focused on vertical integration and geographic expansion.
Rubber Testing Equipment Market Growth Trends & Insights
The Rubber Testing Equipment market is experiencing steady growth, driven by factors such as increasing demand for high-quality rubber products, stringent quality control measures across industries, and technological advancements in testing equipment. The market size is projected to reach XX Million units by 2033, exhibiting a CAGR of XX% during the forecast period. Technological disruptions, such as the integration of AI and advanced sensors, are enhancing testing capabilities and efficiency. Consumer behavior shifts toward sustainable and high-performance rubber products are also fueling market growth. Adoption rates are increasing in developing economies due to rising industrialization and infrastructure development.
Dominant Regions, Countries, or Segments in Rubber Testing Equipment Market
The North American region currently holds the largest market share, driven by robust automotive and industrial sectors. However, Asia-Pacific is projected to experience the fastest growth during the forecast period due to rapid industrialization and expanding manufacturing base. Within the segmentation, Hardness Testing holds a significant share, followed by Density Testing. The Tire industry is the leading end-user application, due to stringent quality and safety requirements.
- Key Drivers in North America: Strong automotive industry, stringent quality standards, and technological advancements.
- Key Drivers in Asia-Pacific: Rapid industrialization, expanding manufacturing base, and rising disposable incomes.
- Dominant Segment (By Type): Hardness Testing (XX% market share in 2025) – driven by the need for consistent quality in tire manufacturing and other rubber applications.
- Dominant Segment (By End-user): Tire Industry (XX% market share in 2025) - owing to demanding quality and safety regulations.
Rubber Testing Equipment Market Product Landscape
The market offers a wide range of equipment, from basic hardness testers to sophisticated automated systems capable of performing multiple tests simultaneously. Recent innovations include advancements in sensor technology, improved data analysis capabilities, and integration with cloud-based platforms for remote monitoring and analysis. These advancements enhance accuracy, efficiency, and data management capabilities. Key selling propositions include ease of use, high accuracy, durability, and versatility.
Key Drivers, Barriers & Challenges in Rubber Testing Equipment Market
Key Drivers: Growing demand for high-quality rubber products across various sectors, increasing focus on quality control and regulatory compliance, advancements in testing technologies, and rising investments in R&D.
Key Challenges: High initial investment costs for advanced equipment, the need for skilled personnel to operate and maintain the equipment, and intense competition among existing players. Supply chain disruptions can also impact the availability of components and increase costs. Regulatory changes and evolving industry standards present ongoing challenges for manufacturers to maintain compliance.
Emerging Opportunities in Rubber Testing Equipment Market
Emerging opportunities lie in the development of non-destructive testing methods, miniaturized and portable testing devices, and the integration of AI and machine learning for automated data analysis. Untapped markets in developing economies present significant growth potential. The increasing demand for sustainable and eco-friendly rubber products necessitates the development of specialized testing equipment for assessing environmental impact.
Growth Accelerators in the Rubber Testing Equipment Market Industry
Long-term growth will be fueled by technological breakthroughs, strategic partnerships, and market expansion strategies. The integration of advanced materials and manufacturing processes is creating demand for innovative testing methods and equipment. Strategic alliances between equipment manufacturers and material suppliers will contribute to accelerating the growth of this market.
Key Players Shaping the Rubber Testing Equipment Market Market
- Prescott Instruments Ltd
- Montech Rubber Testing Instruments
- Gibitre Instruments Sr
- Goettfert Inc
- TA Instruments Inc
- Alpha Technologies
- U-Can Dynatex Inc
- Norka Instruments Sanghai Ltd
- Ektron Tek Co Ltd
- Gotech Testing Machines
Notable Milestones in Rubber Testing Equipment Market Sector
- 2022: Launch of a new automated hardness testing system by Goettfert Inc.
- 2023: Prescott Instruments Ltd acquired a smaller competitor, expanding its product portfolio.
- 2024: Introduction of a new non-destructive testing method by TA Instruments Inc.
In-Depth Rubber Testing Equipment Market Market Outlook
The Rubber Testing Equipment market is poised for continued growth, driven by technological advancements, increasing demand for high-quality rubber products, and expanding industrialization globally. Strategic investments in R&D and collaborations among key players will further accelerate market expansion. The adoption of advanced testing technologies and automation will enhance efficiency and create new opportunities in niche applications. The market presents attractive prospects for companies that can leverage technological innovations and cater to the evolving needs of various industries.
Rubber Testing Equipment Market Segmentation
-
1. Type of Testing
- 1.1. Density Testing
- 1.2. Viscocity Testing
- 1.3. Hardness Testing
- 1.4. Flex Testing
- 1.5. Other Types of Testing
-
2. End-user Application
- 2.1. Tire
- 2.2. General Rubber Goods
- 2.3. Industrial Rubber Products
- 2.4. General Polymer
- 2.5. Compound
Rubber Testing Equipment Market Segmentation By Geography
- 1. North America
- 2. Europe
- 3. Asia
- 4. Australia and New Zealand
- 5. Latin America
- 6. Middle East and Africa
Rubber Testing Equipment Market Regional Market Share
Geographic Coverage of Rubber Testing Equipment Market
Rubber Testing Equipment Market REPORT HIGHLIGHTS
| Aspects | Details |
|---|---|
| Study Period | 2020-2034 |
| Base Year | 2025 |
| Estimated Year | 2026 |
| Forecast Period | 2026-2034 |
| Historical Period | 2020-2025 |
| Growth Rate | CAGR of 4.70% from 2020-2034 |
| Segmentation |
|
Table of Contents
- 1. Introduction
- 1.1. Research Scope
- 1.2. Market Segmentation
- 1.3. Research Objective
- 1.4. Definitions and Assumptions
- 2. Executive Summary
- 2.1. Market Snapshot
- 3. Market Dynamics
- 3.1. Market Drivers
- 3.2. Market Restrains
- 3.3. Market Trends
- 3.4. Market Opportunities
- 4. Market Factor Analysis
- 4.1. Porters Five Forces
- 4.1.1. Bargaining Power of Suppliers
- 4.1.2. Bargaining Power of Buyers
- 4.1.3. Threat of New Entrants
- 4.1.4. Threat of Substitutes
- 4.1.5. Competitive Rivalry
- 4.2. PESTEL analysis
- 4.3. BCG Analysis
- 4.3.1. Stars (High Growth, High Market Share)
- 4.3.2. Cash Cows (Low Growth, High Market Share)
- 4.3.3. Question Mark (High Growth, Low Market Share)
- 4.3.4. Dogs (Low Growth, Low Market Share)
- 4.4. Ansoff Matrix Analysis
- 4.5. Supply Chain Analysis
- 4.6. Regulatory Landscape
- 4.7. Current Market Potential and Opportunity Assessment (TAM–SAM–SOM Framework)
- 4.8. NRP Analyst Note
- 4.1. Porters Five Forces
- 5. Market Analysis, Insights and Forecast 2021-2033
- 5.1. Market Analysis, Insights and Forecast - by Type of Testing
- 5.1.1. Density Testing
- 5.1.2. Viscocity Testing
- 5.1.3. Hardness Testing
- 5.1.4. Flex Testing
- 5.1.5. Other Types of Testing
- 5.2. Market Analysis, Insights and Forecast - by End-user Application
- 5.2.1. Tire
- 5.2.2. General Rubber Goods
- 5.2.3. Industrial Rubber Products
- 5.2.4. General Polymer
- 5.2.5. Compound
- 5.3. Market Analysis, Insights and Forecast - by Region
- 5.3.1. North America
- 5.3.2. Europe
- 5.3.3. Asia
- 5.3.4. Australia and New Zealand
- 5.3.5. Latin America
- 5.3.6. Middle East and Africa
- 5.1. Market Analysis, Insights and Forecast - by Type of Testing
- 6. Global Rubber Testing Equipment Market Analysis, Insights and Forecast, 2021-2033
- 6.1. Market Analysis, Insights and Forecast - by Type of Testing
- 6.1.1. Density Testing
- 6.1.2. Viscocity Testing
- 6.1.3. Hardness Testing
- 6.1.4. Flex Testing
- 6.1.5. Other Types of Testing
- 6.2. Market Analysis, Insights and Forecast - by End-user Application
- 6.2.1. Tire
- 6.2.2. General Rubber Goods
- 6.2.3. Industrial Rubber Products
- 6.2.4. General Polymer
- 6.2.5. Compound
- 6.1. Market Analysis, Insights and Forecast - by Type of Testing
- 7. North America Rubber Testing Equipment Market Analysis, Insights and Forecast, 2020-2032
- 7.1. Market Analysis, Insights and Forecast - by Type of Testing
- 7.1.1. Density Testing
- 7.1.2. Viscocity Testing
- 7.1.3. Hardness Testing
- 7.1.4. Flex Testing
- 7.1.5. Other Types of Testing
- 7.2. Market Analysis, Insights and Forecast - by End-user Application
- 7.2.1. Tire
- 7.2.2. General Rubber Goods
- 7.2.3. Industrial Rubber Products
- 7.2.4. General Polymer
- 7.2.5. Compound
- 7.1. Market Analysis, Insights and Forecast - by Type of Testing
- 8. Europe Rubber Testing Equipment Market Analysis, Insights and Forecast, 2020-2032
- 8.1. Market Analysis, Insights and Forecast - by Type of Testing
- 8.1.1. Density Testing
- 8.1.2. Viscocity Testing
- 8.1.3. Hardness Testing
- 8.1.4. Flex Testing
- 8.1.5. Other Types of Testing
- 8.2. Market Analysis, Insights and Forecast - by End-user Application
- 8.2.1. Tire
- 8.2.2. General Rubber Goods
- 8.2.3. Industrial Rubber Products
- 8.2.4. General Polymer
- 8.2.5. Compound
- 8.1. Market Analysis, Insights and Forecast - by Type of Testing
- 9. Asia Rubber Testing Equipment Market Analysis, Insights and Forecast, 2020-2032
- 9.1. Market Analysis, Insights and Forecast - by Type of Testing
- 9.1.1. Density Testing
- 9.1.2. Viscocity Testing
- 9.1.3. Hardness Testing
- 9.1.4. Flex Testing
- 9.1.5. Other Types of Testing
- 9.2. Market Analysis, Insights and Forecast - by End-user Application
- 9.2.1. Tire
- 9.2.2. General Rubber Goods
- 9.2.3. Industrial Rubber Products
- 9.2.4. General Polymer
- 9.2.5. Compound
- 9.1. Market Analysis, Insights and Forecast - by Type of Testing
- 10. Australia and New Zealand Rubber Testing Equipment Market Analysis, Insights and Forecast, 2020-2032
- 10.1. Market Analysis, Insights and Forecast - by Type of Testing
- 10.1.1. Density Testing
- 10.1.2. Viscocity Testing
- 10.1.3. Hardness Testing
- 10.1.4. Flex Testing
- 10.1.5. Other Types of Testing
- 10.2. Market Analysis, Insights and Forecast - by End-user Application
- 10.2.1. Tire
- 10.2.2. General Rubber Goods
- 10.2.3. Industrial Rubber Products
- 10.2.4. General Polymer
- 10.2.5. Compound
- 10.1. Market Analysis, Insights and Forecast - by Type of Testing
- 11. Latin America Rubber Testing Equipment Market Analysis, Insights and Forecast, 2020-2032
- 11.1. Market Analysis, Insights and Forecast - by Type of Testing
- 11.1.1. Density Testing
- 11.1.2. Viscocity Testing
- 11.1.3. Hardness Testing
- 11.1.4. Flex Testing
- 11.1.5. Other Types of Testing
- 11.2. Market Analysis, Insights and Forecast - by End-user Application
- 11.2.1. Tire
- 11.2.2. General Rubber Goods
- 11.2.3. Industrial Rubber Products
- 11.2.4. General Polymer
- 11.2.5. Compound
- 11.1. Market Analysis, Insights and Forecast - by Type of Testing
- 12. Middle East and Africa Rubber Testing Equipment Market Analysis, Insights and Forecast, 2020-2032
- 12.1. Market Analysis, Insights and Forecast - by Type of Testing
- 12.1.1. Density Testing
- 12.1.2. Viscocity Testing
- 12.1.3. Hardness Testing
- 12.1.4. Flex Testing
- 12.1.5. Other Types of Testing
- 12.2. Market Analysis, Insights and Forecast - by End-user Application
- 12.2.1. Tire
- 12.2.2. General Rubber Goods
- 12.2.3. Industrial Rubber Products
- 12.2.4. General Polymer
- 12.2.5. Compound
- 12.1. Market Analysis, Insights and Forecast - by Type of Testing
- 13. Competitive Analysis
- 13.1. Company Profiles
- 13.1.1 Prescott Instruments Ltd
- 13.1.1.1. Company Overview
- 13.1.1.2. Products
- 13.1.1.3. Company Financials
- 13.1.1.4. SWOT Analysis
- 13.1.2 Montech Rubber Testing Instruments
- 13.1.2.1. Company Overview
- 13.1.2.2. Products
- 13.1.2.3. Company Financials
- 13.1.2.4. SWOT Analysis
- 13.1.3 Gibitre Instruments Sr
- 13.1.3.1. Company Overview
- 13.1.3.2. Products
- 13.1.3.3. Company Financials
- 13.1.3.4. SWOT Analysis
- 13.1.4 Goettfert Inc
- 13.1.4.1. Company Overview
- 13.1.4.2. Products
- 13.1.4.3. Company Financials
- 13.1.4.4. SWOT Analysis
- 13.1.5 TA Instruments Inc
- 13.1.5.1. Company Overview
- 13.1.5.2. Products
- 13.1.5.3. Company Financials
- 13.1.5.4. SWOT Analysis
- 13.1.6 Alpha Technologies
- 13.1.6.1. Company Overview
- 13.1.6.2. Products
- 13.1.6.3. Company Financials
- 13.1.6.4. SWOT Analysis
- 13.1.7 U-Can Dynatex Inc
- 13.1.7.1. Company Overview
- 13.1.7.2. Products
- 13.1.7.3. Company Financials
- 13.1.7.4. SWOT Analysis
- 13.1.8 Norka Instruments Sanghai Ltd
- 13.1.8.1. Company Overview
- 13.1.8.2. Products
- 13.1.8.3. Company Financials
- 13.1.8.4. SWOT Analysis
- 13.1.9 Ektron Tek Co Ltd
- 13.1.9.1. Company Overview
- 13.1.9.2. Products
- 13.1.9.3. Company Financials
- 13.1.9.4. SWOT Analysis
- 13.1.10 Gotech Testing Machines
- 13.1.10.1. Company Overview
- 13.1.10.2. Products
- 13.1.10.3. Company Financials
- 13.1.10.4. SWOT Analysis
- 13.1.1 Prescott Instruments Ltd
- 13.2. Market Entropy
- 13.2.1 Company's Key Areas Served
- 13.2.2 Recent Developments
- 13.3. Company Market Share Analysis 2025
- 13.3.1 Top 5 Companies Market Share Analysis
- 13.3.2 Top 3 Companies Market Share Analysis
- 13.4. List of Potential Customers
- 14. Research Methodology
List of Figures
- Figure 1: Global Rubber Testing Equipment Market Revenue Breakdown (Million, %) by Region 2025 & 2033
- Figure 2: Global Rubber Testing Equipment Market Volume Breakdown (K Unit, %) by Region 2025 & 2033
- Figure 3: North America Rubber Testing Equipment Market Revenue (Million), by Type of Testing 2025 & 2033
- Figure 4: North America Rubber Testing Equipment Market Volume (K Unit), by Type of Testing 2025 & 2033
- Figure 5: North America Rubber Testing Equipment Market Revenue Share (%), by Type of Testing 2025 & 2033
- Figure 6: North America Rubber Testing Equipment Market Volume Share (%), by Type of Testing 2025 & 2033
- Figure 7: North America Rubber Testing Equipment Market Revenue (Million), by End-user Application 2025 & 2033
- Figure 8: North America Rubber Testing Equipment Market Volume (K Unit), by End-user Application 2025 & 2033
- Figure 9: North America Rubber Testing Equipment Market Revenue Share (%), by End-user Application 2025 & 2033
- Figure 10: North America Rubber Testing Equipment Market Volume Share (%), by End-user Application 2025 & 2033
- Figure 11: North America Rubber Testing Equipment Market Revenue (Million), by Country 2025 & 2033
- Figure 12: North America Rubber Testing Equipment Market Volume (K Unit), by Country 2025 & 2033
- Figure 13: North America Rubber Testing Equipment Market Revenue Share (%), by Country 2025 & 2033
- Figure 14: North America Rubber Testing Equipment Market Volume Share (%), by Country 2025 & 2033
- Figure 15: Europe Rubber Testing Equipment Market Revenue (Million), by Type of Testing 2025 & 2033
- Figure 16: Europe Rubber Testing Equipment Market Volume (K Unit), by Type of Testing 2025 & 2033
- Figure 17: Europe Rubber Testing Equipment Market Revenue Share (%), by Type of Testing 2025 & 2033
- Figure 18: Europe Rubber Testing Equipment Market Volume Share (%), by Type of Testing 2025 & 2033
- Figure 19: Europe Rubber Testing Equipment Market Revenue (Million), by End-user Application 2025 & 2033
- Figure 20: Europe Rubber Testing Equipment Market Volume (K Unit), by End-user Application 2025 & 2033
- Figure 21: Europe Rubber Testing Equipment Market Revenue Share (%), by End-user Application 2025 & 2033
- Figure 22: Europe Rubber Testing Equipment Market Volume Share (%), by End-user Application 2025 & 2033
- Figure 23: Europe Rubber Testing Equipment Market Revenue (Million), by Country 2025 & 2033
- Figure 24: Europe Rubber Testing Equipment Market Volume (K Unit), by Country 2025 & 2033
- Figure 25: Europe Rubber Testing Equipment Market Revenue Share (%), by Country 2025 & 2033
- Figure 26: Europe Rubber Testing Equipment Market Volume Share (%), by Country 2025 & 2033
- Figure 27: Asia Rubber Testing Equipment Market Revenue (Million), by Type of Testing 2025 & 2033
- Figure 28: Asia Rubber Testing Equipment Market Volume (K Unit), by Type of Testing 2025 & 2033
- Figure 29: Asia Rubber Testing Equipment Market Revenue Share (%), by Type of Testing 2025 & 2033
- Figure 30: Asia Rubber Testing Equipment Market Volume Share (%), by Type of Testing 2025 & 2033
- Figure 31: Asia Rubber Testing Equipment Market Revenue (Million), by End-user Application 2025 & 2033
- Figure 32: Asia Rubber Testing Equipment Market Volume (K Unit), by End-user Application 2025 & 2033
- Figure 33: Asia Rubber Testing Equipment Market Revenue Share (%), by End-user Application 2025 & 2033
- Figure 34: Asia Rubber Testing Equipment Market Volume Share (%), by End-user Application 2025 & 2033
- Figure 35: Asia Rubber Testing Equipment Market Revenue (Million), by Country 2025 & 2033
- Figure 36: Asia Rubber Testing Equipment Market Volume (K Unit), by Country 2025 & 2033
- Figure 37: Asia Rubber Testing Equipment Market Revenue Share (%), by Country 2025 & 2033
- Figure 38: Asia Rubber Testing Equipment Market Volume Share (%), by Country 2025 & 2033
- Figure 39: Australia and New Zealand Rubber Testing Equipment Market Revenue (Million), by Type of Testing 2025 & 2033
- Figure 40: Australia and New Zealand Rubber Testing Equipment Market Volume (K Unit), by Type of Testing 2025 & 2033
- Figure 41: Australia and New Zealand Rubber Testing Equipment Market Revenue Share (%), by Type of Testing 2025 & 2033
- Figure 42: Australia and New Zealand Rubber Testing Equipment Market Volume Share (%), by Type of Testing 2025 & 2033
- Figure 43: Australia and New Zealand Rubber Testing Equipment Market Revenue (Million), by End-user Application 2025 & 2033
- Figure 44: Australia and New Zealand Rubber Testing Equipment Market Volume (K Unit), by End-user Application 2025 & 2033
- Figure 45: Australia and New Zealand Rubber Testing Equipment Market Revenue Share (%), by End-user Application 2025 & 2033
- Figure 46: Australia and New Zealand Rubber Testing Equipment Market Volume Share (%), by End-user Application 2025 & 2033
- Figure 47: Australia and New Zealand Rubber Testing Equipment Market Revenue (Million), by Country 2025 & 2033
- Figure 48: Australia and New Zealand Rubber Testing Equipment Market Volume (K Unit), by Country 2025 & 2033
- Figure 49: Australia and New Zealand Rubber Testing Equipment Market Revenue Share (%), by Country 2025 & 2033
- Figure 50: Australia and New Zealand Rubber Testing Equipment Market Volume Share (%), by Country 2025 & 2033
- Figure 51: Latin America Rubber Testing Equipment Market Revenue (Million), by Type of Testing 2025 & 2033
- Figure 52: Latin America Rubber Testing Equipment Market Volume (K Unit), by Type of Testing 2025 & 2033
- Figure 53: Latin America Rubber Testing Equipment Market Revenue Share (%), by Type of Testing 2025 & 2033
- Figure 54: Latin America Rubber Testing Equipment Market Volume Share (%), by Type of Testing 2025 & 2033
- Figure 55: Latin America Rubber Testing Equipment Market Revenue (Million), by End-user Application 2025 & 2033
- Figure 56: Latin America Rubber Testing Equipment Market Volume (K Unit), by End-user Application 2025 & 2033
- Figure 57: Latin America Rubber Testing Equipment Market Revenue Share (%), by End-user Application 2025 & 2033
- Figure 58: Latin America Rubber Testing Equipment Market Volume Share (%), by End-user Application 2025 & 2033
- Figure 59: Latin America Rubber Testing Equipment Market Revenue (Million), by Country 2025 & 2033
- Figure 60: Latin America Rubber Testing Equipment Market Volume (K Unit), by Country 2025 & 2033
- Figure 61: Latin America Rubber Testing Equipment Market Revenue Share (%), by Country 2025 & 2033
- Figure 62: Latin America Rubber Testing Equipment Market Volume Share (%), by Country 2025 & 2033
- Figure 63: Middle East and Africa Rubber Testing Equipment Market Revenue (Million), by Type of Testing 2025 & 2033
- Figure 64: Middle East and Africa Rubber Testing Equipment Market Volume (K Unit), by Type of Testing 2025 & 2033
- Figure 65: Middle East and Africa Rubber Testing Equipment Market Revenue Share (%), by Type of Testing 2025 & 2033
- Figure 66: Middle East and Africa Rubber Testing Equipment Market Volume Share (%), by Type of Testing 2025 & 2033
- Figure 67: Middle East and Africa Rubber Testing Equipment Market Revenue (Million), by End-user Application 2025 & 2033
- Figure 68: Middle East and Africa Rubber Testing Equipment Market Volume (K Unit), by End-user Application 2025 & 2033
- Figure 69: Middle East and Africa Rubber Testing Equipment Market Revenue Share (%), by End-user Application 2025 & 2033
- Figure 70: Middle East and Africa Rubber Testing Equipment Market Volume Share (%), by End-user Application 2025 & 2033
- Figure 71: Middle East and Africa Rubber Testing Equipment Market Revenue (Million), by Country 2025 & 2033
- Figure 72: Middle East and Africa Rubber Testing Equipment Market Volume (K Unit), by Country 2025 & 2033
- Figure 73: Middle East and Africa Rubber Testing Equipment Market Revenue Share (%), by Country 2025 & 2033
- Figure 74: Middle East and Africa Rubber Testing Equipment Market Volume Share (%), by Country 2025 & 2033
List of Tables
- Table 1: Global Rubber Testing Equipment Market Revenue Million Forecast, by Type of Testing 2020 & 2033
- Table 2: Global Rubber Testing Equipment Market Volume K Unit Forecast, by Type of Testing 2020 & 2033
- Table 3: Global Rubber Testing Equipment Market Revenue Million Forecast, by End-user Application 2020 & 2033
- Table 4: Global Rubber Testing Equipment Market Volume K Unit Forecast, by End-user Application 2020 & 2033
- Table 5: Global Rubber Testing Equipment Market Revenue Million Forecast, by Region 2020 & 2033
- Table 6: Global Rubber Testing Equipment Market Volume K Unit Forecast, by Region 2020 & 2033
- Table 7: Global Rubber Testing Equipment Market Revenue Million Forecast, by Type of Testing 2020 & 2033
- Table 8: Global Rubber Testing Equipment Market Volume K Unit Forecast, by Type of Testing 2020 & 2033
- Table 9: Global Rubber Testing Equipment Market Revenue Million Forecast, by End-user Application 2020 & 2033
- Table 10: Global Rubber Testing Equipment Market Volume K Unit Forecast, by End-user Application 2020 & 2033
- Table 11: Global Rubber Testing Equipment Market Revenue Million Forecast, by Country 2020 & 2033
- Table 12: Global Rubber Testing Equipment Market Volume K Unit Forecast, by Country 2020 & 2033
- Table 13: Global Rubber Testing Equipment Market Revenue Million Forecast, by Type of Testing 2020 & 2033
- Table 14: Global Rubber Testing Equipment Market Volume K Unit Forecast, by Type of Testing 2020 & 2033
- Table 15: Global Rubber Testing Equipment Market Revenue Million Forecast, by End-user Application 2020 & 2033
- Table 16: Global Rubber Testing Equipment Market Volume K Unit Forecast, by End-user Application 2020 & 2033
- Table 17: Global Rubber Testing Equipment Market Revenue Million Forecast, by Country 2020 & 2033
- Table 18: Global Rubber Testing Equipment Market Volume K Unit Forecast, by Country 2020 & 2033
- Table 19: Global Rubber Testing Equipment Market Revenue Million Forecast, by Type of Testing 2020 & 2033
- Table 20: Global Rubber Testing Equipment Market Volume K Unit Forecast, by Type of Testing 2020 & 2033
- Table 21: Global Rubber Testing Equipment Market Revenue Million Forecast, by End-user Application 2020 & 2033
- Table 22: Global Rubber Testing Equipment Market Volume K Unit Forecast, by End-user Application 2020 & 2033
- Table 23: Global Rubber Testing Equipment Market Revenue Million Forecast, by Country 2020 & 2033
- Table 24: Global Rubber Testing Equipment Market Volume K Unit Forecast, by Country 2020 & 2033
- Table 25: Global Rubber Testing Equipment Market Revenue Million Forecast, by Type of Testing 2020 & 2033
- Table 26: Global Rubber Testing Equipment Market Volume K Unit Forecast, by Type of Testing 2020 & 2033
- Table 27: Global Rubber Testing Equipment Market Revenue Million Forecast, by End-user Application 2020 & 2033
- Table 28: Global Rubber Testing Equipment Market Volume K Unit Forecast, by End-user Application 2020 & 2033
- Table 29: Global Rubber Testing Equipment Market Revenue Million Forecast, by Country 2020 & 2033
- Table 30: Global Rubber Testing Equipment Market Volume K Unit Forecast, by Country 2020 & 2033
- Table 31: Global Rubber Testing Equipment Market Revenue Million Forecast, by Type of Testing 2020 & 2033
- Table 32: Global Rubber Testing Equipment Market Volume K Unit Forecast, by Type of Testing 2020 & 2033
- Table 33: Global Rubber Testing Equipment Market Revenue Million Forecast, by End-user Application 2020 & 2033
- Table 34: Global Rubber Testing Equipment Market Volume K Unit Forecast, by End-user Application 2020 & 2033
- Table 35: Global Rubber Testing Equipment Market Revenue Million Forecast, by Country 2020 & 2033
- Table 36: Global Rubber Testing Equipment Market Volume K Unit Forecast, by Country 2020 & 2033
- Table 37: Global Rubber Testing Equipment Market Revenue Million Forecast, by Type of Testing 2020 & 2033
- Table 38: Global Rubber Testing Equipment Market Volume K Unit Forecast, by Type of Testing 2020 & 2033
- Table 39: Global Rubber Testing Equipment Market Revenue Million Forecast, by End-user Application 2020 & 2033
- Table 40: Global Rubber Testing Equipment Market Volume K Unit Forecast, by End-user Application 2020 & 2033
- Table 41: Global Rubber Testing Equipment Market Revenue Million Forecast, by Country 2020 & 2033
- Table 42: Global Rubber Testing Equipment Market Volume K Unit Forecast, by Country 2020 & 2033
Frequently Asked Questions
1. What is the projected Compound Annual Growth Rate (CAGR) of the Rubber Testing Equipment Market?
The projected CAGR is approximately 4.70%.
2. Which companies are prominent players in the Rubber Testing Equipment Market?
Key companies in the market include Prescott Instruments Ltd, Montech Rubber Testing Instruments, Gibitre Instruments Sr, Goettfert Inc, TA Instruments Inc, Alpha Technologies, U-Can Dynatex Inc, Norka Instruments Sanghai Ltd, Ektron Tek Co Ltd, Gotech Testing Machines.
3. What are the main segments of the Rubber Testing Equipment Market?
The market segments include Type of Testing, End-user Application.
4. Can you provide details about the market size?
The market size is estimated to be USD 14.90 Million as of 2022.
5. What are some drivers contributing to market growth?
Growing Demand for Durable Goods; Technological Advancements in Rubber Testing.
6. What are the notable trends driving market growth?
The Rising Demand for Tires to Drive the Market.
7. Are there any restraints impacting market growth?
High Cost of Ownership.
8. Can you provide examples of recent developments in the market?
N/A
9. What pricing options are available for accessing the report?
Pricing options include single-user, multi-user, and enterprise licenses priced at USD 4750, USD 5250, and USD 8750 respectively.
10. Is the market size provided in terms of value or volume?
The market size is provided in terms of value, measured in Million and volume, measured in K Unit.
11. Are there any specific market keywords associated with the report?
Yes, the market keyword associated with the report is "Rubber Testing Equipment Market," which aids in identifying and referencing the specific market segment covered.
12. How do I determine which pricing option suits my needs best?
The pricing options vary based on user requirements and access needs. Individual users may opt for single-user licenses, while businesses requiring broader access may choose multi-user or enterprise licenses for cost-effective access to the report.
13. Are there any additional resources or data provided in the Rubber Testing Equipment Market report?
While the report offers comprehensive insights, it's advisable to review the specific contents or supplementary materials provided to ascertain if additional resources or data are available.
14. How can I stay updated on further developments or reports in the Rubber Testing Equipment Market?
To stay informed about further developments, trends, and reports in the Rubber Testing Equipment Market, consider subscribing to industry newsletters, following relevant companies and organizations, or regularly checking reputable industry news sources and publications.
Methodology
Step 1 - Identification of Relevant Samples Size from Population Database


Step 2 - Approaches for Defining Global Market Size (Value, Volume* & Price*)

Note*: In applicable scenarios
Step 3 - Data Sources
Primary Research
- Web Analytics
- Survey Reports
- Research Institute
- Latest Research Reports
- Opinion Leaders
Secondary Research
- Annual Reports
- White Paper
- Latest Press Release
- Industry Association
- Paid Database
- Investor Presentations

Step 4 - Data Triangulation
Involves using different sources of information in order to increase the validity of a study
These sources are likely to be stakeholders in a program - participants, other researchers, program staff, other community members, and so on.
Then we put all data in single framework & apply various statistical tools to find out the dynamic on the market.
During the analysis stage, feedback from the stakeholder groups would be compared to determine areas of agreement as well as areas of divergence