

Key Insights
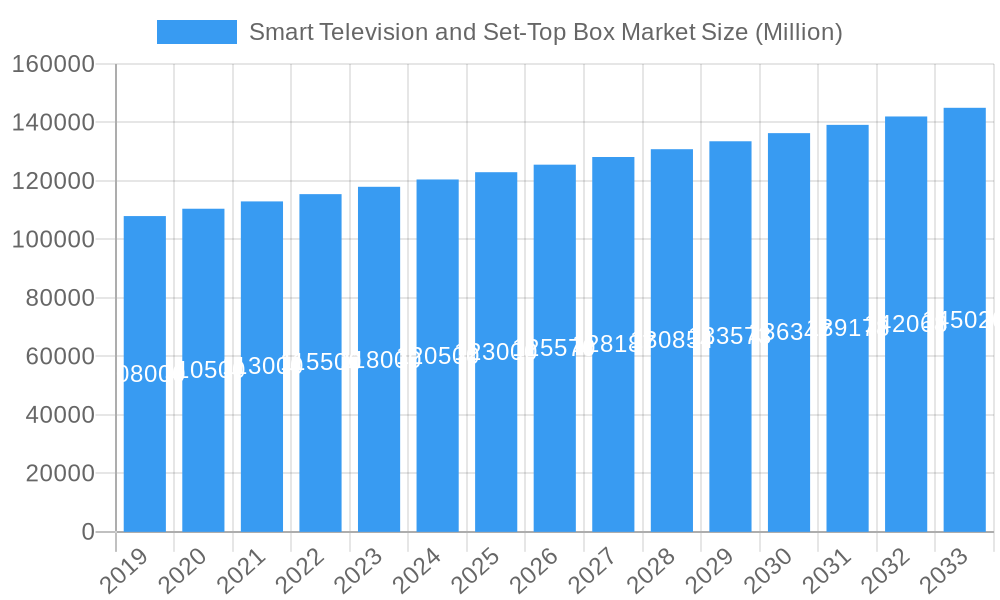
The global Smart Television and Set-Top Box market is projected for significant growth, with an estimated market size of $26.32 billion by 2024, and is expected to expand at a Compound Annual Growth Rate (CAGR) of 3.9% through 2033. This expansion is driven by increasing consumer demand for advanced home entertainment, fueled by breakthroughs in display technology, the widespread availability of high-definition content, and the integration of smart functionalities in televisions. The market encompasses diverse delivery technologies including Satellite/DTH, IPTV, Cable, and DTT. Consumer preference is clearly shifting towards higher resolutions, specifically HD/FHD and Ultra-HD (4K and 8K), for enhanced visual fidelity. Larger screen sizes, particularly 55-60 inches and 65 inches and above, are gaining traction for a more immersive viewing experience. Innovations in LCD, OLED, and QLED technologies continue to improve picture quality, energy efficiency, and dynamic range, further stimulating market expansion.
Smart Television and Set-Top Box Market Market Size (In Billion)
Key growth drivers include rising disposable incomes in emerging markets and the continuous development of internet infrastructure, creating new opportunities. The escalating popularity of Over-The-Top (OTT) streaming services, seamlessly integrated into smart TVs and accessible via set-top boxes, is a primary catalyst. The convergence of entertainment and connectivity, enabling effortless access to a vast array of content and applications, is a defining trend. Potential restraints include the initial cost of premium devices and evolving content distribution regulations. Despite these challenges, the market is poised for robust performance, propelled by technological innovation and evolving consumer entertainment preferences. Leading companies such as Samsung Electronics, LG Electronics, Hisense Group, and TCL Electronics are driving the market through ongoing product development and strategic collaborations.
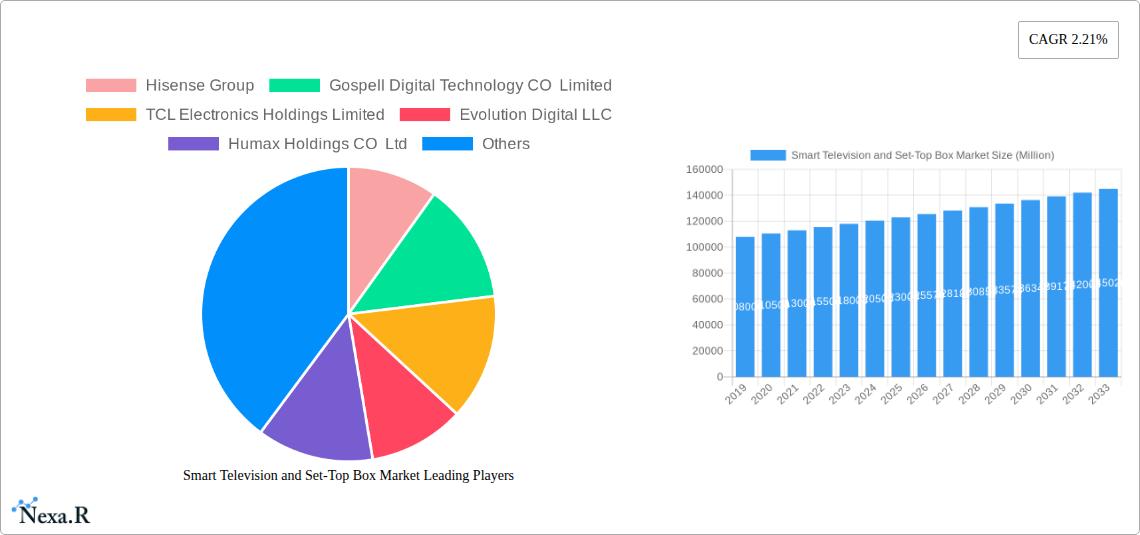
Smart Television and Set-Top Box Market Company Market Share
Smart Television and Set-Top Box Market: Comprehensive Report Description
This in-depth report offers a strategic analysis of the global Smart Television and Set-Top Box market, projecting significant growth from 2019 to 2033, with a base and estimated year of 2025. The study meticulously examines parent and child market segments, providing a 360-degree view for industry professionals seeking to capitalize on evolving consumer demands and technological advancements. With a forecast period of 2025-2033 and historical data from 2019-2024, this report is your definitive guide to navigating the dynamic landscape of connected entertainment.
Smart Television and Set-Top Box Market Market Dynamics & Structure
The Smart Television and Set-Top Box market is characterized by a moderately concentrated structure, driven by intense technological innovation and increasing regulatory frameworks influencing content delivery and device standards. Key drivers include the relentless pursuit of higher resolutions (Ultra-HD and 8K), advanced display technologies (OLED, QLED), and the proliferation of smart features and Android TV integration. Competitive product substitutes are emerging from the growing adoption of smart displays and gaming consoles with streaming capabilities, necessitating continuous innovation from established players. End-user demographics are shifting towards younger, tech-savvy consumers demanding seamless integration of streaming services, personalized content, and an enhanced viewing experience across various display sizes, particularly the popular 55-60 inch and 65 and above segments. Mergers and acquisitions (M&A) trends are shaping the competitive landscape, with companies aiming to consolidate market share and expand their product portfolios. For instance, the acquisition of Evolution Digital LLC by Motorola Mobility LLC in 2012, although historical, signifies strategic consolidation for market advantage. The market is expected to see substantial M&A activity driven by the desire to acquire intellectual property and expand into new geographic regions.
- Market Concentration: Moderate, with a few key global players dominating, but increasing fragmentation due to new entrants and specialized technology providers.
- Technological Innovation Drivers: Focus on 8K resolution, AI-powered features, enhanced connectivity (Wi-Fi 6), and integration with smart home ecosystems.
- Regulatory Frameworks: Evolving standards for digital broadcasting, content security, and data privacy influencing product development and market access.
- Competitive Product Substitutes: Smart displays, gaming consoles, and the increasing capabilities of mobile devices for content consumption.
- End-User Demographics: Younger generations driving demand for OTT services and interactive features; older demographics seeking user-friendly interfaces and accessibility.
- M&A Trends: Strategic acquisitions to gain access to advanced technologies, expand market reach, and diversify product offerings.
Smart Television and Set-Top Box Market Growth Trends & Insights
The Smart Television and Set-Top Box market is poised for robust growth, fueled by an accelerating adoption rate of advanced viewing technologies and a significant shift in consumer behavior towards digital and streaming content. The market size evolution is projected to witness a substantial Compound Annual Growth Rate (CAGR) driven by the increasing demand for Ultra-HD and 8K resolutions, which are becoming more accessible and affordable. Technological disruptions, such as the widespread integration of Android TV and Google TV platforms, are democratizing access to a vast array of applications and streaming services, significantly impacting adoption rates. Consumers are increasingly seeking larger display sizes, with the 65-inch and above segment experiencing particularly strong demand as home entertainment becomes a central focus. The proliferation of IPTV and the ongoing transition from traditional cable and satellite services to more flexible and personalized streaming options are further catalyzing market expansion. The desire for immersive experiences, enhanced by technologies like OLED and QLED, is driving upgrades and new purchases. Furthermore, the increasing connectivity of households and the growing importance of a unified smart home ecosystem are making smart TVs and set-top boxes central to modern living, leading to higher market penetration and increased consumer spending on premium entertainment devices. The projected market size for smart televisions and set-top boxes is expected to reach over USD 200 billion by 2025, with a projected CAGR of approximately 8.5% during the forecast period.
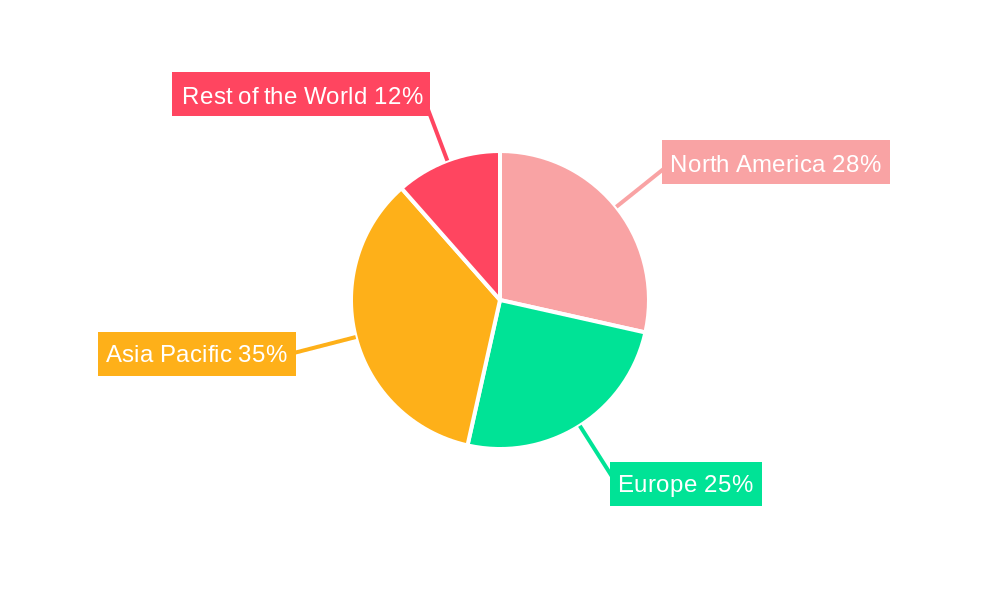
Dominant Regions, Countries, or Segments in Smart Television and Set-Top Box Market
The Smart Television and Set-Top Box market's dominance is multifaceted, with specific regions and technology segments leading the charge. North America and Asia Pacific are emerging as the leading regions, driven by high disposable incomes, robust broadband infrastructure, and a strong consumer appetite for cutting-edge technology. Within these regions, countries like the United States, China, and South Korea are at the forefront of adoption.
Technology Dominance:
- IPTV is emerging as the most dominant technology segment. Its ability to deliver high-quality video content over existing internet infrastructure, coupled with the flexibility of on-demand services and personalized channel packages, makes it highly attractive to consumers. The widespread availability of high-speed internet globally is a key enabler for IPTV's ascendancy.
- Satellite/DTH continues to hold a significant market share, particularly in regions where broadband penetration is still developing or where traditional broadcast models remain prevalent. However, its growth is gradually being outpaced by IPTV.
Resolution Dominance:
- 4K (Ultra-HD) resolution is currently the dominant segment, representing the sweet spot for picture quality and affordability for a large consumer base. As prices continue to fall, adoption rates for 4K devices are exceptionally high.
- 8K is the fastest-growing segment, indicating future dominance, driven by early adopters and the availability of premium content. While adoption is still nascent, its potential for hyper-realistic viewing experiences is significant.
- HD/FHD resolutions are gradually declining in dominance for new sales but remain significant in the installed base, especially in emerging markets.
Display Size Dominance:
- 55-60 inches and 65 inches and Above display sizes are experiencing the highest growth and market share. Consumers are increasingly opting for larger screen sizes to enhance their home entertainment and immersive viewing experiences, making these segments pivotal for market growth. The trend is further fueled by the decreasing cost of larger panels.
Display Technology Dominance:
- LCD technology remains the dominant display technology due to its cost-effectiveness and widespread availability.
- QLED and OLED are rapidly gaining market share, particularly in the premium segment, offering superior color reproduction, contrast ratios, and viewing angles, thereby driving innovation and higher average selling prices.
Smart Television and Set-Top Box Market Product Landscape
The Smart Television and Set-Top Box market is characterized by a rapid pace of product innovation, focusing on enhanced user experiences and deeper integration into the digital ecosystem. Smart TVs now boast advanced AI capabilities for personalized recommendations, voice control, and seamless connectivity with other smart home devices. Set-top boxes, particularly Android TV-powered units, are evolving into comprehensive media hubs, offering access to a vast array of streaming applications, gaming, and interactive services. Product performance metrics are increasingly defined by processing power, Wi-Fi standards (e.g., Wi-Fi 6), and the ability to support the latest video and audio codecs for high-fidelity content delivery. Unique selling propositions include features like quantum dot technology for enhanced color accuracy in TVs and advanced tuners and multi-room streaming capabilities in set-top boxes. The integration of next-generation Android TV platforms by companies like Technicolor Connected Home is a prime example of how product development is aligning with consumer demand for versatile and feature-rich entertainment solutions.
Key Drivers, Barriers & Challenges in Smart Television and Set-Top Box Market
The Smart Television and Set-Top Box market is propelled by several key drivers. The insatiable consumer demand for high-definition content and immersive viewing experiences is a primary catalyst, coupled with the widespread adoption of Over-The-Top (OTT) streaming services. Technological advancements, including the development of 8K resolution, advanced display technologies like OLED and QLED, and the integration of AI and voice control, are also significant drivers. Furthermore, the increasing affordability of smart devices and the expansion of high-speed broadband infrastructure globally are making these technologies accessible to a broader consumer base.
However, the market faces several barriers and challenges. Supply chain disruptions, particularly those related to semiconductor shortages and component availability, can impact production volumes and lead times. Regulatory hurdles, such as varying broadcasting standards and content licensing complexities across different regions, can also pose challenges. Intense competitive pressures from established players and new market entrants, as well as the threat of product obsolescence due to rapid technological advancements, necessitate continuous innovation and strategic pricing. The high initial cost of premium devices like 8K TVs and the digital divide in certain regions, limiting access to high-speed internet, also present significant restraints to market growth.
Emerging Opportunities in Smart Television and Set-Top Box Market
Emerging opportunities in the Smart Television and Set-Top Box market lie in the increasing demand for personalized and interactive entertainment experiences. The expansion of the metaverse and augmented reality (AR)/virtual reality (VR) technologies presents a significant opportunity for integration with smart TVs and set-top boxes, offering new avenues for content consumption and interaction. The growing adoption of 5G technology promises faster streaming speeds and lower latency, enabling more sophisticated applications and real-time gaming experiences directly on connected devices. Furthermore, the development of specialized set-top boxes catering to niche markets, such as gaming-focused devices or elderly-friendly interfaces, offers untapped potential. The integration of advanced AI for hyper-personalized content curation and smart home control also presents a growing area for innovation and market differentiation.
Growth Accelerators in the Smart Television and Set-Top Box Market Industry
Several catalysts are accelerating the long-term growth of the Smart Television and Set-Top Box market. Technological breakthroughs, such as the ongoing refinement of OLED and QLED panel technologies leading to improved picture quality and energy efficiency, are key growth accelerators. Strategic partnerships between content providers, device manufacturers, and internet service providers are fostering a more integrated and appealing ecosystem for consumers, driving adoption and usage. Market expansion strategies, including the penetration of emerging economies with increasing disposable incomes and a growing demand for digital entertainment, are also significantly contributing to sustained growth. The continuous innovation in smart features, such as advanced voice assistants, AI-powered content discovery, and seamless multi-device connectivity, further fuels consumer interest and drives upgrades.
Key Players Shaping the Smart Television and Set-Top Box Market Market
- Hisense Group
- Gospell Digital Technology CO Limited
- TCL Electronics Holdings Limited
- Evolution Digital LLC
- Humax Holdings CO Ltd
- LG Electronics Inc
- Shenzhen Skyworth Digital Technology CO Ltd
- Shenzhen Coship Electronics CO Ltd
- Intek Digital Inc
- Arris International PLC (commscope Holding Company Inc)
- Sagemcom SAS
- ZTE Corporation
- Xiaomi Corporation
- Kaonmedia CO Ltd
- Technicolor SA
- Samsung Electronics CO Ltd
Notable Milestones in Smart Television and Set-Top Box Market Sector
- August 2022: Samsung announced the launch of its Samsung OLED in Australia, expanding its 2022 TV line-up. This new TV features over 8 million self-lit pixels powered by Quantum Dot Technology, promising brighter, more accurate highlights, and realistic colors.
- February 2022: ZTE Corporation announced the upcoming launch of its new-generation 5G media gateway set-top box (STB), the ZXV10 B960GV1, powered by Android TV, at the Mobile World Congress (MWC) 2022.
- September 2021: Technicolor deployed next-generation Android TV set-top boxes (STBs) for TIM. These STBs, based on Technicolor Connected Home's JADE platform, include Wi-Fi 6 and Android 10, enabling Italian households to access premium services from broadcasters and OTT providers like Netflix, Amazon, Infinity, Disney+, and DAZN, with future upgrades for new services.
In-Depth Smart Television and Set-Top Box Market Market Outlook
The future market outlook for Smart Televisions and Set-Top Boxes is exceptionally promising, driven by an ongoing wave of technological advancements and evolving consumer preferences. The widespread adoption of 5G, coupled with the continued development of immersive technologies like AR/VR, will unlock new dimensions of entertainment and interactivity. Strategic partnerships and the increasing integration of AI will further personalize user experiences, making these devices indispensable hubs for digital life. The sustained demand for higher resolutions and superior display technologies will continue to fuel innovation and premium product sales. Furthermore, the expansion into emerging markets, alongside a growing emphasis on sustainability and energy efficiency in device manufacturing, will shape the future trajectory of the market, presenting significant opportunities for growth and value creation.
Smart Television and Set-Top Box Market Segmentation
-
1. Technology
- 1.1. Satellite/DTH
- 1.2. IPTV
- 1.3. Cable
- 1.4. Other Types (DTT)
-
2. Resolution
- 2.1. SD
- 2.2. HD
- 2.3. Ultra-HD And Higher
-
3. Resolution
- 3.1. HD/FHD
- 3.2. 4K
- 3.3. 8K
-
4. Display Size (in Inches)
- 4.1. 32 And Below
- 4.2. 39-43
- 4.3. 48-50
- 4.4. 55-60
- 4.5. 65 And Above
-
5. Technology
- 5.1. LCD
- 5.2. OLED
- 5.3. QLED
Smart Television and Set-Top Box Market Segmentation By Geography
- 1. North America
- 2. Europe
- 3. Asia Pacific
- 4. Rest of the World
- 5. North America
- 6. Europe
- 7. Asia Pacific
- 8. Rest of the World
Smart Television and Set-Top Box Market Regional Market Share
Geographic Coverage of Smart Television and Set-Top Box Market
Smart Television and Set-Top Box Market REPORT HIGHLIGHTS
| Aspects | Details |
|---|---|
| Study Period | 2020-2034 |
| Base Year | 2025 |
| Estimated Year | 2026 |
| Forecast Period | 2026-2034 |
| Historical Period | 2020-2025 |
| Growth Rate | CAGR of 3.9% from 2020-2034 |
| Segmentation |
|
Table of Contents
- 1. Introduction
- 1.1. Research Scope
- 1.2. Market Segmentation
- 1.3. Research Objective
- 1.4. Definitions and Assumptions
- 2. Executive Summary
- 2.1. Market Snapshot
- 3. Market Dynamics
- 3.1. Market Drivers
- 3.2. Market Restrains
- 3.3. Market Trends
- 3.4. Market Opportunities
- 4. Market Factor Analysis
- 4.1. Porters Five Forces
- 4.1.1. Bargaining Power of Suppliers
- 4.1.2. Bargaining Power of Buyers
- 4.1.3. Threat of New Entrants
- 4.1.4. Threat of Substitutes
- 4.1.5. Competitive Rivalry
- 4.2. PESTEL analysis
- 4.3. BCG Analysis
- 4.3.1. Stars (High Growth, High Market Share)
- 4.3.2. Cash Cows (Low Growth, High Market Share)
- 4.3.3. Question Mark (High Growth, Low Market Share)
- 4.3.4. Dogs (Low Growth, Low Market Share)
- 4.4. Ansoff Matrix Analysis
- 4.5. Supply Chain Analysis
- 4.6. Regulatory Landscape
- 4.7. Current Market Potential and Opportunity Assessment (TAM–SAM–SOM Framework)
- 4.8. NRP Analyst Note
- 4.1. Porters Five Forces
- 5. Market Analysis, Insights and Forecast 2021-2033
- 5.1. Market Analysis, Insights and Forecast - by Technology
- 5.1.1. Satellite/DTH
- 5.1.2. IPTV
- 5.1.3. Cable
- 5.1.4. Other Types (DTT)
- 5.2. Market Analysis, Insights and Forecast - by Resolution
- 5.2.1. SD
- 5.2.2. HD
- 5.2.3. Ultra-HD And Higher
- 5.3. Market Analysis, Insights and Forecast - by Resolution
- 5.3.1. HD/FHD
- 5.3.2. 4K
- 5.3.3. 8K
- 5.4. Market Analysis, Insights and Forecast - by Display Size (in Inches)
- 5.4.1. 32 And Below
- 5.4.2. 39-43
- 5.4.3. 48-50
- 5.4.4. 55-60
- 5.4.5. 65 And Above
- 5.5. Market Analysis, Insights and Forecast - by Technology
- 5.5.1. LCD
- 5.5.2. OLED
- 5.5.3. QLED
- 5.6. Market Analysis, Insights and Forecast - by Region
- 5.6.1. North America
- 5.6.2. Europe
- 5.6.3. Asia Pacific
- 5.6.4. Rest of the World
- 5.6.5. North America
- 5.6.6. Europe
- 5.6.7. Asia Pacific
- 5.6.8. Rest of the World
- 5.1. Market Analysis, Insights and Forecast - by Technology
- 6. Global Smart Television and Set-Top Box Market Analysis, Insights and Forecast, 2021-2033
- 6.1. Market Analysis, Insights and Forecast - by Technology
- 6.1.1. Satellite/DTH
- 6.1.2. IPTV
- 6.1.3. Cable
- 6.1.4. Other Types (DTT)
- 6.2. Market Analysis, Insights and Forecast - by Resolution
- 6.2.1. SD
- 6.2.2. HD
- 6.2.3. Ultra-HD And Higher
- 6.3. Market Analysis, Insights and Forecast - by Resolution
- 6.3.1. HD/FHD
- 6.3.2. 4K
- 6.3.3. 8K
- 6.4. Market Analysis, Insights and Forecast - by Display Size (in Inches)
- 6.4.1. 32 And Below
- 6.4.2. 39-43
- 6.4.3. 48-50
- 6.4.4. 55-60
- 6.4.5. 65 And Above
- 6.5. Market Analysis, Insights and Forecast - by Technology
- 6.5.1. LCD
- 6.5.2. OLED
- 6.5.3. QLED
- 6.1. Market Analysis, Insights and Forecast - by Technology
- 7. North America Smart Television and Set-Top Box Market Analysis, Insights and Forecast, 2020-2032
- 7.1. Market Analysis, Insights and Forecast - by Technology
- 7.1.1. Satellite/DTH
- 7.1.2. IPTV
- 7.1.3. Cable
- 7.1.4. Other Types (DTT)
- 7.2. Market Analysis, Insights and Forecast - by Resolution
- 7.2.1. SD
- 7.2.2. HD
- 7.2.3. Ultra-HD And Higher
- 7.3. Market Analysis, Insights and Forecast - by Resolution
- 7.3.1. HD/FHD
- 7.3.2. 4K
- 7.3.3. 8K
- 7.4. Market Analysis, Insights and Forecast - by Display Size (in Inches)
- 7.4.1. 32 And Below
- 7.4.2. 39-43
- 7.4.3. 48-50
- 7.4.4. 55-60
- 7.4.5. 65 And Above
- 7.5. Market Analysis, Insights and Forecast - by Technology
- 7.5.1. LCD
- 7.5.2. OLED
- 7.5.3. QLED
- 7.1. Market Analysis, Insights and Forecast - by Technology
- 8. Europe Smart Television and Set-Top Box Market Analysis, Insights and Forecast, 2020-2032
- 8.1. Market Analysis, Insights and Forecast - by Technology
- 8.1.1. Satellite/DTH
- 8.1.2. IPTV
- 8.1.3. Cable
- 8.1.4. Other Types (DTT)
- 8.2. Market Analysis, Insights and Forecast - by Resolution
- 8.2.1. SD
- 8.2.2. HD
- 8.2.3. Ultra-HD And Higher
- 8.3. Market Analysis, Insights and Forecast - by Resolution
- 8.3.1. HD/FHD
- 8.3.2. 4K
- 8.3.3. 8K
- 8.4. Market Analysis, Insights and Forecast - by Display Size (in Inches)
- 8.4.1. 32 And Below
- 8.4.2. 39-43
- 8.4.3. 48-50
- 8.4.4. 55-60
- 8.4.5. 65 And Above
- 8.5. Market Analysis, Insights and Forecast - by Technology
- 8.5.1. LCD
- 8.5.2. OLED
- 8.5.3. QLED
- 8.1. Market Analysis, Insights and Forecast - by Technology
- 9. Asia Pacific Smart Television and Set-Top Box Market Analysis, Insights and Forecast, 2020-2032
- 9.1. Market Analysis, Insights and Forecast - by Technology
- 9.1.1. Satellite/DTH
- 9.1.2. IPTV
- 9.1.3. Cable
- 9.1.4. Other Types (DTT)
- 9.2. Market Analysis, Insights and Forecast - by Resolution
- 9.2.1. SD
- 9.2.2. HD
- 9.2.3. Ultra-HD And Higher
- 9.3. Market Analysis, Insights and Forecast - by Resolution
- 9.3.1. HD/FHD
- 9.3.2. 4K
- 9.3.3. 8K
- 9.4. Market Analysis, Insights and Forecast - by Display Size (in Inches)
- 9.4.1. 32 And Below
- 9.4.2. 39-43
- 9.4.3. 48-50
- 9.4.4. 55-60
- 9.4.5. 65 And Above
- 9.5. Market Analysis, Insights and Forecast - by Technology
- 9.5.1. LCD
- 9.5.2. OLED
- 9.5.3. QLED
- 9.1. Market Analysis, Insights and Forecast - by Technology
- 10. Rest of the World Smart Television and Set-Top Box Market Analysis, Insights and Forecast, 2020-2032
- 10.1. Market Analysis, Insights and Forecast - by Technology
- 10.1.1. Satellite/DTH
- 10.1.2. IPTV
- 10.1.3. Cable
- 10.1.4. Other Types (DTT)
- 10.2. Market Analysis, Insights and Forecast - by Resolution
- 10.2.1. SD
- 10.2.2. HD
- 10.2.3. Ultra-HD And Higher
- 10.3. Market Analysis, Insights and Forecast - by Resolution
- 10.3.1. HD/FHD
- 10.3.2. 4K
- 10.3.3. 8K
- 10.4. Market Analysis, Insights and Forecast - by Display Size (in Inches)
- 10.4.1. 32 And Below
- 10.4.2. 39-43
- 10.4.3. 48-50
- 10.4.4. 55-60
- 10.4.5. 65 And Above
- 10.5. Market Analysis, Insights and Forecast - by Technology
- 10.5.1. LCD
- 10.5.2. OLED
- 10.5.3. QLED
- 10.1. Market Analysis, Insights and Forecast - by Technology
- 11. North America Smart Television and Set-Top Box Market Analysis, Insights and Forecast, 2020-2032
- 11.1. Market Analysis, Insights and Forecast - by Technology
- 11.1.1. Satellite/DTH
- 11.1.2. IPTV
- 11.1.3. Cable
- 11.1.4. Other Types (DTT)
- 11.2. Market Analysis, Insights and Forecast - by Resolution
- 11.2.1. SD
- 11.2.2. HD
- 11.2.3. Ultra-HD And Higher
- 11.3. Market Analysis, Insights and Forecast - by Resolution
- 11.3.1. HD/FHD
- 11.3.2. 4K
- 11.3.3. 8K
- 11.4. Market Analysis, Insights and Forecast - by Display Size (in Inches)
- 11.4.1. 32 And Below
- 11.4.2. 39-43
- 11.4.3. 48-50
- 11.4.4. 55-60
- 11.4.5. 65 And Above
- 11.5. Market Analysis, Insights and Forecast - by Technology
- 11.5.1. LCD
- 11.5.2. OLED
- 11.5.3. QLED
- 11.1. Market Analysis, Insights and Forecast - by Technology
- 12. Europe Smart Television and Set-Top Box Market Analysis, Insights and Forecast, 2020-2032
- 12.1. Market Analysis, Insights and Forecast - by Technology
- 12.1.1. Satellite/DTH
- 12.1.2. IPTV
- 12.1.3. Cable
- 12.1.4. Other Types (DTT)
- 12.2. Market Analysis, Insights and Forecast - by Resolution
- 12.2.1. SD
- 12.2.2. HD
- 12.2.3. Ultra-HD And Higher
- 12.3. Market Analysis, Insights and Forecast - by Resolution
- 12.3.1. HD/FHD
- 12.3.2. 4K
- 12.3.3. 8K
- 12.4. Market Analysis, Insights and Forecast - by Display Size (in Inches)
- 12.4.1. 32 And Below
- 12.4.2. 39-43
- 12.4.3. 48-50
- 12.4.4. 55-60
- 12.4.5. 65 And Above
- 12.5. Market Analysis, Insights and Forecast - by Technology
- 12.5.1. LCD
- 12.5.2. OLED
- 12.5.3. QLED
- 12.1. Market Analysis, Insights and Forecast - by Technology
- 13. Asia Pacific Smart Television and Set-Top Box Market Analysis, Insights and Forecast, 2020-2032
- 13.1. Market Analysis, Insights and Forecast - by Technology
- 13.1.1. Satellite/DTH
- 13.1.2. IPTV
- 13.1.3. Cable
- 13.1.4. Other Types (DTT)
- 13.2. Market Analysis, Insights and Forecast - by Resolution
- 13.2.1. SD
- 13.2.2. HD
- 13.2.3. Ultra-HD And Higher
- 13.3. Market Analysis, Insights and Forecast - by Resolution
- 13.3.1. HD/FHD
- 13.3.2. 4K
- 13.3.3. 8K
- 13.4. Market Analysis, Insights and Forecast - by Display Size (in Inches)
- 13.4.1. 32 And Below
- 13.4.2. 39-43
- 13.4.3. 48-50
- 13.4.4. 55-60
- 13.4.5. 65 And Above
- 13.5. Market Analysis, Insights and Forecast - by Technology
- 13.5.1. LCD
- 13.5.2. OLED
- 13.5.3. QLED
- 13.1. Market Analysis, Insights and Forecast - by Technology
- 14. Rest of the World Smart Television and Set-Top Box Market Analysis, Insights and Forecast, 2020-2032
- 14.1. Market Analysis, Insights and Forecast - by Technology
- 14.1.1. Satellite/DTH
- 14.1.2. IPTV
- 14.1.3. Cable
- 14.1.4. Other Types (DTT)
- 14.2. Market Analysis, Insights and Forecast - by Resolution
- 14.2.1. SD
- 14.2.2. HD
- 14.2.3. Ultra-HD And Higher
- 14.3. Market Analysis, Insights and Forecast - by Resolution
- 14.3.1. HD/FHD
- 14.3.2. 4K
- 14.3.3. 8K
- 14.4. Market Analysis, Insights and Forecast - by Display Size (in Inches)
- 14.4.1. 32 And Below
- 14.4.2. 39-43
- 14.4.3. 48-50
- 14.4.4. 55-60
- 14.4.5. 65 And Above
- 14.5. Market Analysis, Insights and Forecast - by Technology
- 14.5.1. LCD
- 14.5.2. OLED
- 14.5.3. QLED
- 14.1. Market Analysis, Insights and Forecast - by Technology
- 15. Competitive Analysis
- 15.1. Company Profiles
- 15.1.1 Hisense Group
- 15.1.1.1. Company Overview
- 15.1.1.2. Products
- 15.1.1.3. Company Financials
- 15.1.1.4. SWOT Analysis
- 15.1.2 Gospell Digital Technology CO Limited
- 15.1.2.1. Company Overview
- 15.1.2.2. Products
- 15.1.2.3. Company Financials
- 15.1.2.4. SWOT Analysis
- 15.1.3 TCL Electronics Holdings Limited
- 15.1.3.1. Company Overview
- 15.1.3.2. Products
- 15.1.3.3. Company Financials
- 15.1.3.4. SWOT Analysis
- 15.1.4 Evolution Digital LLC
- 15.1.4.1. Company Overview
- 15.1.4.2. Products
- 15.1.4.3. Company Financials
- 15.1.4.4. SWOT Analysis
- 15.1.5 Humax Holdings CO Ltd
- 15.1.5.1. Company Overview
- 15.1.5.2. Products
- 15.1.5.3. Company Financials
- 15.1.5.4. SWOT Analysis
- 15.1.6 LG Electronics Inc
- 15.1.6.1. Company Overview
- 15.1.6.2. Products
- 15.1.6.3. Company Financials
- 15.1.6.4. SWOT Analysis
- 15.1.7 Shenzhen Skyworth Digital Technology CO Ltd
- 15.1.7.1. Company Overview
- 15.1.7.2. Products
- 15.1.7.3. Company Financials
- 15.1.7.4. SWOT Analysis
- 15.1.8 Shenzhen Coship Electronics CO Ltd
- 15.1.8.1. Company Overview
- 15.1.8.2. Products
- 15.1.8.3. Company Financials
- 15.1.8.4. SWOT Analysis
- 15.1.9 Intek Digital Inc
- 15.1.9.1. Company Overview
- 15.1.9.2. Products
- 15.1.9.3. Company Financials
- 15.1.9.4. SWOT Analysis
- 15.1.10 Arris International PLC (commscope Holding Company Inc)
- 15.1.10.1. Company Overview
- 15.1.10.2. Products
- 15.1.10.3. Company Financials
- 15.1.10.4. SWOT Analysis
- 15.1.11 Sagemcom SAS
- 15.1.11.1. Company Overview
- 15.1.11.2. Products
- 15.1.11.3. Company Financials
- 15.1.11.4. SWOT Analysis
- 15.1.12 ZTE Corporation
- 15.1.12.1. Company Overview
- 15.1.12.2. Products
- 15.1.12.3. Company Financials
- 15.1.12.4. SWOT Analysis
- 15.1.13 Xiaomi Corporatio
- 15.1.13.1. Company Overview
- 15.1.13.2. Products
- 15.1.13.3. Company Financials
- 15.1.13.4. SWOT Analysis
- 15.1.14 Kaonmedia CO Ltd
- 15.1.14.1. Company Overview
- 15.1.14.2. Products
- 15.1.14.3. Company Financials
- 15.1.14.4. SWOT Analysis
- 15.1.15 Technicolor SA
- 15.1.15.1. Company Overview
- 15.1.15.2. Products
- 15.1.15.3. Company Financials
- 15.1.15.4. SWOT Analysis
- 15.1.16 Samsung Electronics CO Ltd
- 15.1.16.1. Company Overview
- 15.1.16.2. Products
- 15.1.16.3. Company Financials
- 15.1.16.4. SWOT Analysis
- 15.1.1 Hisense Group
- 15.2. Market Entropy
- 15.2.1 Company's Key Areas Served
- 15.2.2 Recent Developments
- 15.3. Company Market Share Analysis 2025
- 15.3.1 Top 5 Companies Market Share Analysis
- 15.3.2 Top 3 Companies Market Share Analysis
- 15.4. List of Potential Customers
- 16. Research Methodology
List of Figures
- Figure 1: Global Smart Television and Set-Top Box Market Revenue Breakdown (billion, %) by Region 2025 & 2033
- Figure 2: Global Smart Television and Set-Top Box Market Volume Breakdown (K Unit, %) by Region 2025 & 2033
- Figure 3: North America Smart Television and Set-Top Box Market Revenue (billion), by Technology 2025 & 2033
- Figure 4: North America Smart Television and Set-Top Box Market Volume (K Unit), by Technology 2025 & 2033
- Figure 5: North America Smart Television and Set-Top Box Market Revenue Share (%), by Technology 2025 & 2033
- Figure 6: North America Smart Television and Set-Top Box Market Volume Share (%), by Technology 2025 & 2033
- Figure 7: North America Smart Television and Set-Top Box Market Revenue (billion), by Resolution 2025 & 2033
- Figure 8: North America Smart Television and Set-Top Box Market Volume (K Unit), by Resolution 2025 & 2033
- Figure 9: North America Smart Television and Set-Top Box Market Revenue Share (%), by Resolution 2025 & 2033
- Figure 10: North America Smart Television and Set-Top Box Market Volume Share (%), by Resolution 2025 & 2033
- Figure 11: North America Smart Television and Set-Top Box Market Revenue (billion), by Resolution 2025 & 2033
- Figure 12: North America Smart Television and Set-Top Box Market Volume (K Unit), by Resolution 2025 & 2033
- Figure 13: North America Smart Television and Set-Top Box Market Revenue Share (%), by Resolution 2025 & 2033
- Figure 14: North America Smart Television and Set-Top Box Market Volume Share (%), by Resolution 2025 & 2033
- Figure 15: North America Smart Television and Set-Top Box Market Revenue (billion), by Display Size (in Inches) 2025 & 2033
- Figure 16: North America Smart Television and Set-Top Box Market Volume (K Unit), by Display Size (in Inches) 2025 & 2033
- Figure 17: North America Smart Television and Set-Top Box Market Revenue Share (%), by Display Size (in Inches) 2025 & 2033
- Figure 18: North America Smart Television and Set-Top Box Market Volume Share (%), by Display Size (in Inches) 2025 & 2033
- Figure 19: North America Smart Television and Set-Top Box Market Revenue (billion), by Technology 2025 & 2033
- Figure 20: North America Smart Television and Set-Top Box Market Volume (K Unit), by Technology 2025 & 2033
- Figure 21: North America Smart Television and Set-Top Box Market Revenue Share (%), by Technology 2025 & 2033
- Figure 22: North America Smart Television and Set-Top Box Market Volume Share (%), by Technology 2025 & 2033
- Figure 23: North America Smart Television and Set-Top Box Market Revenue (billion), by Country 2025 & 2033
- Figure 24: North America Smart Television and Set-Top Box Market Volume (K Unit), by Country 2025 & 2033
- Figure 25: North America Smart Television and Set-Top Box Market Revenue Share (%), by Country 2025 & 2033
- Figure 26: North America Smart Television and Set-Top Box Market Volume Share (%), by Country 2025 & 2033
- Figure 27: Europe Smart Television and Set-Top Box Market Revenue (billion), by Technology 2025 & 2033
- Figure 28: Europe Smart Television and Set-Top Box Market Volume (K Unit), by Technology 2025 & 2033
- Figure 29: Europe Smart Television and Set-Top Box Market Revenue Share (%), by Technology 2025 & 2033
- Figure 30: Europe Smart Television and Set-Top Box Market Volume Share (%), by Technology 2025 & 2033
- Figure 31: Europe Smart Television and Set-Top Box Market Revenue (billion), by Resolution 2025 & 2033
- Figure 32: Europe Smart Television and Set-Top Box Market Volume (K Unit), by Resolution 2025 & 2033
- Figure 33: Europe Smart Television and Set-Top Box Market Revenue Share (%), by Resolution 2025 & 2033
- Figure 34: Europe Smart Television and Set-Top Box Market Volume Share (%), by Resolution 2025 & 2033
- Figure 35: Europe Smart Television and Set-Top Box Market Revenue (billion), by Resolution 2025 & 2033
- Figure 36: Europe Smart Television and Set-Top Box Market Volume (K Unit), by Resolution 2025 & 2033
- Figure 37: Europe Smart Television and Set-Top Box Market Revenue Share (%), by Resolution 2025 & 2033
- Figure 38: Europe Smart Television and Set-Top Box Market Volume Share (%), by Resolution 2025 & 2033
- Figure 39: Europe Smart Television and Set-Top Box Market Revenue (billion), by Display Size (in Inches) 2025 & 2033
- Figure 40: Europe Smart Television and Set-Top Box Market Volume (K Unit), by Display Size (in Inches) 2025 & 2033
- Figure 41: Europe Smart Television and Set-Top Box Market Revenue Share (%), by Display Size (in Inches) 2025 & 2033
- Figure 42: Europe Smart Television and Set-Top Box Market Volume Share (%), by Display Size (in Inches) 2025 & 2033
- Figure 43: Europe Smart Television and Set-Top Box Market Revenue (billion), by Technology 2025 & 2033
- Figure 44: Europe Smart Television and Set-Top Box Market Volume (K Unit), by Technology 2025 & 2033
- Figure 45: Europe Smart Television and Set-Top Box Market Revenue Share (%), by Technology 2025 & 2033
- Figure 46: Europe Smart Television and Set-Top Box Market Volume Share (%), by Technology 2025 & 2033
- Figure 47: Europe Smart Television and Set-Top Box Market Revenue (billion), by Country 2025 & 2033
- Figure 48: Europe Smart Television and Set-Top Box Market Volume (K Unit), by Country 2025 & 2033
- Figure 49: Europe Smart Television and Set-Top Box Market Revenue Share (%), by Country 2025 & 2033
- Figure 50: Europe Smart Television and Set-Top Box Market Volume Share (%), by Country 2025 & 2033
- Figure 51: Asia Pacific Smart Television and Set-Top Box Market Revenue (billion), by Technology 2025 & 2033
- Figure 52: Asia Pacific Smart Television and Set-Top Box Market Volume (K Unit), by Technology 2025 & 2033
- Figure 53: Asia Pacific Smart Television and Set-Top Box Market Revenue Share (%), by Technology 2025 & 2033
- Figure 54: Asia Pacific Smart Television and Set-Top Box Market Volume Share (%), by Technology 2025 & 2033
- Figure 55: Asia Pacific Smart Television and Set-Top Box Market Revenue (billion), by Resolution 2025 & 2033
- Figure 56: Asia Pacific Smart Television and Set-Top Box Market Volume (K Unit), by Resolution 2025 & 2033
- Figure 57: Asia Pacific Smart Television and Set-Top Box Market Revenue Share (%), by Resolution 2025 & 2033
- Figure 58: Asia Pacific Smart Television and Set-Top Box Market Volume Share (%), by Resolution 2025 & 2033
- Figure 59: Asia Pacific Smart Television and Set-Top Box Market Revenue (billion), by Resolution 2025 & 2033
- Figure 60: Asia Pacific Smart Television and Set-Top Box Market Volume (K Unit), by Resolution 2025 & 2033
- Figure 61: Asia Pacific Smart Television and Set-Top Box Market Revenue Share (%), by Resolution 2025 & 2033
- Figure 62: Asia Pacific Smart Television and Set-Top Box Market Volume Share (%), by Resolution 2025 & 2033
- Figure 63: Asia Pacific Smart Television and Set-Top Box Market Revenue (billion), by Display Size (in Inches) 2025 & 2033
- Figure 64: Asia Pacific Smart Television and Set-Top Box Market Volume (K Unit), by Display Size (in Inches) 2025 & 2033
- Figure 65: Asia Pacific Smart Television and Set-Top Box Market Revenue Share (%), by Display Size (in Inches) 2025 & 2033
- Figure 66: Asia Pacific Smart Television and Set-Top Box Market Volume Share (%), by Display Size (in Inches) 2025 & 2033
- Figure 67: Asia Pacific Smart Television and Set-Top Box Market Revenue (billion), by Technology 2025 & 2033
- Figure 68: Asia Pacific Smart Television and Set-Top Box Market Volume (K Unit), by Technology 2025 & 2033
- Figure 69: Asia Pacific Smart Television and Set-Top Box Market Revenue Share (%), by Technology 2025 & 2033
- Figure 70: Asia Pacific Smart Television and Set-Top Box Market Volume Share (%), by Technology 2025 & 2033
- Figure 71: Asia Pacific Smart Television and Set-Top Box Market Revenue (billion), by Country 2025 & 2033
- Figure 72: Asia Pacific Smart Television and Set-Top Box Market Volume (K Unit), by Country 2025 & 2033
- Figure 73: Asia Pacific Smart Television and Set-Top Box Market Revenue Share (%), by Country 2025 & 2033
- Figure 74: Asia Pacific Smart Television and Set-Top Box Market Volume Share (%), by Country 2025 & 2033
- Figure 75: Rest of the World Smart Television and Set-Top Box Market Revenue (billion), by Technology 2025 & 2033
- Figure 76: Rest of the World Smart Television and Set-Top Box Market Volume (K Unit), by Technology 2025 & 2033
- Figure 77: Rest of the World Smart Television and Set-Top Box Market Revenue Share (%), by Technology 2025 & 2033
- Figure 78: Rest of the World Smart Television and Set-Top Box Market Volume Share (%), by Technology 2025 & 2033
- Figure 79: Rest of the World Smart Television and Set-Top Box Market Revenue (billion), by Resolution 2025 & 2033
- Figure 80: Rest of the World Smart Television and Set-Top Box Market Volume (K Unit), by Resolution 2025 & 2033
- Figure 81: Rest of the World Smart Television and Set-Top Box Market Revenue Share (%), by Resolution 2025 & 2033
- Figure 82: Rest of the World Smart Television and Set-Top Box Market Volume Share (%), by Resolution 2025 & 2033
- Figure 83: Rest of the World Smart Television and Set-Top Box Market Revenue (billion), by Resolution 2025 & 2033
- Figure 84: Rest of the World Smart Television and Set-Top Box Market Volume (K Unit), by Resolution 2025 & 2033
- Figure 85: Rest of the World Smart Television and Set-Top Box Market Revenue Share (%), by Resolution 2025 & 2033
- Figure 86: Rest of the World Smart Television and Set-Top Box Market Volume Share (%), by Resolution 2025 & 2033
- Figure 87: Rest of the World Smart Television and Set-Top Box Market Revenue (billion), by Display Size (in Inches) 2025 & 2033
- Figure 88: Rest of the World Smart Television and Set-Top Box Market Volume (K Unit), by Display Size (in Inches) 2025 & 2033
- Figure 89: Rest of the World Smart Television and Set-Top Box Market Revenue Share (%), by Display Size (in Inches) 2025 & 2033
- Figure 90: Rest of the World Smart Television and Set-Top Box Market Volume Share (%), by Display Size (in Inches) 2025 & 2033
- Figure 91: Rest of the World Smart Television and Set-Top Box Market Revenue (billion), by Technology 2025 & 2033
- Figure 92: Rest of the World Smart Television and Set-Top Box Market Volume (K Unit), by Technology 2025 & 2033
- Figure 93: Rest of the World Smart Television and Set-Top Box Market Revenue Share (%), by Technology 2025 & 2033
- Figure 94: Rest of the World Smart Television and Set-Top Box Market Volume Share (%), by Technology 2025 & 2033
- Figure 95: Rest of the World Smart Television and Set-Top Box Market Revenue (billion), by Country 2025 & 2033
- Figure 96: Rest of the World Smart Television and Set-Top Box Market Volume (K Unit), by Country 2025 & 2033
- Figure 97: Rest of the World Smart Television and Set-Top Box Market Revenue Share (%), by Country 2025 & 2033
- Figure 98: Rest of the World Smart Television and Set-Top Box Market Volume Share (%), by Country 2025 & 2033
- Figure 99: North America Smart Television and Set-Top Box Market Revenue (billion), by Technology 2025 & 2033
- Figure 100: North America Smart Television and Set-Top Box Market Volume (K Unit), by Technology 2025 & 2033
- Figure 101: North America Smart Television and Set-Top Box Market Revenue Share (%), by Technology 2025 & 2033
- Figure 102: North America Smart Television and Set-Top Box Market Volume Share (%), by Technology 2025 & 2033
- Figure 103: North America Smart Television and Set-Top Box Market Revenue (billion), by Resolution 2025 & 2033
- Figure 104: North America Smart Television and Set-Top Box Market Volume (K Unit), by Resolution 2025 & 2033
- Figure 105: North America Smart Television and Set-Top Box Market Revenue Share (%), by Resolution 2025 & 2033
- Figure 106: North America Smart Television and Set-Top Box Market Volume Share (%), by Resolution 2025 & 2033
- Figure 107: North America Smart Television and Set-Top Box Market Revenue (billion), by Resolution 2025 & 2033
- Figure 108: North America Smart Television and Set-Top Box Market Volume (K Unit), by Resolution 2025 & 2033
- Figure 109: North America Smart Television and Set-Top Box Market Revenue Share (%), by Resolution 2025 & 2033
- Figure 110: North America Smart Television and Set-Top Box Market Volume Share (%), by Resolution 2025 & 2033
- Figure 111: North America Smart Television and Set-Top Box Market Revenue (billion), by Display Size (in Inches) 2025 & 2033
- Figure 112: North America Smart Television and Set-Top Box Market Volume (K Unit), by Display Size (in Inches) 2025 & 2033
- Figure 113: North America Smart Television and Set-Top Box Market Revenue Share (%), by Display Size (in Inches) 2025 & 2033
- Figure 114: North America Smart Television and Set-Top Box Market Volume Share (%), by Display Size (in Inches) 2025 & 2033
- Figure 115: North America Smart Television and Set-Top Box Market Revenue (billion), by Technology 2025 & 2033
- Figure 116: North America Smart Television and Set-Top Box Market Volume (K Unit), by Technology 2025 & 2033
- Figure 117: North America Smart Television and Set-Top Box Market Revenue Share (%), by Technology 2025 & 2033
- Figure 118: North America Smart Television and Set-Top Box Market Volume Share (%), by Technology 2025 & 2033
- Figure 119: North America Smart Television and Set-Top Box Market Revenue (billion), by Country 2025 & 2033
- Figure 120: North America Smart Television and Set-Top Box Market Volume (K Unit), by Country 2025 & 2033
- Figure 121: North America Smart Television and Set-Top Box Market Revenue Share (%), by Country 2025 & 2033
- Figure 122: North America Smart Television and Set-Top Box Market Volume Share (%), by Country 2025 & 2033
- Figure 123: Europe Smart Television and Set-Top Box Market Revenue (billion), by Technology 2025 & 2033
- Figure 124: Europe Smart Television and Set-Top Box Market Volume (K Unit), by Technology 2025 & 2033
- Figure 125: Europe Smart Television and Set-Top Box Market Revenue Share (%), by Technology 2025 & 2033
- Figure 126: Europe Smart Television and Set-Top Box Market Volume Share (%), by Technology 2025 & 2033
- Figure 127: Europe Smart Television and Set-Top Box Market Revenue (billion), by Resolution 2025 & 2033
- Figure 128: Europe Smart Television and Set-Top Box Market Volume (K Unit), by Resolution 2025 & 2033
- Figure 129: Europe Smart Television and Set-Top Box Market Revenue Share (%), by Resolution 2025 & 2033
- Figure 130: Europe Smart Television and Set-Top Box Market Volume Share (%), by Resolution 2025 & 2033
- Figure 131: Europe Smart Television and Set-Top Box Market Revenue (billion), by Resolution 2025 & 2033
- Figure 132: Europe Smart Television and Set-Top Box Market Volume (K Unit), by Resolution 2025 & 2033
- Figure 133: Europe Smart Television and Set-Top Box Market Revenue Share (%), by Resolution 2025 & 2033
- Figure 134: Europe Smart Television and Set-Top Box Market Volume Share (%), by Resolution 2025 & 2033
- Figure 135: Europe Smart Television and Set-Top Box Market Revenue (billion), by Display Size (in Inches) 2025 & 2033
- Figure 136: Europe Smart Television and Set-Top Box Market Volume (K Unit), by Display Size (in Inches) 2025 & 2033
- Figure 137: Europe Smart Television and Set-Top Box Market Revenue Share (%), by Display Size (in Inches) 2025 & 2033
- Figure 138: Europe Smart Television and Set-Top Box Market Volume Share (%), by Display Size (in Inches) 2025 & 2033
- Figure 139: Europe Smart Television and Set-Top Box Market Revenue (billion), by Technology 2025 & 2033
- Figure 140: Europe Smart Television and Set-Top Box Market Volume (K Unit), by Technology 2025 & 2033
- Figure 141: Europe Smart Television and Set-Top Box Market Revenue Share (%), by Technology 2025 & 2033
- Figure 142: Europe Smart Television and Set-Top Box Market Volume Share (%), by Technology 2025 & 2033
- Figure 143: Europe Smart Television and Set-Top Box Market Revenue (billion), by Country 2025 & 2033
- Figure 144: Europe Smart Television and Set-Top Box Market Volume (K Unit), by Country 2025 & 2033
- Figure 145: Europe Smart Television and Set-Top Box Market Revenue Share (%), by Country 2025 & 2033
- Figure 146: Europe Smart Television and Set-Top Box Market Volume Share (%), by Country 2025 & 2033
- Figure 147: Asia Pacific Smart Television and Set-Top Box Market Revenue (billion), by Technology 2025 & 2033
- Figure 148: Asia Pacific Smart Television and Set-Top Box Market Volume (K Unit), by Technology 2025 & 2033
- Figure 149: Asia Pacific Smart Television and Set-Top Box Market Revenue Share (%), by Technology 2025 & 2033
- Figure 150: Asia Pacific Smart Television and Set-Top Box Market Volume Share (%), by Technology 2025 & 2033
- Figure 151: Asia Pacific Smart Television and Set-Top Box Market Revenue (billion), by Resolution 2025 & 2033
- Figure 152: Asia Pacific Smart Television and Set-Top Box Market Volume (K Unit), by Resolution 2025 & 2033
- Figure 153: Asia Pacific Smart Television and Set-Top Box Market Revenue Share (%), by Resolution 2025 & 2033
- Figure 154: Asia Pacific Smart Television and Set-Top Box Market Volume Share (%), by Resolution 2025 & 2033
- Figure 155: Asia Pacific Smart Television and Set-Top Box Market Revenue (billion), by Resolution 2025 & 2033
- Figure 156: Asia Pacific Smart Television and Set-Top Box Market Volume (K Unit), by Resolution 2025 & 2033
- Figure 157: Asia Pacific Smart Television and Set-Top Box Market Revenue Share (%), by Resolution 2025 & 2033
- Figure 158: Asia Pacific Smart Television and Set-Top Box Market Volume Share (%), by Resolution 2025 & 2033
- Figure 159: Asia Pacific Smart Television and Set-Top Box Market Revenue (billion), by Display Size (in Inches) 2025 & 2033
- Figure 160: Asia Pacific Smart Television and Set-Top Box Market Volume (K Unit), by Display Size (in Inches) 2025 & 2033
- Figure 161: Asia Pacific Smart Television and Set-Top Box Market Revenue Share (%), by Display Size (in Inches) 2025 & 2033
- Figure 162: Asia Pacific Smart Television and Set-Top Box Market Volume Share (%), by Display Size (in Inches) 2025 & 2033
- Figure 163: Asia Pacific Smart Television and Set-Top Box Market Revenue (billion), by Technology 2025 & 2033
- Figure 164: Asia Pacific Smart Television and Set-Top Box Market Volume (K Unit), by Technology 2025 & 2033
- Figure 165: Asia Pacific Smart Television and Set-Top Box Market Revenue Share (%), by Technology 2025 & 2033
- Figure 166: Asia Pacific Smart Television and Set-Top Box Market Volume Share (%), by Technology 2025 & 2033
- Figure 167: Asia Pacific Smart Television and Set-Top Box Market Revenue (billion), by Country 2025 & 2033
- Figure 168: Asia Pacific Smart Television and Set-Top Box Market Volume (K Unit), by Country 2025 & 2033
- Figure 169: Asia Pacific Smart Television and Set-Top Box Market Revenue Share (%), by Country 2025 & 2033
- Figure 170: Asia Pacific Smart Television and Set-Top Box Market Volume Share (%), by Country 2025 & 2033
- Figure 171: Rest of the World Smart Television and Set-Top Box Market Revenue (billion), by Technology 2025 & 2033
- Figure 172: Rest of the World Smart Television and Set-Top Box Market Volume (K Unit), by Technology 2025 & 2033
- Figure 173: Rest of the World Smart Television and Set-Top Box Market Revenue Share (%), by Technology 2025 & 2033
- Figure 174: Rest of the World Smart Television and Set-Top Box Market Volume Share (%), by Technology 2025 & 2033
- Figure 175: Rest of the World Smart Television and Set-Top Box Market Revenue (billion), by Resolution 2025 & 2033
- Figure 176: Rest of the World Smart Television and Set-Top Box Market Volume (K Unit), by Resolution 2025 & 2033
- Figure 177: Rest of the World Smart Television and Set-Top Box Market Revenue Share (%), by Resolution 2025 & 2033
- Figure 178: Rest of the World Smart Television and Set-Top Box Market Volume Share (%), by Resolution 2025 & 2033
- Figure 179: Rest of the World Smart Television and Set-Top Box Market Revenue (billion), by Resolution 2025 & 2033
- Figure 180: Rest of the World Smart Television and Set-Top Box Market Volume (K Unit), by Resolution 2025 & 2033
- Figure 181: Rest of the World Smart Television and Set-Top Box Market Revenue Share (%), by Resolution 2025 & 2033
- Figure 182: Rest of the World Smart Television and Set-Top Box Market Volume Share (%), by Resolution 2025 & 2033
- Figure 183: Rest of the World Smart Television and Set-Top Box Market Revenue (billion), by Display Size (in Inches) 2025 & 2033
- Figure 184: Rest of the World Smart Television and Set-Top Box Market Volume (K Unit), by Display Size (in Inches) 2025 & 2033
- Figure 185: Rest of the World Smart Television and Set-Top Box Market Revenue Share (%), by Display Size (in Inches) 2025 & 2033
- Figure 186: Rest of the World Smart Television and Set-Top Box Market Volume Share (%), by Display Size (in Inches) 2025 & 2033
- Figure 187: Rest of the World Smart Television and Set-Top Box Market Revenue (billion), by Technology 2025 & 2033
- Figure 188: Rest of the World Smart Television and Set-Top Box Market Volume (K Unit), by Technology 2025 & 2033
- Figure 189: Rest of the World Smart Television and Set-Top Box Market Revenue Share (%), by Technology 2025 & 2033
- Figure 190: Rest of the World Smart Television and Set-Top Box Market Volume Share (%), by Technology 2025 & 2033
- Figure 191: Rest of the World Smart Television and Set-Top Box Market Revenue (billion), by Country 2025 & 2033
- Figure 192: Rest of the World Smart Television and Set-Top Box Market Volume (K Unit), by Country 2025 & 2033
- Figure 193: Rest of the World Smart Television and Set-Top Box Market Revenue Share (%), by Country 2025 & 2033
- Figure 194: Rest of the World Smart Television and Set-Top Box Market Volume Share (%), by Country 2025 & 2033
List of Tables
- Table 1: Global Smart Television and Set-Top Box Market Revenue billion Forecast, by Technology 2020 & 2033
- Table 2: Global Smart Television and Set-Top Box Market Volume K Unit Forecast, by Technology 2020 & 2033
- Table 3: Global Smart Television and Set-Top Box Market Revenue billion Forecast, by Resolution 2020 & 2033
- Table 4: Global Smart Television and Set-Top Box Market Volume K Unit Forecast, by Resolution 2020 & 2033
- Table 5: Global Smart Television and Set-Top Box Market Revenue billion Forecast, by Resolution 2020 & 2033
- Table 6: Global Smart Television and Set-Top Box Market Volume K Unit Forecast, by Resolution 2020 & 2033
- Table 7: Global Smart Television and Set-Top Box Market Revenue billion Forecast, by Display Size (in Inches) 2020 & 2033
- Table 8: Global Smart Television and Set-Top Box Market Volume K Unit Forecast, by Display Size (in Inches) 2020 & 2033
- Table 9: Global Smart Television and Set-Top Box Market Revenue billion Forecast, by Technology 2020 & 2033
- Table 10: Global Smart Television and Set-Top Box Market Volume K Unit Forecast, by Technology 2020 & 2033
- Table 11: Global Smart Television and Set-Top Box Market Revenue billion Forecast, by Region 2020 & 2033
- Table 12: Global Smart Television and Set-Top Box Market Volume K Unit Forecast, by Region 2020 & 2033
- Table 13: Global Smart Television and Set-Top Box Market Revenue billion Forecast, by Technology 2020 & 2033
- Table 14: Global Smart Television and Set-Top Box Market Volume K Unit Forecast, by Technology 2020 & 2033
- Table 15: Global Smart Television and Set-Top Box Market Revenue billion Forecast, by Resolution 2020 & 2033
- Table 16: Global Smart Television and Set-Top Box Market Volume K Unit Forecast, by Resolution 2020 & 2033
- Table 17: Global Smart Television and Set-Top Box Market Revenue billion Forecast, by Resolution 2020 & 2033
- Table 18: Global Smart Television and Set-Top Box Market Volume K Unit Forecast, by Resolution 2020 & 2033
- Table 19: Global Smart Television and Set-Top Box Market Revenue billion Forecast, by Display Size (in Inches) 2020 & 2033
- Table 20: Global Smart Television and Set-Top Box Market Volume K Unit Forecast, by Display Size (in Inches) 2020 & 2033
- Table 21: Global Smart Television and Set-Top Box Market Revenue billion Forecast, by Technology 2020 & 2033
- Table 22: Global Smart Television and Set-Top Box Market Volume K Unit Forecast, by Technology 2020 & 2033
- Table 23: Global Smart Television and Set-Top Box Market Revenue billion Forecast, by Country 2020 & 2033
- Table 24: Global Smart Television and Set-Top Box Market Volume K Unit Forecast, by Country 2020 & 2033
- Table 25: Global Smart Television and Set-Top Box Market Revenue billion Forecast, by Technology 2020 & 2033
- Table 26: Global Smart Television and Set-Top Box Market Volume K Unit Forecast, by Technology 2020 & 2033
- Table 27: Global Smart Television and Set-Top Box Market Revenue billion Forecast, by Resolution 2020 & 2033
- Table 28: Global Smart Television and Set-Top Box Market Volume K Unit Forecast, by Resolution 2020 & 2033
- Table 29: Global Smart Television and Set-Top Box Market Revenue billion Forecast, by Resolution 2020 & 2033
- Table 30: Global Smart Television and Set-Top Box Market Volume K Unit Forecast, by Resolution 2020 & 2033
- Table 31: Global Smart Television and Set-Top Box Market Revenue billion Forecast, by Display Size (in Inches) 2020 & 2033
- Table 32: Global Smart Television and Set-Top Box Market Volume K Unit Forecast, by Display Size (in Inches) 2020 & 2033
- Table 33: Global Smart Television and Set-Top Box Market Revenue billion Forecast, by Technology 2020 & 2033
- Table 34: Global Smart Television and Set-Top Box Market Volume K Unit Forecast, by Technology 2020 & 2033
- Table 35: Global Smart Television and Set-Top Box Market Revenue billion Forecast, by Country 2020 & 2033
- Table 36: Global Smart Television and Set-Top Box Market Volume K Unit Forecast, by Country 2020 & 2033
- Table 37: Global Smart Television and Set-Top Box Market Revenue billion Forecast, by Technology 2020 & 2033
- Table 38: Global Smart Television and Set-Top Box Market Volume K Unit Forecast, by Technology 2020 & 2033
- Table 39: Global Smart Television and Set-Top Box Market Revenue billion Forecast, by Resolution 2020 & 2033
- Table 40: Global Smart Television and Set-Top Box Market Volume K Unit Forecast, by Resolution 2020 & 2033
- Table 41: Global Smart Television and Set-Top Box Market Revenue billion Forecast, by Resolution 2020 & 2033
- Table 42: Global Smart Television and Set-Top Box Market Volume K Unit Forecast, by Resolution 2020 & 2033
- Table 43: Global Smart Television and Set-Top Box Market Revenue billion Forecast, by Display Size (in Inches) 2020 & 2033
- Table 44: Global Smart Television and Set-Top Box Market Volume K Unit Forecast, by Display Size (in Inches) 2020 & 2033
- Table 45: Global Smart Television and Set-Top Box Market Revenue billion Forecast, by Technology 2020 & 2033
- Table 46: Global Smart Television and Set-Top Box Market Volume K Unit Forecast, by Technology 2020 & 2033
- Table 47: Global Smart Television and Set-Top Box Market Revenue billion Forecast, by Country 2020 & 2033
- Table 48: Global Smart Television and Set-Top Box Market Volume K Unit Forecast, by Country 2020 & 2033
- Table 49: Global Smart Television and Set-Top Box Market Revenue billion Forecast, by Technology 2020 & 2033
- Table 50: Global Smart Television and Set-Top Box Market Volume K Unit Forecast, by Technology 2020 & 2033
- Table 51: Global Smart Television and Set-Top Box Market Revenue billion Forecast, by Resolution 2020 & 2033
- Table 52: Global Smart Television and Set-Top Box Market Volume K Unit Forecast, by Resolution 2020 & 2033
- Table 53: Global Smart Television and Set-Top Box Market Revenue billion Forecast, by Resolution 2020 & 2033
- Table 54: Global Smart Television and Set-Top Box Market Volume K Unit Forecast, by Resolution 2020 & 2033
- Table 55: Global Smart Television and Set-Top Box Market Revenue billion Forecast, by Display Size (in Inches) 2020 & 2033
- Table 56: Global Smart Television and Set-Top Box Market Volume K Unit Forecast, by Display Size (in Inches) 2020 & 2033
- Table 57: Global Smart Television and Set-Top Box Market Revenue billion Forecast, by Technology 2020 & 2033
- Table 58: Global Smart Television and Set-Top Box Market Volume K Unit Forecast, by Technology 2020 & 2033
- Table 59: Global Smart Television and Set-Top Box Market Revenue billion Forecast, by Country 2020 & 2033
- Table 60: Global Smart Television and Set-Top Box Market Volume K Unit Forecast, by Country 2020 & 2033
- Table 61: Global Smart Television and Set-Top Box Market Revenue billion Forecast, by Technology 2020 & 2033
- Table 62: Global Smart Television and Set-Top Box Market Volume K Unit Forecast, by Technology 2020 & 2033
- Table 63: Global Smart Television and Set-Top Box Market Revenue billion Forecast, by Resolution 2020 & 2033
- Table 64: Global Smart Television and Set-Top Box Market Volume K Unit Forecast, by Resolution 2020 & 2033
- Table 65: Global Smart Television and Set-Top Box Market Revenue billion Forecast, by Resolution 2020 & 2033
- Table 66: Global Smart Television and Set-Top Box Market Volume K Unit Forecast, by Resolution 2020 & 2033
- Table 67: Global Smart Television and Set-Top Box Market Revenue billion Forecast, by Display Size (in Inches) 2020 & 2033
- Table 68: Global Smart Television and Set-Top Box Market Volume K Unit Forecast, by Display Size (in Inches) 2020 & 2033
- Table 69: Global Smart Television and Set-Top Box Market Revenue billion Forecast, by Technology 2020 & 2033
- Table 70: Global Smart Television and Set-Top Box Market Volume K Unit Forecast, by Technology 2020 & 2033
- Table 71: Global Smart Television and Set-Top Box Market Revenue billion Forecast, by Country 2020 & 2033
- Table 72: Global Smart Television and Set-Top Box Market Volume K Unit Forecast, by Country 2020 & 2033
- Table 73: Global Smart Television and Set-Top Box Market Revenue billion Forecast, by Technology 2020 & 2033
- Table 74: Global Smart Television and Set-Top Box Market Volume K Unit Forecast, by Technology 2020 & 2033
- Table 75: Global Smart Television and Set-Top Box Market Revenue billion Forecast, by Resolution 2020 & 2033
- Table 76: Global Smart Television and Set-Top Box Market Volume K Unit Forecast, by Resolution 2020 & 2033
- Table 77: Global Smart Television and Set-Top Box Market Revenue billion Forecast, by Resolution 2020 & 2033
- Table 78: Global Smart Television and Set-Top Box Market Volume K Unit Forecast, by Resolution 2020 & 2033
- Table 79: Global Smart Television and Set-Top Box Market Revenue billion Forecast, by Display Size (in Inches) 2020 & 2033
- Table 80: Global Smart Television and Set-Top Box Market Volume K Unit Forecast, by Display Size (in Inches) 2020 & 2033
- Table 81: Global Smart Television and Set-Top Box Market Revenue billion Forecast, by Technology 2020 & 2033
- Table 82: Global Smart Television and Set-Top Box Market Volume K Unit Forecast, by Technology 2020 & 2033
- Table 83: Global Smart Television and Set-Top Box Market Revenue billion Forecast, by Country 2020 & 2033
- Table 84: Global Smart Television and Set-Top Box Market Volume K Unit Forecast, by Country 2020 & 2033
- Table 85: Global Smart Television and Set-Top Box Market Revenue billion Forecast, by Technology 2020 & 2033
- Table 86: Global Smart Television and Set-Top Box Market Volume K Unit Forecast, by Technology 2020 & 2033
- Table 87: Global Smart Television and Set-Top Box Market Revenue billion Forecast, by Resolution 2020 & 2033
- Table 88: Global Smart Television and Set-Top Box Market Volume K Unit Forecast, by Resolution 2020 & 2033
- Table 89: Global Smart Television and Set-Top Box Market Revenue billion Forecast, by Resolution 2020 & 2033
- Table 90: Global Smart Television and Set-Top Box Market Volume K Unit Forecast, by Resolution 2020 & 2033
- Table 91: Global Smart Television and Set-Top Box Market Revenue billion Forecast, by Display Size (in Inches) 2020 & 2033
- Table 92: Global Smart Television and Set-Top Box Market Volume K Unit Forecast, by Display Size (in Inches) 2020 & 2033
- Table 93: Global Smart Television and Set-Top Box Market Revenue billion Forecast, by Technology 2020 & 2033
- Table 94: Global Smart Television and Set-Top Box Market Volume K Unit Forecast, by Technology 2020 & 2033
- Table 95: Global Smart Television and Set-Top Box Market Revenue billion Forecast, by Country 2020 & 2033
- Table 96: Global Smart Television and Set-Top Box Market Volume K Unit Forecast, by Country 2020 & 2033
- Table 97: Global Smart Television and Set-Top Box Market Revenue billion Forecast, by Technology 2020 & 2033
- Table 98: Global Smart Television and Set-Top Box Market Volume K Unit Forecast, by Technology 2020 & 2033
- Table 99: Global Smart Television and Set-Top Box Market Revenue billion Forecast, by Resolution 2020 & 2033
- Table 100: Global Smart Television and Set-Top Box Market Volume K Unit Forecast, by Resolution 2020 & 2033
- Table 101: Global Smart Television and Set-Top Box Market Revenue billion Forecast, by Resolution 2020 & 2033
- Table 102: Global Smart Television and Set-Top Box Market Volume K Unit Forecast, by Resolution 2020 & 2033
- Table 103: Global Smart Television and Set-Top Box Market Revenue billion Forecast, by Display Size (in Inches) 2020 & 2033
- Table 104: Global Smart Television and Set-Top Box Market Volume K Unit Forecast, by Display Size (in Inches) 2020 & 2033
- Table 105: Global Smart Television and Set-Top Box Market Revenue billion Forecast, by Technology 2020 & 2033
- Table 106: Global Smart Television and Set-Top Box Market Volume K Unit Forecast, by Technology 2020 & 2033
- Table 107: Global Smart Television and Set-Top Box Market Revenue billion Forecast, by Country 2020 & 2033
- Table 108: Global Smart Television and Set-Top Box Market Volume K Unit Forecast, by Country 2020 & 2033
Frequently Asked Questions
1. What is the projected Compound Annual Growth Rate (CAGR) of the Smart Television and Set-Top Box Market?
The projected CAGR is approximately 3.9%.
2. Which companies are prominent players in the Smart Television and Set-Top Box Market?
Key companies in the market include Hisense Group, Gospell Digital Technology CO Limited, TCL Electronics Holdings Limited, Evolution Digital LLC, Humax Holdings CO Ltd, LG Electronics Inc, Shenzhen Skyworth Digital Technology CO Ltd, Shenzhen Coship Electronics CO Ltd, Intek Digital Inc, Arris International PLC (commscope Holding Company Inc), Sagemcom SAS, ZTE Corporation, Xiaomi Corporatio, Kaonmedia CO Ltd, Technicolor SA, Samsung Electronics CO Ltd.
3. What are the main segments of the Smart Television and Set-Top Box Market?
The market segments include Technology, Resolution, Resolution, Display Size (in Inches), Technology.
4. Can you provide details about the market size?
The market size is estimated to be USD 26.32 billion as of 2022.
5. What are some drivers contributing to market growth?
High Levels of Technological Innovations; Growing Adoption In The Emerging Markets; Deployment Of OS-based Devices.
6. What are the notable trends driving market growth?
High Levels of Technological Innovations to Drive the Market.
7. Are there any restraints impacting market growth?
Growing Production Costs and Vendor Consolidation.
8. Can you provide examples of recent developments in the market?
August 2022 - Samsung announced to launch of Samsung OLED in Australia, thereby expanding its 2022 TV line-up. The TV features over 8 million self-lit pixels partnered with Quantum Dot Technology that can deliver brighter, more accurate highlights and realistic colors.
9. What pricing options are available for accessing the report?
Pricing options include single-user, multi-user, and enterprise licenses priced at USD 4750, USD 5250, and USD 8750 respectively.
10. Is the market size provided in terms of value or volume?
The market size is provided in terms of value, measured in billion and volume, measured in K Unit.
11. Are there any specific market keywords associated with the report?
Yes, the market keyword associated with the report is "Smart Television and Set-Top Box Market," which aids in identifying and referencing the specific market segment covered.
12. How do I determine which pricing option suits my needs best?
The pricing options vary based on user requirements and access needs. Individual users may opt for single-user licenses, while businesses requiring broader access may choose multi-user or enterprise licenses for cost-effective access to the report.
13. Are there any additional resources or data provided in the Smart Television and Set-Top Box Market report?
While the report offers comprehensive insights, it's advisable to review the specific contents or supplementary materials provided to ascertain if additional resources or data are available.
14. How can I stay updated on further developments or reports in the Smart Television and Set-Top Box Market?
To stay informed about further developments, trends, and reports in the Smart Television and Set-Top Box Market, consider subscribing to industry newsletters, following relevant companies and organizations, or regularly checking reputable industry news sources and publications.
Methodology
Step 1 - Identification of Relevant Samples Size from Population Database


Step 2 - Approaches for Defining Global Market Size (Value, Volume* & Price*)

Note*: In applicable scenarios
Step 3 - Data Sources
Primary Research
- Web Analytics
- Survey Reports
- Research Institute
- Latest Research Reports
- Opinion Leaders
Secondary Research
- Annual Reports
- White Paper
- Latest Press Release
- Industry Association
- Paid Database
- Investor Presentations

Step 4 - Data Triangulation
Involves using different sources of information in order to increase the validity of a study
These sources are likely to be stakeholders in a program - participants, other researchers, program staff, other community members, and so on.
Then we put all data in single framework & apply various statistical tools to find out the dynamic on the market.
During the analysis stage, feedback from the stakeholder groups would be compared to determine areas of agreement as well as areas of divergence