

Key Insights
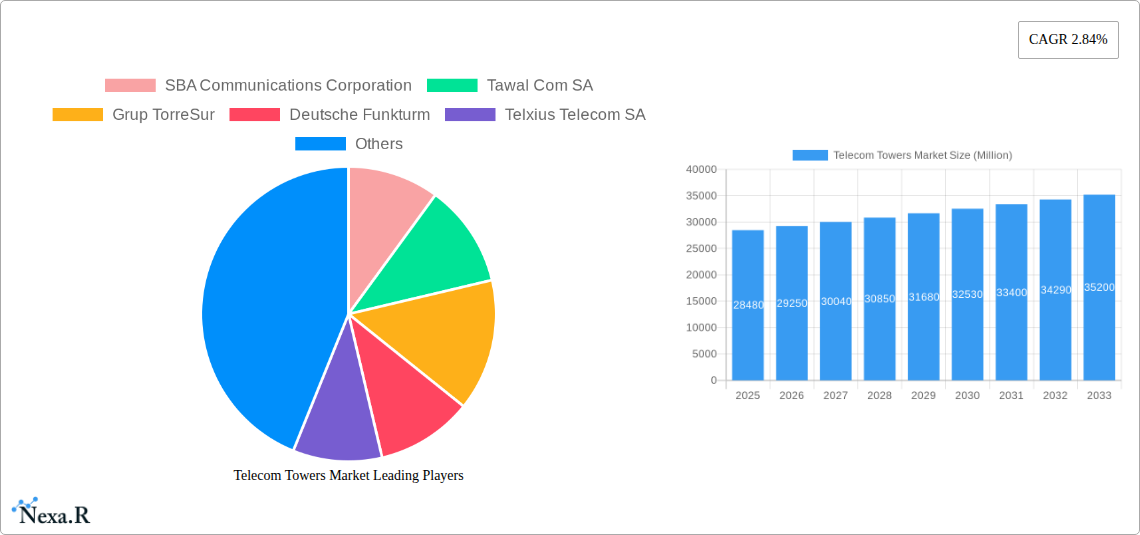
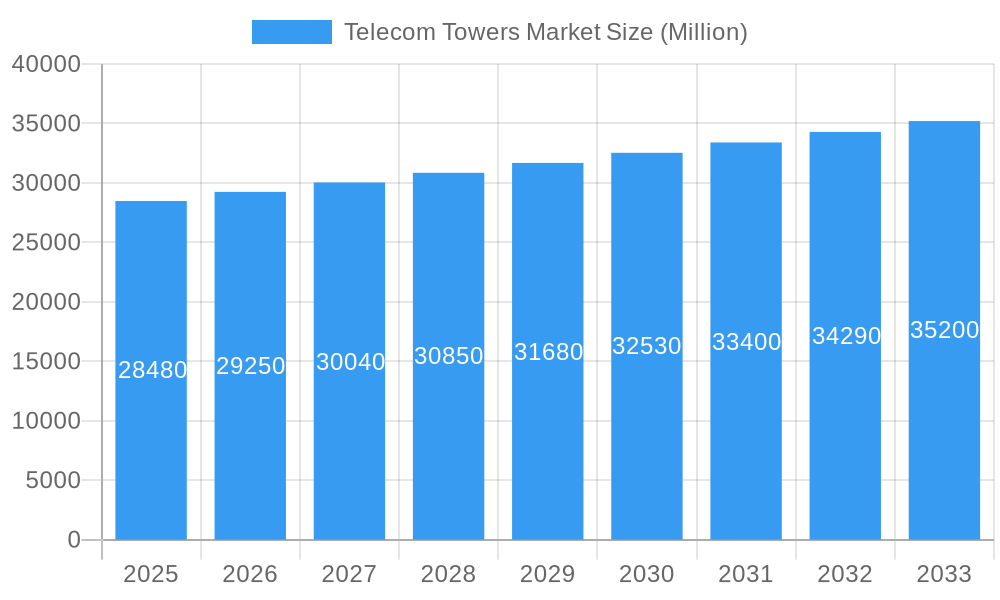
The global telecom towers market, valued at $28.48 billion in 2025, is projected to experience steady growth, driven by the expanding mobile network infrastructure and increasing demand for 5G deployment. A compound annual growth rate (CAGR) of 2.84% from 2025 to 2033 indicates a significant market expansion over the forecast period. Key growth drivers include the escalating adoption of 5G technology, the rising penetration of smartphones and mobile data usage, and the increasing need for improved network coverage in underserved areas. Market segmentation reveals considerable diversity: renewable energy sources are gaining traction within the fuel type segment, reflecting a broader industry trend toward sustainability. Similarly, the preference for specific tower types varies geographically and depends on factors such as terrain and infrastructure limitations. Ground-based installations continue to dominate, but rooftop installations offer strategic advantages in dense urban areas. The ownership structure is fragmented, with a mix of operator-owned, joint venture, and privately owned towers, indicating diverse investment strategies within the sector. Competitive pressures are evident, with major players like American Tower Corporation, SBA Communications Corporation, and Cellnex Telecom vying for market share through strategic acquisitions, technological advancements, and expansion into new geographic regions. Regional variations in market dynamics are expected, with North America and Asia-Pacific anticipated to be prominent growth markets due to substantial 5G infrastructure investments and population density. However, factors like stringent regulatory environments and high initial investment costs might pose challenges to market growth.
Telecom Towers Market Market Size (In Billion)
The significant investment in 5G infrastructure globally is a major catalyst for growth, pushing demand for more robust and efficient telecom towers. The increasing prevalence of shared infrastructure models, where multiple operators utilize a single tower, also fosters efficiency and cost savings. This trend is further reinforced by the consolidation of the telecom tower industry, with larger players acquiring smaller companies to expand their reach and expertise. However, potential restraints include the escalating costs of construction and maintenance, especially in challenging terrains, and the need to comply with increasingly complex environmental regulations. Furthermore, the risk of technological obsolescence is a key concern, demanding continuous innovation and upgrades to remain competitive. The competitive landscape remains dynamic with mergers and acquisitions expected to continue shaping the industry structure. The forecast period will see considerable focus on optimizing tower infrastructure for energy efficiency and adopting sustainable practices. This drive towards sustainability, coupled with ongoing technological advancements, will significantly influence the telecom towers market's growth trajectory.
Telecom Towers Market Company Market Share
Telecom Towers Market: A Comprehensive Report (2019-2033)
This in-depth report provides a comprehensive analysis of the global Telecom Towers Market, encompassing its current dynamics, future growth trajectories, and key players shaping its evolution. With a detailed study period spanning from 2019 to 2033 (Base Year: 2025, Forecast Period: 2025-2033), this report offers invaluable insights for industry professionals, investors, and strategic decision-makers. The market is segmented by Fuel Type (Renewable, Non-renewable), Type of Tower (Lattice Tower, Guyed Tower, Monopole Towers, Stealth Towers), Installation (Rooftop, Ground-based), and Ownership (Operator-owned, Joint Venture, Private-owned, MNO Captive). The report also profiles key players like American Tower Corporation, SBA Communications Corporation, and Crown Castle International Corporation, among others. The total market size is predicted to reach xx Million units by 2033.
Telecom Towers Market Dynamics & Structure
The Telecom Towers Market is characterized by a moderately consolidated structure, with a few major players holding significant market share. The market's growth is driven by technological advancements, particularly in 5G deployment, which necessitates a denser network of towers. However, regulatory hurdles and stringent environmental regulations pose significant challenges. The market also witnesses considerable M&A activity, reflecting the consolidation trend within the industry.
- Market Concentration: The top 5 players account for approximately xx% of the global market share in 2025.
- Technological Innovation: 5G rollout and the increasing demand for small cells are key drivers of innovation, pushing demand for new tower technologies.
- Regulatory Frameworks: Stringent regulations concerning tower placement, environmental impact, and spectrum allocation influence market dynamics.
- Competitive Product Substitutes: Distributed antenna systems (DAS) and other alternative infrastructure solutions provide some level of competition.
- End-User Demographics: The growth is primarily driven by increasing mobile penetration, data consumption, and the expanding reach of telecommunications services in developing economies.
- M&A Trends: The past five years have seen xx major M&A deals, with an average deal value of approximately xx Million units. This trend reflects a consolidation strategy among major players. Innovation barriers include high capital expenditure requirements for tower construction and technological upgrades.
Telecom Towers Market Growth Trends & Insights
The global Telecom Towers Market exhibits a robust growth trajectory, driven by the rapid expansion of mobile network coverage, particularly in emerging markets. The market is witnessing a significant increase in the adoption of advanced technologies such as 5G and the Internet of Things (IoT), necessitating a denser network infrastructure. This necessitates the deployment of a higher number of towers. The compound annual growth rate (CAGR) is estimated at xx% during the forecast period (2025-2033), with market penetration increasing from xx% in 2025 to xx% by 2033. Consumer behavior shifts towards increased data consumption and higher bandwidth demands further fuel this growth. Technological disruptions, such as the deployment of 5G and the rise of private networks are influencing tower design and location strategies, leading to new investment opportunities.
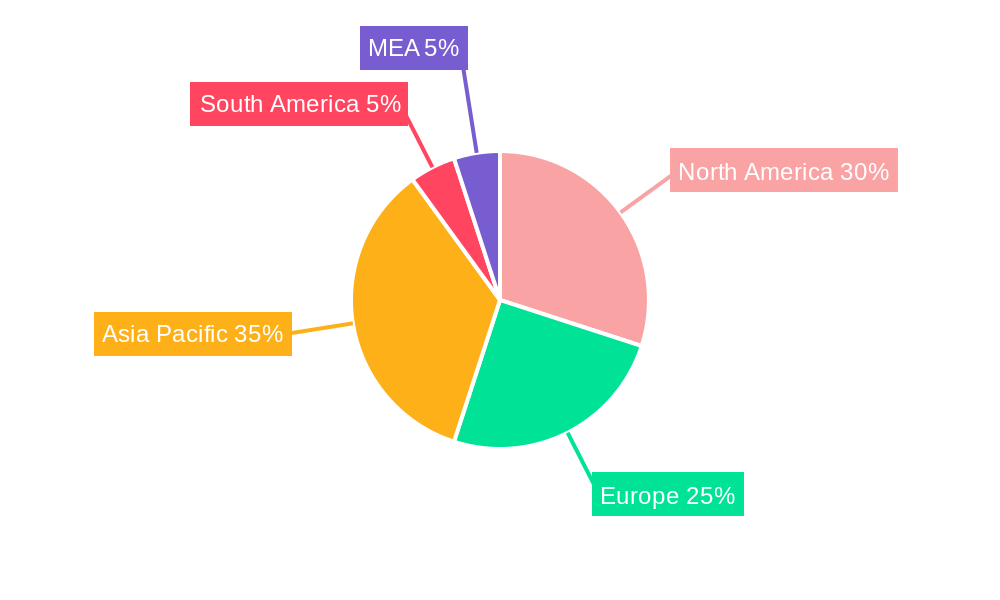
Dominant Regions, Countries, or Segments in Telecom Towers Market
The Asia-Pacific region is currently dominating the global Telecom Towers Market, followed by North America and Europe. High population density, increasing mobile penetration, and government initiatives to expand network coverage are driving the growth in Asia. Within the segments, the Monopole Towers segment holds the largest market share owing to its cost-effectiveness and ease of deployment. Ground-based installations represent a larger market share compared to rooftop installations. Operator-owned towers form the largest ownership segment.
- Key Drivers in Asia-Pacific: Rapid urbanization, increasing smartphone penetration, and substantial investments in infrastructure development.
- Key Drivers in North America: Deployment of 5G networks, the growing demand for reliable high-speed internet access, and a well-established telecommunications infrastructure.
- Dominant Segment: Monopole Towers: Cost-effective and easier to install compared to other tower types.
- Dominant Installation Type: Ground-based: Offers better structural stability and signal propagation capabilities.
- Dominant Ownership Type: Operator-owned: Allows for greater control over network infrastructure and maintenance.
Telecom Towers Market Product Landscape
The Telecom Towers Market is characterized by continuous product innovation, focusing on enhancing structural integrity, optimizing signal propagation, and minimizing environmental impact. Stealth towers, designed for aesthetic integration into the surrounding environment, are gaining popularity in urban areas. Modern towers utilize advanced materials and designs to improve durability, wind resistance, and capacity for accommodating multiple operators. Key performance metrics include tower height, load-bearing capacity, and signal propagation efficiency.
Key Drivers, Barriers & Challenges in Telecom Towers Market
Key Drivers: The increasing demand for mobile broadband services, 5G network deployment, and the growth of IoT are the primary drivers. Government initiatives to expand network coverage in underserved areas further accelerate growth.
Key Challenges: High capital expenditure, securing necessary permits and approvals, and competition from alternative infrastructure solutions pose significant challenges. Supply chain disruptions due to global events can also impact tower construction timelines and costs. Regulatory uncertainties and environmental concerns can hinder project approvals and increase project costs.
Emerging Opportunities in Telecom Towers Market
The growing adoption of 5G networks presents a significant opportunity for deploying small cells and distributed antenna systems (DAS) alongside macro towers. Expansion into underserved rural areas and the development of innovative tower designs to meet unique environmental and aesthetic requirements offer considerable potential. Furthermore, the rising demand for private LTE and 5G networks in specific industries, such as mining and manufacturing, creates new opportunities.
Growth Accelerators in the Telecom Towers Market Industry
Strategic partnerships between tower companies and mobile network operators are driving market growth, leading to efficient resource utilization and accelerated deployment. Technological advancements in tower construction materials, design, and management systems are enhancing operational efficiency and lowering costs. Expanding into new geographic markets and diversifying service offerings contribute to long-term growth potential.
Key Players Shaping the Telecom Towers Market Market
- SBA Communications Corporation
- Tawal Com SA
- Grup TorreSur
- Deutsche Funkturm
- Telxius Telecom SA
- Cellnex Telecom
- Telesites SAB de CV
- IHS Towers (IHS Holding Limited)
- Zong Pakistan
- Telkom Indonesia
- Helios Towers Africa
- American Tower Corporation
- China Tower Corporation
- Orange
- Indus Towers Limited (Bharti Infratel)
- First Tower Company
- Telenor ASA
- GTL Infrastructure Limited
- Crown Castle International Corporation
- AT&T Inc
- T-Mobile USA Inc
Notable Milestones in Telecom Towers Market Sector
- April 2023: The Indian government launched 254 4G mobile towers in Arunachal Pradesh, providing 4G coverage to 336 villages. This initiative is significant for expanding connectivity in remote areas and enhancing national security.
- April 2023: Tawal, a subsidiary of Saudi Telecom Company (STC), acquired United Group's tower infrastructure for USD 1.34 billion, expanding its international presence and portfolio by approximately 4,800 towers.
In-Depth Telecom Towers Market Market Outlook
The Telecom Towers Market is poised for continued growth, fueled by the ongoing expansion of 5G and the rise of private networks. Strategic investments in infrastructure development, coupled with technological innovations aimed at improving efficiency and reducing costs, will drive market expansion. The market's future potential lies in its ability to adapt to evolving technological demands, overcome regulatory barriers, and capitalize on emerging opportunities in underserved regions and industries.
Telecom Towers Market Segmentation
-
1. Fuel Type
- 1.1. Renewable
- 1.2. Non-renewable
-
2. Type of Tower
- 2.1. Lattice Tower
- 2.2. Guyed Tower
- 2.3. Monopole Towers
- 2.4. Stealth Towers
-
3. Installation
- 3.1. Rooftop
- 3.2. Ground-based
-
4. Ownership
- 4.1. Operator-owned
- 4.2. Joint Venture
- 4.3. Private-owned
- 4.4. MNO Captive
Telecom Towers Market Segmentation By Geography
-
1. North America
- 1.1. United States
- 1.2. Canada
-
2. Europe
- 2.1. United Kingdom
- 2.2. Germany
- 2.3. France
- 2.4. Italy
- 2.5. Spain
- 2.6. Netherlands
- 2.7. Sweden
- 2.8. Switzerland
- 2.9. Rest of Europe
-
3. Asia Pacific
- 3.1. China
- 3.2. India
- 3.3. Japan
- 3.4. South Korea
- 3.5. Indonesia
- 3.6. Vietnam
- 3.7. Malaysia
- 3.8. Philippines
- 3.9. Australia and New Zealand
- 3.10. Rest of Asia Pacific
-
4. Latin America
- 4.1. Brazil
- 4.2. Mexico
- 4.3. Argentina
- 4.4. Rest of Latin America
-
5. Middle East and Africa
- 5.1. Saudi Arabia
- 5.2. Egypt
- 5.3. Algeria
- 5.4. Nigeria
- 5.5. South Africa
- 5.6. Tanzania
- 5.7. Morocco
- 5.8. Rest of Middle East and Africa
Telecom Towers Market Regional Market Share
Geographic Coverage of Telecom Towers Market
Telecom Towers Market REPORT HIGHLIGHTS
| Aspects | Details |
|---|---|
| Study Period | 2020-2034 |
| Base Year | 2025 |
| Estimated Year | 2026 |
| Forecast Period | 2026-2034 |
| Historical Period | 2020-2025 |
| Growth Rate | CAGR of 2.84% from 2020-2034 |
| Segmentation |
|
Table of Contents
- 1. Introduction
- 1.1. Research Scope
- 1.2. Market Segmentation
- 1.3. Research Objective
- 1.4. Definitions and Assumptions
- 2. Executive Summary
- 2.1. Market Snapshot
- 3. Market Dynamics
- 3.1. Market Drivers
- 3.2. Market Restrains
- 3.3. Market Trends
- 3.4. Market Opportunities
- 4. Market Factor Analysis
- 4.1. Porters Five Forces
- 4.1.1. Bargaining Power of Suppliers
- 4.1.2. Bargaining Power of Buyers
- 4.1.3. Threat of New Entrants
- 4.1.4. Threat of Substitutes
- 4.1.5. Competitive Rivalry
- 4.2. PESTEL analysis
- 4.3. BCG Analysis
- 4.3.1. Stars (High Growth, High Market Share)
- 4.3.2. Cash Cows (Low Growth, High Market Share)
- 4.3.3. Question Mark (High Growth, Low Market Share)
- 4.3.4. Dogs (Low Growth, Low Market Share)
- 4.4. Ansoff Matrix Analysis
- 4.5. Supply Chain Analysis
- 4.6. Regulatory Landscape
- 4.7. Current Market Potential and Opportunity Assessment (TAM–SAM–SOM Framework)
- 4.8. NRP Analyst Note
- 4.1. Porters Five Forces
- 5. Market Analysis, Insights and Forecast 2021-2033
- 5.1. Market Analysis, Insights and Forecast - by Fuel Type
- 5.1.1. Renewable
- 5.1.2. Non-renewable
- 5.2. Market Analysis, Insights and Forecast - by Type of Tower
- 5.2.1. Lattice Tower
- 5.2.2. Guyed Tower
- 5.2.3. Monopole Towers
- 5.2.4. Stealth Towers
- 5.3. Market Analysis, Insights and Forecast - by Installation
- 5.3.1. Rooftop
- 5.3.2. Ground-based
- 5.4. Market Analysis, Insights and Forecast - by Ownership
- 5.4.1. Operator-owned
- 5.4.2. Joint Venture
- 5.4.3. Private-owned
- 5.4.4. MNO Captive
- 5.5. Market Analysis, Insights and Forecast - by Region
- 5.5.1. North America
- 5.5.2. Europe
- 5.5.3. Asia Pacific
- 5.5.4. Latin America
- 5.5.5. Middle East and Africa
- 5.1. Market Analysis, Insights and Forecast - by Fuel Type
- 6. Global Telecom Towers Market Analysis, Insights and Forecast, 2021-2033
- 6.1. Market Analysis, Insights and Forecast - by Fuel Type
- 6.1.1. Renewable
- 6.1.2. Non-renewable
- 6.2. Market Analysis, Insights and Forecast - by Type of Tower
- 6.2.1. Lattice Tower
- 6.2.2. Guyed Tower
- 6.2.3. Monopole Towers
- 6.2.4. Stealth Towers
- 6.3. Market Analysis, Insights and Forecast - by Installation
- 6.3.1. Rooftop
- 6.3.2. Ground-based
- 6.4. Market Analysis, Insights and Forecast - by Ownership
- 6.4.1. Operator-owned
- 6.4.2. Joint Venture
- 6.4.3. Private-owned
- 6.4.4. MNO Captive
- 6.1. Market Analysis, Insights and Forecast - by Fuel Type
- 7. North America Telecom Towers Market Analysis, Insights and Forecast, 2020-2032
- 7.1. Market Analysis, Insights and Forecast - by Fuel Type
- 7.1.1. Renewable
- 7.1.2. Non-renewable
- 7.2. Market Analysis, Insights and Forecast - by Type of Tower
- 7.2.1. Lattice Tower
- 7.2.2. Guyed Tower
- 7.2.3. Monopole Towers
- 7.2.4. Stealth Towers
- 7.3. Market Analysis, Insights and Forecast - by Installation
- 7.3.1. Rooftop
- 7.3.2. Ground-based
- 7.4. Market Analysis, Insights and Forecast - by Ownership
- 7.4.1. Operator-owned
- 7.4.2. Joint Venture
- 7.4.3. Private-owned
- 7.4.4. MNO Captive
- 7.1. Market Analysis, Insights and Forecast - by Fuel Type
- 8. Europe Telecom Towers Market Analysis, Insights and Forecast, 2020-2032
- 8.1. Market Analysis, Insights and Forecast - by Fuel Type
- 8.1.1. Renewable
- 8.1.2. Non-renewable
- 8.2. Market Analysis, Insights and Forecast - by Type of Tower
- 8.2.1. Lattice Tower
- 8.2.2. Guyed Tower
- 8.2.3. Monopole Towers
- 8.2.4. Stealth Towers
- 8.3. Market Analysis, Insights and Forecast - by Installation
- 8.3.1. Rooftop
- 8.3.2. Ground-based
- 8.4. Market Analysis, Insights and Forecast - by Ownership
- 8.4.1. Operator-owned
- 8.4.2. Joint Venture
- 8.4.3. Private-owned
- 8.4.4. MNO Captive
- 8.1. Market Analysis, Insights and Forecast - by Fuel Type
- 9. Asia Pacific Telecom Towers Market Analysis, Insights and Forecast, 2020-2032
- 9.1. Market Analysis, Insights and Forecast - by Fuel Type
- 9.1.1. Renewable
- 9.1.2. Non-renewable
- 9.2. Market Analysis, Insights and Forecast - by Type of Tower
- 9.2.1. Lattice Tower
- 9.2.2. Guyed Tower
- 9.2.3. Monopole Towers
- 9.2.4. Stealth Towers
- 9.3. Market Analysis, Insights and Forecast - by Installation
- 9.3.1. Rooftop
- 9.3.2. Ground-based
- 9.4. Market Analysis, Insights and Forecast - by Ownership
- 9.4.1. Operator-owned
- 9.4.2. Joint Venture
- 9.4.3. Private-owned
- 9.4.4. MNO Captive
- 9.1. Market Analysis, Insights and Forecast - by Fuel Type
- 10. Latin America Telecom Towers Market Analysis, Insights and Forecast, 2020-2032
- 10.1. Market Analysis, Insights and Forecast - by Fuel Type
- 10.1.1. Renewable
- 10.1.2. Non-renewable
- 10.2. Market Analysis, Insights and Forecast - by Type of Tower
- 10.2.1. Lattice Tower
- 10.2.2. Guyed Tower
- 10.2.3. Monopole Towers
- 10.2.4. Stealth Towers
- 10.3. Market Analysis, Insights and Forecast - by Installation
- 10.3.1. Rooftop
- 10.3.2. Ground-based
- 10.4. Market Analysis, Insights and Forecast - by Ownership
- 10.4.1. Operator-owned
- 10.4.2. Joint Venture
- 10.4.3. Private-owned
- 10.4.4. MNO Captive
- 10.1. Market Analysis, Insights and Forecast - by Fuel Type
- 11. Middle East and Africa Telecom Towers Market Analysis, Insights and Forecast, 2020-2032
- 11.1. Market Analysis, Insights and Forecast - by Fuel Type
- 11.1.1. Renewable
- 11.1.2. Non-renewable
- 11.2. Market Analysis, Insights and Forecast - by Type of Tower
- 11.2.1. Lattice Tower
- 11.2.2. Guyed Tower
- 11.2.3. Monopole Towers
- 11.2.4. Stealth Towers
- 11.3. Market Analysis, Insights and Forecast - by Installation
- 11.3.1. Rooftop
- 11.3.2. Ground-based
- 11.4. Market Analysis, Insights and Forecast - by Ownership
- 11.4.1. Operator-owned
- 11.4.2. Joint Venture
- 11.4.3. Private-owned
- 11.4.4. MNO Captive
- 11.1. Market Analysis, Insights and Forecast - by Fuel Type
- 12. Competitive Analysis
- 12.1. Company Profiles
- 12.1.1 SBA Communications Corporation
- 12.1.1.1. Company Overview
- 12.1.1.2. Products
- 12.1.1.3. Company Financials
- 12.1.1.4. SWOT Analysis
- 12.1.2 Tawal Com SA
- 12.1.2.1. Company Overview
- 12.1.2.2. Products
- 12.1.2.3. Company Financials
- 12.1.2.4. SWOT Analysis
- 12.1.3 Grup TorreSur
- 12.1.3.1. Company Overview
- 12.1.3.2. Products
- 12.1.3.3. Company Financials
- 12.1.3.4. SWOT Analysis
- 12.1.4 Deutsche Funkturm
- 12.1.4.1. Company Overview
- 12.1.4.2. Products
- 12.1.4.3. Company Financials
- 12.1.4.4. SWOT Analysis
- 12.1.5 Telxius Telecom SA
- 12.1.5.1. Company Overview
- 12.1.5.2. Products
- 12.1.5.3. Company Financials
- 12.1.5.4. SWOT Analysis
- 12.1.6 CellnexTelecom
- 12.1.6.1. Company Overview
- 12.1.6.2. Products
- 12.1.6.3. Company Financials
- 12.1.6.4. SWOT Analysis
- 12.1.7 Telesites SAB de CV
- 12.1.7.1. Company Overview
- 12.1.7.2. Products
- 12.1.7.3. Company Financials
- 12.1.7.4. SWOT Analysis
- 12.1.8 IHS Towers (IHS Holding Limited)
- 12.1.8.1. Company Overview
- 12.1.8.2. Products
- 12.1.8.3. Company Financials
- 12.1.8.4. SWOT Analysis
- 12.1.9 Zong Pakistan
- 12.1.9.1. Company Overview
- 12.1.9.2. Products
- 12.1.9.3. Company Financials
- 12.1.9.4. SWOT Analysis
- 12.1.10 Telkom Indonesia
- 12.1.10.1. Company Overview
- 12.1.10.2. Products
- 12.1.10.3. Company Financials
- 12.1.10.4. SWOT Analysis
- 12.1.11 Helios Towers Africa
- 12.1.11.1. Company Overview
- 12.1.11.2. Products
- 12.1.11.3. Company Financials
- 12.1.11.4. SWOT Analysis
- 12.1.12 American Tower Corporation
- 12.1.12.1. Company Overview
- 12.1.12.2. Products
- 12.1.12.3. Company Financials
- 12.1.12.4. SWOT Analysis
- 12.1.13 China Tower Corporation
- 12.1.13.1. Company Overview
- 12.1.13.2. Products
- 12.1.13.3. Company Financials
- 12.1.13.4. SWOT Analysis
- 12.1.14 Orange
- 12.1.14.1. Company Overview
- 12.1.14.2. Products
- 12.1.14.3. Company Financials
- 12.1.14.4. SWOT Analysis
- 12.1.15 Indus Towers Limited (Bharti Infratel)
- 12.1.15.1. Company Overview
- 12.1.15.2. Products
- 12.1.15.3. Company Financials
- 12.1.15.4. SWOT Analysis
- 12.1.16 First Tower Company
- 12.1.16.1. Company Overview
- 12.1.16.2. Products
- 12.1.16.3. Company Financials
- 12.1.16.4. SWOT Analysis
- 12.1.17 Telenor ASA
- 12.1.17.1. Company Overview
- 12.1.17.2. Products
- 12.1.17.3. Company Financials
- 12.1.17.4. SWOT Analysis
- 12.1.18 GTL Infrastructure Limited
- 12.1.18.1. Company Overview
- 12.1.18.2. Products
- 12.1.18.3. Company Financials
- 12.1.18.4. SWOT Analysis
- 12.1.19 Crown Castle International Corporation
- 12.1.19.1. Company Overview
- 12.1.19.2. Products
- 12.1.19.3. Company Financials
- 12.1.19.4. SWOT Analysis
- 12.1.20 AT&T Inc
- 12.1.20.1. Company Overview
- 12.1.20.2. Products
- 12.1.20.3. Company Financials
- 12.1.20.4. SWOT Analysis
- 12.1.21 T-Mobile USA Inc
- 12.1.21.1. Company Overview
- 12.1.21.2. Products
- 12.1.21.3. Company Financials
- 12.1.21.4. SWOT Analysis
- 12.1.1 SBA Communications Corporation
- 12.2. Market Entropy
- 12.2.1 Company's Key Areas Served
- 12.2.2 Recent Developments
- 12.3. Company Market Share Analysis 2025
- 12.3.1 Top 5 Companies Market Share Analysis
- 12.3.2 Top 3 Companies Market Share Analysis
- 12.4. List of Potential Customers
- 13. Research Methodology
List of Figures
- Figure 1: Global Telecom Towers Market Revenue Breakdown (Million, %) by Region 2025 & 2033
- Figure 2: Global Telecom Towers Market Volume Breakdown (K Unit, %) by Region 2025 & 2033
- Figure 3: North America Telecom Towers Market Revenue (Million), by Fuel Type 2025 & 2033
- Figure 4: North America Telecom Towers Market Volume (K Unit), by Fuel Type 2025 & 2033
- Figure 5: North America Telecom Towers Market Revenue Share (%), by Fuel Type 2025 & 2033
- Figure 6: North America Telecom Towers Market Volume Share (%), by Fuel Type 2025 & 2033
- Figure 7: North America Telecom Towers Market Revenue (Million), by Type of Tower 2025 & 2033
- Figure 8: North America Telecom Towers Market Volume (K Unit), by Type of Tower 2025 & 2033
- Figure 9: North America Telecom Towers Market Revenue Share (%), by Type of Tower 2025 & 2033
- Figure 10: North America Telecom Towers Market Volume Share (%), by Type of Tower 2025 & 2033
- Figure 11: North America Telecom Towers Market Revenue (Million), by Installation 2025 & 2033
- Figure 12: North America Telecom Towers Market Volume (K Unit), by Installation 2025 & 2033
- Figure 13: North America Telecom Towers Market Revenue Share (%), by Installation 2025 & 2033
- Figure 14: North America Telecom Towers Market Volume Share (%), by Installation 2025 & 2033
- Figure 15: North America Telecom Towers Market Revenue (Million), by Ownership 2025 & 2033
- Figure 16: North America Telecom Towers Market Volume (K Unit), by Ownership 2025 & 2033
- Figure 17: North America Telecom Towers Market Revenue Share (%), by Ownership 2025 & 2033
- Figure 18: North America Telecom Towers Market Volume Share (%), by Ownership 2025 & 2033
- Figure 19: North America Telecom Towers Market Revenue (Million), by Country 2025 & 2033
- Figure 20: North America Telecom Towers Market Volume (K Unit), by Country 2025 & 2033
- Figure 21: North America Telecom Towers Market Revenue Share (%), by Country 2025 & 2033
- Figure 22: North America Telecom Towers Market Volume Share (%), by Country 2025 & 2033
- Figure 23: Europe Telecom Towers Market Revenue (Million), by Fuel Type 2025 & 2033
- Figure 24: Europe Telecom Towers Market Volume (K Unit), by Fuel Type 2025 & 2033
- Figure 25: Europe Telecom Towers Market Revenue Share (%), by Fuel Type 2025 & 2033
- Figure 26: Europe Telecom Towers Market Volume Share (%), by Fuel Type 2025 & 2033
- Figure 27: Europe Telecom Towers Market Revenue (Million), by Type of Tower 2025 & 2033
- Figure 28: Europe Telecom Towers Market Volume (K Unit), by Type of Tower 2025 & 2033
- Figure 29: Europe Telecom Towers Market Revenue Share (%), by Type of Tower 2025 & 2033
- Figure 30: Europe Telecom Towers Market Volume Share (%), by Type of Tower 2025 & 2033
- Figure 31: Europe Telecom Towers Market Revenue (Million), by Installation 2025 & 2033
- Figure 32: Europe Telecom Towers Market Volume (K Unit), by Installation 2025 & 2033
- Figure 33: Europe Telecom Towers Market Revenue Share (%), by Installation 2025 & 2033
- Figure 34: Europe Telecom Towers Market Volume Share (%), by Installation 2025 & 2033
- Figure 35: Europe Telecom Towers Market Revenue (Million), by Ownership 2025 & 2033
- Figure 36: Europe Telecom Towers Market Volume (K Unit), by Ownership 2025 & 2033
- Figure 37: Europe Telecom Towers Market Revenue Share (%), by Ownership 2025 & 2033
- Figure 38: Europe Telecom Towers Market Volume Share (%), by Ownership 2025 & 2033
- Figure 39: Europe Telecom Towers Market Revenue (Million), by Country 2025 & 2033
- Figure 40: Europe Telecom Towers Market Volume (K Unit), by Country 2025 & 2033
- Figure 41: Europe Telecom Towers Market Revenue Share (%), by Country 2025 & 2033
- Figure 42: Europe Telecom Towers Market Volume Share (%), by Country 2025 & 2033
- Figure 43: Asia Pacific Telecom Towers Market Revenue (Million), by Fuel Type 2025 & 2033
- Figure 44: Asia Pacific Telecom Towers Market Volume (K Unit), by Fuel Type 2025 & 2033
- Figure 45: Asia Pacific Telecom Towers Market Revenue Share (%), by Fuel Type 2025 & 2033
- Figure 46: Asia Pacific Telecom Towers Market Volume Share (%), by Fuel Type 2025 & 2033
- Figure 47: Asia Pacific Telecom Towers Market Revenue (Million), by Type of Tower 2025 & 2033
- Figure 48: Asia Pacific Telecom Towers Market Volume (K Unit), by Type of Tower 2025 & 2033
- Figure 49: Asia Pacific Telecom Towers Market Revenue Share (%), by Type of Tower 2025 & 2033
- Figure 50: Asia Pacific Telecom Towers Market Volume Share (%), by Type of Tower 2025 & 2033
- Figure 51: Asia Pacific Telecom Towers Market Revenue (Million), by Installation 2025 & 2033
- Figure 52: Asia Pacific Telecom Towers Market Volume (K Unit), by Installation 2025 & 2033
- Figure 53: Asia Pacific Telecom Towers Market Revenue Share (%), by Installation 2025 & 2033
- Figure 54: Asia Pacific Telecom Towers Market Volume Share (%), by Installation 2025 & 2033
- Figure 55: Asia Pacific Telecom Towers Market Revenue (Million), by Ownership 2025 & 2033
- Figure 56: Asia Pacific Telecom Towers Market Volume (K Unit), by Ownership 2025 & 2033
- Figure 57: Asia Pacific Telecom Towers Market Revenue Share (%), by Ownership 2025 & 2033
- Figure 58: Asia Pacific Telecom Towers Market Volume Share (%), by Ownership 2025 & 2033
- Figure 59: Asia Pacific Telecom Towers Market Revenue (Million), by Country 2025 & 2033
- Figure 60: Asia Pacific Telecom Towers Market Volume (K Unit), by Country 2025 & 2033
- Figure 61: Asia Pacific Telecom Towers Market Revenue Share (%), by Country 2025 & 2033
- Figure 62: Asia Pacific Telecom Towers Market Volume Share (%), by Country 2025 & 2033
- Figure 63: Latin America Telecom Towers Market Revenue (Million), by Fuel Type 2025 & 2033
- Figure 64: Latin America Telecom Towers Market Volume (K Unit), by Fuel Type 2025 & 2033
- Figure 65: Latin America Telecom Towers Market Revenue Share (%), by Fuel Type 2025 & 2033
- Figure 66: Latin America Telecom Towers Market Volume Share (%), by Fuel Type 2025 & 2033
- Figure 67: Latin America Telecom Towers Market Revenue (Million), by Type of Tower 2025 & 2033
- Figure 68: Latin America Telecom Towers Market Volume (K Unit), by Type of Tower 2025 & 2033
- Figure 69: Latin America Telecom Towers Market Revenue Share (%), by Type of Tower 2025 & 2033
- Figure 70: Latin America Telecom Towers Market Volume Share (%), by Type of Tower 2025 & 2033
- Figure 71: Latin America Telecom Towers Market Revenue (Million), by Installation 2025 & 2033
- Figure 72: Latin America Telecom Towers Market Volume (K Unit), by Installation 2025 & 2033
- Figure 73: Latin America Telecom Towers Market Revenue Share (%), by Installation 2025 & 2033
- Figure 74: Latin America Telecom Towers Market Volume Share (%), by Installation 2025 & 2033
- Figure 75: Latin America Telecom Towers Market Revenue (Million), by Ownership 2025 & 2033
- Figure 76: Latin America Telecom Towers Market Volume (K Unit), by Ownership 2025 & 2033
- Figure 77: Latin America Telecom Towers Market Revenue Share (%), by Ownership 2025 & 2033
- Figure 78: Latin America Telecom Towers Market Volume Share (%), by Ownership 2025 & 2033
- Figure 79: Latin America Telecom Towers Market Revenue (Million), by Country 2025 & 2033
- Figure 80: Latin America Telecom Towers Market Volume (K Unit), by Country 2025 & 2033
- Figure 81: Latin America Telecom Towers Market Revenue Share (%), by Country 2025 & 2033
- Figure 82: Latin America Telecom Towers Market Volume Share (%), by Country 2025 & 2033
- Figure 83: Middle East and Africa Telecom Towers Market Revenue (Million), by Fuel Type 2025 & 2033
- Figure 84: Middle East and Africa Telecom Towers Market Volume (K Unit), by Fuel Type 2025 & 2033
- Figure 85: Middle East and Africa Telecom Towers Market Revenue Share (%), by Fuel Type 2025 & 2033
- Figure 86: Middle East and Africa Telecom Towers Market Volume Share (%), by Fuel Type 2025 & 2033
- Figure 87: Middle East and Africa Telecom Towers Market Revenue (Million), by Type of Tower 2025 & 2033
- Figure 88: Middle East and Africa Telecom Towers Market Volume (K Unit), by Type of Tower 2025 & 2033
- Figure 89: Middle East and Africa Telecom Towers Market Revenue Share (%), by Type of Tower 2025 & 2033
- Figure 90: Middle East and Africa Telecom Towers Market Volume Share (%), by Type of Tower 2025 & 2033
- Figure 91: Middle East and Africa Telecom Towers Market Revenue (Million), by Installation 2025 & 2033
- Figure 92: Middle East and Africa Telecom Towers Market Volume (K Unit), by Installation 2025 & 2033
- Figure 93: Middle East and Africa Telecom Towers Market Revenue Share (%), by Installation 2025 & 2033
- Figure 94: Middle East and Africa Telecom Towers Market Volume Share (%), by Installation 2025 & 2033
- Figure 95: Middle East and Africa Telecom Towers Market Revenue (Million), by Ownership 2025 & 2033
- Figure 96: Middle East and Africa Telecom Towers Market Volume (K Unit), by Ownership 2025 & 2033
- Figure 97: Middle East and Africa Telecom Towers Market Revenue Share (%), by Ownership 2025 & 2033
- Figure 98: Middle East and Africa Telecom Towers Market Volume Share (%), by Ownership 2025 & 2033
- Figure 99: Middle East and Africa Telecom Towers Market Revenue (Million), by Country 2025 & 2033
- Figure 100: Middle East and Africa Telecom Towers Market Volume (K Unit), by Country 2025 & 2033
- Figure 101: Middle East and Africa Telecom Towers Market Revenue Share (%), by Country 2025 & 2033
- Figure 102: Middle East and Africa Telecom Towers Market Volume Share (%), by Country 2025 & 2033
List of Tables
- Table 1: Global Telecom Towers Market Revenue Million Forecast, by Fuel Type 2020 & 2033
- Table 2: Global Telecom Towers Market Volume K Unit Forecast, by Fuel Type 2020 & 2033
- Table 3: Global Telecom Towers Market Revenue Million Forecast, by Type of Tower 2020 & 2033
- Table 4: Global Telecom Towers Market Volume K Unit Forecast, by Type of Tower 2020 & 2033
- Table 5: Global Telecom Towers Market Revenue Million Forecast, by Installation 2020 & 2033
- Table 6: Global Telecom Towers Market Volume K Unit Forecast, by Installation 2020 & 2033
- Table 7: Global Telecom Towers Market Revenue Million Forecast, by Ownership 2020 & 2033
- Table 8: Global Telecom Towers Market Volume K Unit Forecast, by Ownership 2020 & 2033
- Table 9: Global Telecom Towers Market Revenue Million Forecast, by Region 2020 & 2033
- Table 10: Global Telecom Towers Market Volume K Unit Forecast, by Region 2020 & 2033
- Table 11: Global Telecom Towers Market Revenue Million Forecast, by Fuel Type 2020 & 2033
- Table 12: Global Telecom Towers Market Volume K Unit Forecast, by Fuel Type 2020 & 2033
- Table 13: Global Telecom Towers Market Revenue Million Forecast, by Type of Tower 2020 & 2033
- Table 14: Global Telecom Towers Market Volume K Unit Forecast, by Type of Tower 2020 & 2033
- Table 15: Global Telecom Towers Market Revenue Million Forecast, by Installation 2020 & 2033
- Table 16: Global Telecom Towers Market Volume K Unit Forecast, by Installation 2020 & 2033
- Table 17: Global Telecom Towers Market Revenue Million Forecast, by Ownership 2020 & 2033
- Table 18: Global Telecom Towers Market Volume K Unit Forecast, by Ownership 2020 & 2033
- Table 19: Global Telecom Towers Market Revenue Million Forecast, by Country 2020 & 2033
- Table 20: Global Telecom Towers Market Volume K Unit Forecast, by Country 2020 & 2033
- Table 21: United States Telecom Towers Market Revenue (Million) Forecast, by Application 2020 & 2033
- Table 22: United States Telecom Towers Market Volume (K Unit) Forecast, by Application 2020 & 2033
- Table 23: Canada Telecom Towers Market Revenue (Million) Forecast, by Application 2020 & 2033
- Table 24: Canada Telecom Towers Market Volume (K Unit) Forecast, by Application 2020 & 2033
- Table 25: Global Telecom Towers Market Revenue Million Forecast, by Fuel Type 2020 & 2033
- Table 26: Global Telecom Towers Market Volume K Unit Forecast, by Fuel Type 2020 & 2033
- Table 27: Global Telecom Towers Market Revenue Million Forecast, by Type of Tower 2020 & 2033
- Table 28: Global Telecom Towers Market Volume K Unit Forecast, by Type of Tower 2020 & 2033
- Table 29: Global Telecom Towers Market Revenue Million Forecast, by Installation 2020 & 2033
- Table 30: Global Telecom Towers Market Volume K Unit Forecast, by Installation 2020 & 2033
- Table 31: Global Telecom Towers Market Revenue Million Forecast, by Ownership 2020 & 2033
- Table 32: Global Telecom Towers Market Volume K Unit Forecast, by Ownership 2020 & 2033
- Table 33: Global Telecom Towers Market Revenue Million Forecast, by Country 2020 & 2033
- Table 34: Global Telecom Towers Market Volume K Unit Forecast, by Country 2020 & 2033
- Table 35: United Kingdom Telecom Towers Market Revenue (Million) Forecast, by Application 2020 & 2033
- Table 36: United Kingdom Telecom Towers Market Volume (K Unit) Forecast, by Application 2020 & 2033
- Table 37: Germany Telecom Towers Market Revenue (Million) Forecast, by Application 2020 & 2033
- Table 38: Germany Telecom Towers Market Volume (K Unit) Forecast, by Application 2020 & 2033
- Table 39: France Telecom Towers Market Revenue (Million) Forecast, by Application 2020 & 2033
- Table 40: France Telecom Towers Market Volume (K Unit) Forecast, by Application 2020 & 2033
- Table 41: Italy Telecom Towers Market Revenue (Million) Forecast, by Application 2020 & 2033
- Table 42: Italy Telecom Towers Market Volume (K Unit) Forecast, by Application 2020 & 2033
- Table 43: Spain Telecom Towers Market Revenue (Million) Forecast, by Application 2020 & 2033
- Table 44: Spain Telecom Towers Market Volume (K Unit) Forecast, by Application 2020 & 2033
- Table 45: Netherlands Telecom Towers Market Revenue (Million) Forecast, by Application 2020 & 2033
- Table 46: Netherlands Telecom Towers Market Volume (K Unit) Forecast, by Application 2020 & 2033
- Table 47: Sweden Telecom Towers Market Revenue (Million) Forecast, by Application 2020 & 2033
- Table 48: Sweden Telecom Towers Market Volume (K Unit) Forecast, by Application 2020 & 2033
- Table 49: Switzerland Telecom Towers Market Revenue (Million) Forecast, by Application 2020 & 2033
- Table 50: Switzerland Telecom Towers Market Volume (K Unit) Forecast, by Application 2020 & 2033
- Table 51: Rest of Europe Telecom Towers Market Revenue (Million) Forecast, by Application 2020 & 2033
- Table 52: Rest of Europe Telecom Towers Market Volume (K Unit) Forecast, by Application 2020 & 2033
- Table 53: Global Telecom Towers Market Revenue Million Forecast, by Fuel Type 2020 & 2033
- Table 54: Global Telecom Towers Market Volume K Unit Forecast, by Fuel Type 2020 & 2033
- Table 55: Global Telecom Towers Market Revenue Million Forecast, by Type of Tower 2020 & 2033
- Table 56: Global Telecom Towers Market Volume K Unit Forecast, by Type of Tower 2020 & 2033
- Table 57: Global Telecom Towers Market Revenue Million Forecast, by Installation 2020 & 2033
- Table 58: Global Telecom Towers Market Volume K Unit Forecast, by Installation 2020 & 2033
- Table 59: Global Telecom Towers Market Revenue Million Forecast, by Ownership 2020 & 2033
- Table 60: Global Telecom Towers Market Volume K Unit Forecast, by Ownership 2020 & 2033
- Table 61: Global Telecom Towers Market Revenue Million Forecast, by Country 2020 & 2033
- Table 62: Global Telecom Towers Market Volume K Unit Forecast, by Country 2020 & 2033
- Table 63: China Telecom Towers Market Revenue (Million) Forecast, by Application 2020 & 2033
- Table 64: China Telecom Towers Market Volume (K Unit) Forecast, by Application 2020 & 2033
- Table 65: India Telecom Towers Market Revenue (Million) Forecast, by Application 2020 & 2033
- Table 66: India Telecom Towers Market Volume (K Unit) Forecast, by Application 2020 & 2033
- Table 67: Japan Telecom Towers Market Revenue (Million) Forecast, by Application 2020 & 2033
- Table 68: Japan Telecom Towers Market Volume (K Unit) Forecast, by Application 2020 & 2033
- Table 69: South Korea Telecom Towers Market Revenue (Million) Forecast, by Application 2020 & 2033
- Table 70: South Korea Telecom Towers Market Volume (K Unit) Forecast, by Application 2020 & 2033
- Table 71: Indonesia Telecom Towers Market Revenue (Million) Forecast, by Application 2020 & 2033
- Table 72: Indonesia Telecom Towers Market Volume (K Unit) Forecast, by Application 2020 & 2033
- Table 73: Vietnam Telecom Towers Market Revenue (Million) Forecast, by Application 2020 & 2033
- Table 74: Vietnam Telecom Towers Market Volume (K Unit) Forecast, by Application 2020 & 2033
- Table 75: Malaysia Telecom Towers Market Revenue (Million) Forecast, by Application 2020 & 2033
- Table 76: Malaysia Telecom Towers Market Volume (K Unit) Forecast, by Application 2020 & 2033
- Table 77: Philippines Telecom Towers Market Revenue (Million) Forecast, by Application 2020 & 2033
- Table 78: Philippines Telecom Towers Market Volume (K Unit) Forecast, by Application 2020 & 2033
- Table 79: Australia and New Zealand Telecom Towers Market Revenue (Million) Forecast, by Application 2020 & 2033
- Table 80: Australia and New Zealand Telecom Towers Market Volume (K Unit) Forecast, by Application 2020 & 2033
- Table 81: Rest of Asia Pacific Telecom Towers Market Revenue (Million) Forecast, by Application 2020 & 2033
- Table 82: Rest of Asia Pacific Telecom Towers Market Volume (K Unit) Forecast, by Application 2020 & 2033
- Table 83: Global Telecom Towers Market Revenue Million Forecast, by Fuel Type 2020 & 2033
- Table 84: Global Telecom Towers Market Volume K Unit Forecast, by Fuel Type 2020 & 2033
- Table 85: Global Telecom Towers Market Revenue Million Forecast, by Type of Tower 2020 & 2033
- Table 86: Global Telecom Towers Market Volume K Unit Forecast, by Type of Tower 2020 & 2033
- Table 87: Global Telecom Towers Market Revenue Million Forecast, by Installation 2020 & 2033
- Table 88: Global Telecom Towers Market Volume K Unit Forecast, by Installation 2020 & 2033
- Table 89: Global Telecom Towers Market Revenue Million Forecast, by Ownership 2020 & 2033
- Table 90: Global Telecom Towers Market Volume K Unit Forecast, by Ownership 2020 & 2033
- Table 91: Global Telecom Towers Market Revenue Million Forecast, by Country 2020 & 2033
- Table 92: Global Telecom Towers Market Volume K Unit Forecast, by Country 2020 & 2033
- Table 93: Brazil Telecom Towers Market Revenue (Million) Forecast, by Application 2020 & 2033
- Table 94: Brazil Telecom Towers Market Volume (K Unit) Forecast, by Application 2020 & 2033
- Table 95: Mexico Telecom Towers Market Revenue (Million) Forecast, by Application 2020 & 2033
- Table 96: Mexico Telecom Towers Market Volume (K Unit) Forecast, by Application 2020 & 2033
- Table 97: Argentina Telecom Towers Market Revenue (Million) Forecast, by Application 2020 & 2033
- Table 98: Argentina Telecom Towers Market Volume (K Unit) Forecast, by Application 2020 & 2033
- Table 99: Rest of Latin America Telecom Towers Market Revenue (Million) Forecast, by Application 2020 & 2033
- Table 100: Rest of Latin America Telecom Towers Market Volume (K Unit) Forecast, by Application 2020 & 2033
- Table 101: Global Telecom Towers Market Revenue Million Forecast, by Fuel Type 2020 & 2033
- Table 102: Global Telecom Towers Market Volume K Unit Forecast, by Fuel Type 2020 & 2033
- Table 103: Global Telecom Towers Market Revenue Million Forecast, by Type of Tower 2020 & 2033
- Table 104: Global Telecom Towers Market Volume K Unit Forecast, by Type of Tower 2020 & 2033
- Table 105: Global Telecom Towers Market Revenue Million Forecast, by Installation 2020 & 2033
- Table 106: Global Telecom Towers Market Volume K Unit Forecast, by Installation 2020 & 2033
- Table 107: Global Telecom Towers Market Revenue Million Forecast, by Ownership 2020 & 2033
- Table 108: Global Telecom Towers Market Volume K Unit Forecast, by Ownership 2020 & 2033
- Table 109: Global Telecom Towers Market Revenue Million Forecast, by Country 2020 & 2033
- Table 110: Global Telecom Towers Market Volume K Unit Forecast, by Country 2020 & 2033
- Table 111: Saudi Arabia Telecom Towers Market Revenue (Million) Forecast, by Application 2020 & 2033
- Table 112: Saudi Arabia Telecom Towers Market Volume (K Unit) Forecast, by Application 2020 & 2033
- Table 113: Egypt Telecom Towers Market Revenue (Million) Forecast, by Application 2020 & 2033
- Table 114: Egypt Telecom Towers Market Volume (K Unit) Forecast, by Application 2020 & 2033
- Table 115: Algeria Telecom Towers Market Revenue (Million) Forecast, by Application 2020 & 2033
- Table 116: Algeria Telecom Towers Market Volume (K Unit) Forecast, by Application 2020 & 2033
- Table 117: Nigeria Telecom Towers Market Revenue (Million) Forecast, by Application 2020 & 2033
- Table 118: Nigeria Telecom Towers Market Volume (K Unit) Forecast, by Application 2020 & 2033
- Table 119: South Africa Telecom Towers Market Revenue (Million) Forecast, by Application 2020 & 2033
- Table 120: South Africa Telecom Towers Market Volume (K Unit) Forecast, by Application 2020 & 2033
- Table 121: Tanzania Telecom Towers Market Revenue (Million) Forecast, by Application 2020 & 2033
- Table 122: Tanzania Telecom Towers Market Volume (K Unit) Forecast, by Application 2020 & 2033
- Table 123: Morocco Telecom Towers Market Revenue (Million) Forecast, by Application 2020 & 2033
- Table 124: Morocco Telecom Towers Market Volume (K Unit) Forecast, by Application 2020 & 2033
- Table 125: Rest of Middle East and Africa Telecom Towers Market Revenue (Million) Forecast, by Application 2020 & 2033
- Table 126: Rest of Middle East and Africa Telecom Towers Market Volume (K Unit) Forecast, by Application 2020 & 2033
Frequently Asked Questions
1. What is the projected Compound Annual Growth Rate (CAGR) of the Telecom Towers Market?
The projected CAGR is approximately 2.84%.
2. Which companies are prominent players in the Telecom Towers Market?
Key companies in the market include SBA Communications Corporation, Tawal Com SA, Grup TorreSur, Deutsche Funkturm, Telxius Telecom SA, CellnexTelecom, Telesites SAB de CV, IHS Towers (IHS Holding Limited), Zong Pakistan, Telkom Indonesia, Helios Towers Africa, American Tower Corporation, China Tower Corporation, Orange, Indus Towers Limited (Bharti Infratel), First Tower Company, Telenor ASA, GTL Infrastructure Limited, Crown Castle International Corporation, AT&T Inc, T-Mobile USA Inc.
3. What are the main segments of the Telecom Towers Market?
The market segments include Fuel Type, Type of Tower, Installation, Ownership.
4. Can you provide details about the market size?
The market size is estimated to be USD 28.48 Million as of 2022.
5. What are some drivers contributing to market growth?
Connecting/Improving Connectivity to Rural Areas; Improving and Catering to Increasing Data Needs.
6. What are the notable trends driving market growth?
Operator-owned Tower is Expected to Register a Significant Growth.
7. Are there any restraints impacting market growth?
; High Initial Investment and Cost of Maintenance.
8. Can you provide examples of recent developments in the market?
April 2023: The Government of India has launched 254 '4G mobile towers' in LAC villages in Arunachal Pradesh. Further, these 254 towers will provide 4G coverage in 336 villages, including several areas that have remained unconnected since Independence. Most of these towers are located in the villages bordering China to counter foreign telecom penetration. Furthermore, with the launch of this service, over 70 thousand people are expected to be benefitted.
9. What pricing options are available for accessing the report?
Pricing options include single-user, multi-user, and enterprise licenses priced at USD 4750, USD 5250, and USD 8750 respectively.
10. Is the market size provided in terms of value or volume?
The market size is provided in terms of value, measured in Million and volume, measured in K Unit.
11. Are there any specific market keywords associated with the report?
Yes, the market keyword associated with the report is "Telecom Towers Market," which aids in identifying and referencing the specific market segment covered.
12. How do I determine which pricing option suits my needs best?
The pricing options vary based on user requirements and access needs. Individual users may opt for single-user licenses, while businesses requiring broader access may choose multi-user or enterprise licenses for cost-effective access to the report.
13. Are there any additional resources or data provided in the Telecom Towers Market report?
While the report offers comprehensive insights, it's advisable to review the specific contents or supplementary materials provided to ascertain if additional resources or data are available.
14. How can I stay updated on further developments or reports in the Telecom Towers Market?
To stay informed about further developments, trends, and reports in the Telecom Towers Market, consider subscribing to industry newsletters, following relevant companies and organizations, or regularly checking reputable industry news sources and publications.
Methodology
Step 1 - Identification of Relevant Samples Size from Population Database


Step 2 - Approaches for Defining Global Market Size (Value, Volume* & Price*)

Note*: In applicable scenarios
Step 3 - Data Sources
Primary Research
- Web Analytics
- Survey Reports
- Research Institute
- Latest Research Reports
- Opinion Leaders
Secondary Research
- Annual Reports
- White Paper
- Latest Press Release
- Industry Association
- Paid Database
- Investor Presentations

Step 4 - Data Triangulation
Involves using different sources of information in order to increase the validity of a study
These sources are likely to be stakeholders in a program - participants, other researchers, program staff, other community members, and so on.
Then we put all data in single framework & apply various statistical tools to find out the dynamic on the market.
During the analysis stage, feedback from the stakeholder groups would be compared to determine areas of agreement as well as areas of divergence