

Key Insights
The Transaction Monitoring market is projected for significant growth, expected to reach $17.7 billion by 2025, driven by a robust CAGR of 16.9% through 2033. This expansion is attributed to escalating concerns over financial crime, including money laundering, fraud, and terrorist financing, necessitating advanced monitoring solutions. Increased regulatory compliance mandates worldwide compel financial institutions and businesses to invest in technologies for detecting and preventing illicit activities. The rise of digital payments and cross-border transactions further amplifies the demand for real-time, accurate transaction monitoring.
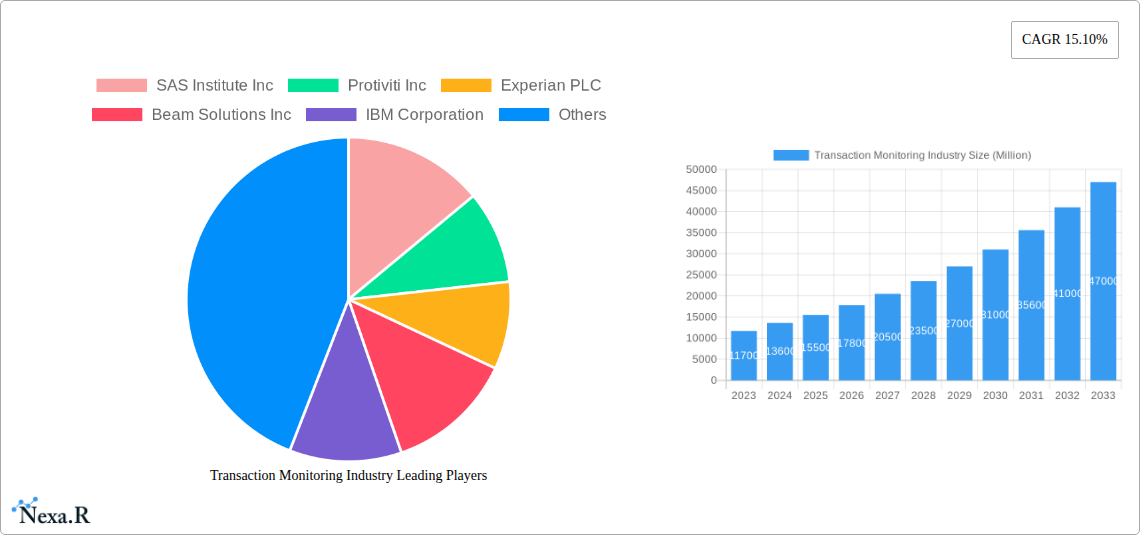
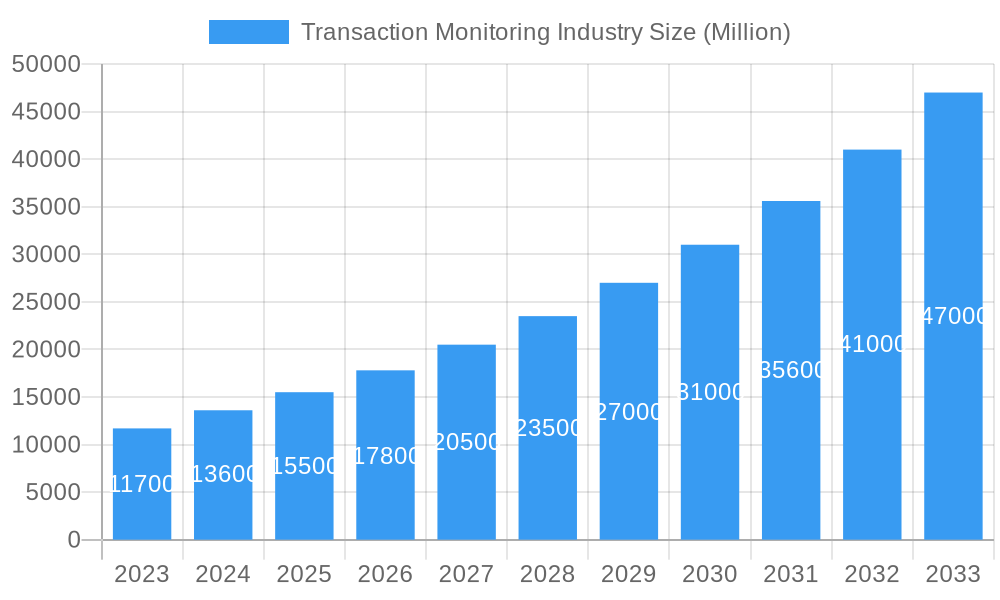
Transaction Monitoring Industry Market Size (In Billion)
The market encompasses both Solutions and Services, each demonstrating strong demand. Transaction monitoring solutions, featuring anomaly detection, risk scoring, and reporting software, are central. Essential services, such as implementation and support, are critical for effective deployment. Key growth drivers include regulatory compliance, evolving financial crime tactics, and awareness of non-compliance risks. Challenges include high implementation costs, integration complexities with legacy systems, and the need for skilled personnel. Leading companies like SAS Institute Inc., IBM Corporation, and Fair Isaac Corporation (FICO) are innovating to meet these demands.
Transaction Monitoring Industry Company Market Share
Comprehensive Transaction Monitoring Industry Report: Market Dynamics, Growth Forecasts, and Strategic Insights (2019-2033)
Unlock critical intelligence on the burgeoning global transaction monitoring market. This in-depth report delivers a complete analysis of market dynamics, growth trends, regional dominance, product innovations, key drivers, challenges, and emerging opportunities. Designed for financial institutions, technology providers, regulatory bodies, and investment firms, this report provides actionable insights to navigate the complexities of anti-money laundering (AML), fraud detection, and regulatory compliance. With a focus on the parent and child market segments, quantitative data, and expert analysis, this report is your essential guide to the future of transaction monitoring.
Transaction Monitoring Industry Market Dynamics & Structure
The transaction monitoring industry is characterized by a moderately consolidated market structure, driven by continuous technological innovation and stringent, evolving regulatory frameworks. Key drivers include the escalating sophistication of financial crime, the demand for real-time anomaly detection, and the increasing adoption of artificial intelligence (AI) and machine learning (ML) for enhanced accuracy and reduced false positives. The parent market, encompassing all transaction monitoring solutions and services, is influenced by the child market segments of AML transaction monitoring, fraud detection, and sanctions screening, each with its specialized requirements and growth trajectories. Regulatory mandates such as the Bank Secrecy Act (BSA) in the US and the EU's Anti-Money Laundering Directives continually shape industry standards and drive investment in advanced compliance tools. Competitive pressures are intensifying, with a growing number of solution providers vying for market share, leading to increased M&A activity as larger players seek to acquire innovative technologies and expand their service portfolios. Barriers to innovation include the high cost of R&D, the complexity of integrating disparate data sources, and the need for highly skilled personnel.
- Market Concentration: Moderately consolidated, with a few key players holding significant market share, alongside a growing number of niche providers.
- Technological Innovation Drivers: AI/ML for anomaly detection, real-time processing, big data analytics, cloud-based solutions, and enhanced data integration.
- Regulatory Frameworks: Strict AML, KYC (Know Your Customer), fraud prevention, and sanctions compliance regulations are primary growth catalysts.
- Competitive Product Substitutes: Basic rule-based systems, manual review processes, and internal compliance departments without specialized software.
- End-User Demographics: Primarily financial institutions (banks, credit unions, investment firms), fintech companies, payment processors, and increasingly, e-commerce platforms and other businesses handling large volumes of transactions.
- M&A Trends: Strategic acquisitions to gain market share, acquire advanced technologies, and expand geographical reach.
Transaction Monitoring Industry Growth Trends & Insights
The global transaction monitoring market is poised for robust expansion, driven by increasing financial crime sophistication and stringent regulatory enforcement. The market size is projected to grow from an estimated XX Million in 2025 to XX Million by 2033, exhibiting a compound annual growth rate (CAGR) of approximately XX% during the forecast period (2025–2033). This impressive growth is fueled by the relentless pursuit of financial institutions to bolster their defenses against money laundering, terrorist financing, and various forms of fraud. The adoption rates of advanced transaction monitoring solutions are rapidly increasing as organizations recognize the limitations of traditional, rule-based systems. Technological disruptions, particularly in AI and ML, are revolutionizing how transactions are screened and analyzed. These technologies enable systems to learn from patterns, detect sophisticated anomalies, and significantly reduce false positives, thereby improving operational efficiency and lowering compliance costs.
Consumer behavior shifts, influenced by the proliferation of digital payments and cross-border transactions, further necessitate more dynamic and intelligent monitoring systems. The growing volume and velocity of transactions across diverse channels create an ever-expanding attack surface for criminals, prompting a proactive approach to risk management. Cloud-based transaction monitoring solutions are gaining traction due to their scalability, flexibility, and cost-effectiveness, allowing businesses of all sizes to implement sophisticated monitoring capabilities. The increasing focus on real-time monitoring rather than batch processing is a critical trend, enabling financial institutions to identify and mitigate risks as they occur, minimizing potential financial and reputational damage. The market penetration of advanced transaction monitoring solutions is expected to deepen across various financial sectors, including banking, insurance, and capital markets. The growing awareness of data privacy and security concerns also drives the demand for robust monitoring solutions that can ensure compliance with regulations like GDPR.
Dominant Regions, Countries, or Segments in Transaction Monitoring Industry
The Solutions segment within the Component category is currently driving the most significant market growth in the transaction monitoring industry. This dominance stems from the increasing demand for comprehensive, integrated software platforms that can handle the complexity of modern financial transactions and regulatory requirements. North America, particularly the United States, stands out as the dominant region, owing to its robust financial sector, stringent regulatory landscape, and early adoption of advanced technologies. The presence of major financial hubs and a high volume of financial transactions within the US necessitate sophisticated transaction monitoring capabilities.
Key drivers for this regional and segmental dominance include:
- Economic Policies: Proactive government initiatives and a strong focus on financial crime prevention in the United States have fostered a receptive market for advanced transaction monitoring solutions.
- Infrastructure: A well-developed financial and technological infrastructure in North America supports the seamless implementation and operation of complex monitoring systems.
- Regulatory Frameworks: The presence of well-defined and rigorously enforced regulations, such as the USA PATRIOT Act and BSA, compels financial institutions to invest heavily in compliance technologies.
- Technological Advancement: Leading technology companies based in North America are at the forefront of developing and deploying AI-driven and cloud-based transaction monitoring solutions, further solidifying the region's leadership.
- Market Share: North America currently holds an estimated XX% market share in the global transaction monitoring market, with the Solutions segment accounting for approximately XX% of this share.
- Growth Potential: While established, North America continues to exhibit strong growth potential due to ongoing technological innovation and the persistent threat of financial crime. Asia-Pacific and Europe are also experiencing significant growth, driven by expanding financial markets and tightening regulations.
Transaction Monitoring Industry Product Landscape
The transaction monitoring industry is witnessing a surge in product innovation focused on leveraging advanced technologies like AI, machine learning, and big data analytics. Leading solutions now offer real-time anomaly detection, predictive analytics for fraud prevention, and sophisticated pattern recognition to identify illicit financial activities. Unique selling propositions include highly accurate alert generation with a significantly reduced false positive rate, seamless integration with existing banking systems, and comprehensive reporting capabilities for regulatory compliance. Technological advancements are enabling enhanced monitoring of complex transaction flows, including peer-to-peer payments, cryptocurrency transactions, and cross-border remittances, ensuring greater efficiency and effectiveness for financial institutions in their fight against financial crime.
Key Drivers, Barriers & Challenges in Transaction Monitoring Industry
Key Drivers:
- Escalating Financial Crime: The increasing sophistication and prevalence of money laundering, terrorist financing, and fraud are compelling organizations to adopt robust monitoring solutions.
- Stringent Regulatory Compliance: Evolving and stricter regulatory mandates globally necessitate advanced transaction monitoring tools to avoid hefty penalties.
- Technological Advancements: The integration of AI, machine learning, and big data analytics enhances detection accuracy and operational efficiency.
- Digital Transformation: The rise of digital payments and online transactions creates a larger attack surface, driving demand for real-time monitoring.
Barriers & Challenges:
- High Implementation Costs: The initial investment in sophisticated transaction monitoring systems can be substantial, posing a challenge for smaller institutions.
- Data Integration Complexity: Integrating diverse and often siloed data sources into a unified monitoring platform can be technically challenging and resource-intensive.
- Talent Shortage: A lack of skilled professionals with expertise in data science, AI, and financial crime compliance can hinder the effective deployment and management of these systems.
- False Positive Overload: While AI is improving, managing and investigating the sheer volume of alerts, including false positives, remains a significant operational challenge.
- Evolving Criminal Tactics: As monitoring technologies advance, criminals continuously adapt their methods, requiring constant updates and innovation in detection strategies.
Emerging Opportunities in Transaction Monitoring Industry
Emerging opportunities in the transaction monitoring industry lie in the expansion into new verticals beyond traditional financial institutions, such as e-commerce, gaming, and the burgeoning cryptocurrency and decentralized finance (DeFi) sectors. The development of specialized monitoring solutions tailored for these niche markets, capable of handling unique transaction types and regulatory nuances, presents significant growth potential. Furthermore, the increasing demand for cloud-native, scalable, and API-driven solutions that facilitate seamless integration and real-time data processing opens avenues for innovative product development. The rise of RegTech solutions that automate compliance processes and provide proactive risk assessments offers another lucrative area for market players.
Growth Accelerators in the Transaction Monitoring Industry Industry
The transaction monitoring industry is experiencing significant growth acceleration driven by several key factors. Technological breakthroughs in AI and machine learning are continuously enhancing the predictive capabilities and accuracy of monitoring systems, enabling faster and more effective detection of illicit activities. Strategic partnerships between technology providers, financial institutions, and regulatory bodies are fostering collaborative innovation and the development of industry-wide best practices. Furthermore, market expansion into emerging economies with rapidly growing financial sectors and increasing regulatory oversight presents substantial untapped potential. The ongoing digital transformation across industries, leading to a surge in digital transactions, creates a sustained demand for advanced monitoring solutions.
Key Players Shaping the Transaction Monitoring Industry Market
- SAS Institute Inc
- Protiviti Inc
- Experian PLC
- Beam Solutions Inc
- IBM Corporation
- ACTICO GmbH
- Infrasoft Technologies
- BAE Systems PLC
- Fair Isaac Corporation (FICO)
- Oracle Corporation
- Fidelity National Information Services Inc (FIS)
Notable Milestones in Transaction Monitoring Industry Sector
- Nov 2022: NetGuardians announced the extension of its NG|Screener platform to incorporate money-laundering transaction monitoring. This AML solution integrates internal and external data sources to detect behavioral anomalies, offering a potential transformation in AML approaches by enhancing effectiveness and efficiency for financial institutions. It monitors vast transaction volumes with high accuracy and reduced false warnings, aiming to boost operational effectiveness and lower expenses.
- Oct 2022: SAS Institute Inc. partnered with Neterium and Orange Bank to achieve real-time sanctions screening in the cloud. This collaboration leverages built-in AI and advanced screening technologies to improve detection relevance, providing analysts with a holistic, real-time view of AML risk.
In-Depth Transaction Monitoring Industry Market Outlook
The future of the transaction monitoring industry is exceptionally bright, fueled by a confluence of escalating threats and proactive regulatory responses. Growth accelerators will continue to include advancements in AI and ML for more sophisticated anomaly detection and predictive analytics. Strategic partnerships between technology firms and financial institutions will foster innovation and expand market reach. The increasing digitalization of global commerce will create an ever-growing need for real-time, high-volume transaction monitoring. Emerging markets represent significant untapped potential, while the continuous evolution of criminal tactics will necessitate ongoing investment in cutting-edge solutions. The industry is well-positioned for sustained expansion as it remains a critical component of financial integrity and security.
Transaction Monitoring Industry Segmentation
-
1. Component
- 1.1. Solutions
- 1.2. Services
Transaction Monitoring Industry Segmentation By Geography
- 1. North America
- 2. Europe
- 3. Asia Pacific
- 4. Latin America
- 5. Middle East and Africa
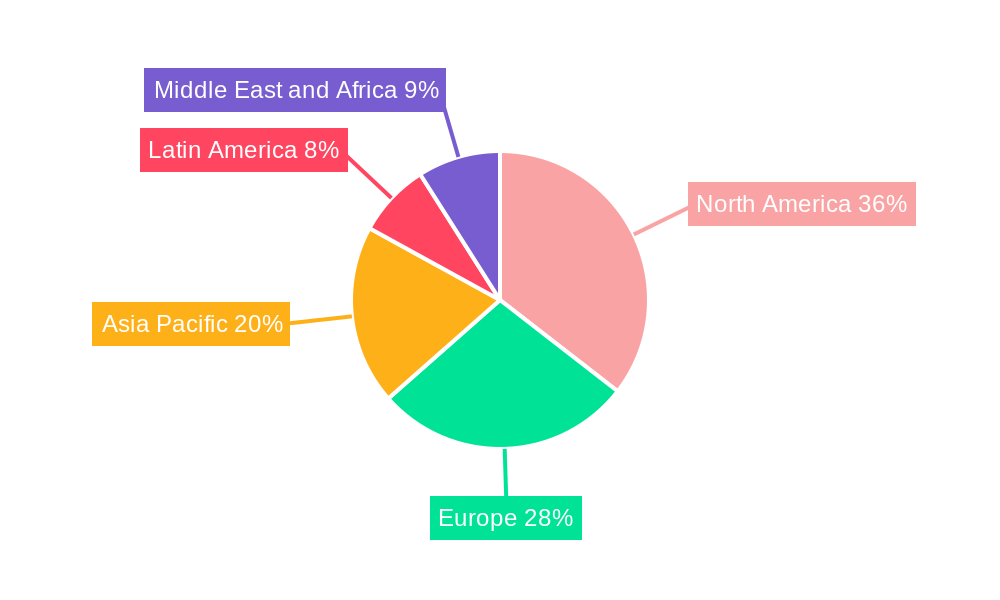
Transaction Monitoring Industry Regional Market Share
Geographic Coverage of Transaction Monitoring Industry
Transaction Monitoring Industry REPORT HIGHLIGHTS
| Aspects | Details |
|---|---|
| Study Period | 2020-2034 |
| Base Year | 2025 |
| Estimated Year | 2026 |
| Forecast Period | 2026-2034 |
| Historical Period | 2020-2025 |
| Growth Rate | CAGR of 16.9% from 2020-2034 |
| Segmentation |
|
Table of Contents
- 1. Introduction
- 1.1. Research Scope
- 1.2. Market Segmentation
- 1.3. Research Objective
- 1.4. Definitions and Assumptions
- 2. Executive Summary
- 2.1. Market Snapshot
- 3. Market Dynamics
- 3.1. Market Drivers
- 3.2. Market Restrains
- 3.3. Market Trends
- 3.4. Market Opportunities
- 4. Market Factor Analysis
- 4.1. Porters Five Forces
- 4.1.1. Bargaining Power of Suppliers
- 4.1.2. Bargaining Power of Buyers
- 4.1.3. Threat of New Entrants
- 4.1.4. Threat of Substitutes
- 4.1.5. Competitive Rivalry
- 4.2. PESTEL analysis
- 4.3. BCG Analysis
- 4.3.1. Stars (High Growth, High Market Share)
- 4.3.2. Cash Cows (Low Growth, High Market Share)
- 4.3.3. Question Mark (High Growth, Low Market Share)
- 4.3.4. Dogs (Low Growth, Low Market Share)
- 4.4. Ansoff Matrix Analysis
- 4.5. Supply Chain Analysis
- 4.6. Regulatory Landscape
- 4.7. Current Market Potential and Opportunity Assessment (TAM–SAM–SOM Framework)
- 4.8. NRP Analyst Note
- 4.1. Porters Five Forces
- 5. Market Analysis, Insights and Forecast 2021-2033
- 5.1. Market Analysis, Insights and Forecast - by Component
- 5.1.1. Solutions
- 5.1.2. Services
- 5.2. Market Analysis, Insights and Forecast - by Region
- 5.2.1. North America
- 5.2.2. Europe
- 5.2.3. Asia Pacific
- 5.2.4. Latin America
- 5.2.5. Middle East and Africa
- 5.1. Market Analysis, Insights and Forecast - by Component
- 6. Global Transaction Monitoring Industry Analysis, Insights and Forecast, 2021-2033
- 6.1. Market Analysis, Insights and Forecast - by Component
- 6.1.1. Solutions
- 6.1.2. Services
- 6.1. Market Analysis, Insights and Forecast - by Component
- 7. North America Transaction Monitoring Industry Analysis, Insights and Forecast, 2020-2032
- 7.1. Market Analysis, Insights and Forecast - by Component
- 7.1.1. Solutions
- 7.1.2. Services
- 7.1. Market Analysis, Insights and Forecast - by Component
- 8. Europe Transaction Monitoring Industry Analysis, Insights and Forecast, 2020-2032
- 8.1. Market Analysis, Insights and Forecast - by Component
- 8.1.1. Solutions
- 8.1.2. Services
- 8.1. Market Analysis, Insights and Forecast - by Component
- 9. Asia Pacific Transaction Monitoring Industry Analysis, Insights and Forecast, 2020-2032
- 9.1. Market Analysis, Insights and Forecast - by Component
- 9.1.1. Solutions
- 9.1.2. Services
- 9.1. Market Analysis, Insights and Forecast - by Component
- 10. Latin America Transaction Monitoring Industry Analysis, Insights and Forecast, 2020-2032
- 10.1. Market Analysis, Insights and Forecast - by Component
- 10.1.1. Solutions
- 10.1.2. Services
- 10.1. Market Analysis, Insights and Forecast - by Component
- 11. Middle East and Africa Transaction Monitoring Industry Analysis, Insights and Forecast, 2020-2032
- 11.1. Market Analysis, Insights and Forecast - by Component
- 11.1.1. Solutions
- 11.1.2. Services
- 11.1. Market Analysis, Insights and Forecast - by Component
- 12. Competitive Analysis
- 12.1. Company Profiles
- 12.1.1 SAS Institute Inc
- 12.1.1.1. Company Overview
- 12.1.1.2. Products
- 12.1.1.3. Company Financials
- 12.1.1.4. SWOT Analysis
- 12.1.2 Protiviti Inc
- 12.1.2.1. Company Overview
- 12.1.2.2. Products
- 12.1.2.3. Company Financials
- 12.1.2.4. SWOT Analysis
- 12.1.3 Experian PLC
- 12.1.3.1. Company Overview
- 12.1.3.2. Products
- 12.1.3.3. Company Financials
- 12.1.3.4. SWOT Analysis
- 12.1.4 Beam Solutions Inc
- 12.1.4.1. Company Overview
- 12.1.4.2. Products
- 12.1.4.3. Company Financials
- 12.1.4.4. SWOT Analysis
- 12.1.5 IBM Corporation
- 12.1.5.1. Company Overview
- 12.1.5.2. Products
- 12.1.5.3. Company Financials
- 12.1.5.4. SWOT Analysis
- 12.1.6 ACTICO GmbH
- 12.1.6.1. Company Overview
- 12.1.6.2. Products
- 12.1.6.3. Company Financials
- 12.1.6.4. SWOT Analysis
- 12.1.7 Infrasoft Technologies
- 12.1.7.1. Company Overview
- 12.1.7.2. Products
- 12.1.7.3. Company Financials
- 12.1.7.4. SWOT Analysis
- 12.1.8 BAE Systems PLC
- 12.1.8.1. Company Overview
- 12.1.8.2. Products
- 12.1.8.3. Company Financials
- 12.1.8.4. SWOT Analysis
- 12.1.9 Fair Isaac Corporation (FICO)
- 12.1.9.1. Company Overview
- 12.1.9.2. Products
- 12.1.9.3. Company Financials
- 12.1.9.4. SWOT Analysis
- 12.1.10 Oracle Corporation
- 12.1.10.1. Company Overview
- 12.1.10.2. Products
- 12.1.10.3. Company Financials
- 12.1.10.4. SWOT Analysis
- 12.1.11 Fidelity National Information Services Inc (FIS)
- 12.1.11.1. Company Overview
- 12.1.11.2. Products
- 12.1.11.3. Company Financials
- 12.1.11.4. SWOT Analysis
- 12.1.1 SAS Institute Inc
- 12.2. Market Entropy
- 12.2.1 Company's Key Areas Served
- 12.2.2 Recent Developments
- 12.3. Company Market Share Analysis 2025
- 12.3.1 Top 5 Companies Market Share Analysis
- 12.3.2 Top 3 Companies Market Share Analysis
- 12.4. List of Potential Customers
- 13. Research Methodology
List of Figures
- Figure 1: Global Transaction Monitoring Industry Revenue Breakdown (billion, %) by Region 2025 & 2033
- Figure 2: North America Transaction Monitoring Industry Revenue (billion), by Component 2025 & 2033
- Figure 3: North America Transaction Monitoring Industry Revenue Share (%), by Component 2025 & 2033
- Figure 4: North America Transaction Monitoring Industry Revenue (billion), by Country 2025 & 2033
- Figure 5: North America Transaction Monitoring Industry Revenue Share (%), by Country 2025 & 2033
- Figure 6: Europe Transaction Monitoring Industry Revenue (billion), by Component 2025 & 2033
- Figure 7: Europe Transaction Monitoring Industry Revenue Share (%), by Component 2025 & 2033
- Figure 8: Europe Transaction Monitoring Industry Revenue (billion), by Country 2025 & 2033
- Figure 9: Europe Transaction Monitoring Industry Revenue Share (%), by Country 2025 & 2033
- Figure 10: Asia Pacific Transaction Monitoring Industry Revenue (billion), by Component 2025 & 2033
- Figure 11: Asia Pacific Transaction Monitoring Industry Revenue Share (%), by Component 2025 & 2033
- Figure 12: Asia Pacific Transaction Monitoring Industry Revenue (billion), by Country 2025 & 2033
- Figure 13: Asia Pacific Transaction Monitoring Industry Revenue Share (%), by Country 2025 & 2033
- Figure 14: Latin America Transaction Monitoring Industry Revenue (billion), by Component 2025 & 2033
- Figure 15: Latin America Transaction Monitoring Industry Revenue Share (%), by Component 2025 & 2033
- Figure 16: Latin America Transaction Monitoring Industry Revenue (billion), by Country 2025 & 2033
- Figure 17: Latin America Transaction Monitoring Industry Revenue Share (%), by Country 2025 & 2033
- Figure 18: Middle East and Africa Transaction Monitoring Industry Revenue (billion), by Component 2025 & 2033
- Figure 19: Middle East and Africa Transaction Monitoring Industry Revenue Share (%), by Component 2025 & 2033
- Figure 20: Middle East and Africa Transaction Monitoring Industry Revenue (billion), by Country 2025 & 2033
- Figure 21: Middle East and Africa Transaction Monitoring Industry Revenue Share (%), by Country 2025 & 2033
List of Tables
- Table 1: Global Transaction Monitoring Industry Revenue billion Forecast, by Component 2020 & 2033
- Table 2: Global Transaction Monitoring Industry Revenue billion Forecast, by Region 2020 & 2033
- Table 3: Global Transaction Monitoring Industry Revenue billion Forecast, by Component 2020 & 2033
- Table 4: Global Transaction Monitoring Industry Revenue billion Forecast, by Country 2020 & 2033
- Table 5: Global Transaction Monitoring Industry Revenue billion Forecast, by Component 2020 & 2033
- Table 6: Global Transaction Monitoring Industry Revenue billion Forecast, by Country 2020 & 2033
- Table 7: Global Transaction Monitoring Industry Revenue billion Forecast, by Component 2020 & 2033
- Table 8: Global Transaction Monitoring Industry Revenue billion Forecast, by Country 2020 & 2033
- Table 9: Global Transaction Monitoring Industry Revenue billion Forecast, by Component 2020 & 2033
- Table 10: Global Transaction Monitoring Industry Revenue billion Forecast, by Country 2020 & 2033
- Table 11: Global Transaction Monitoring Industry Revenue billion Forecast, by Component 2020 & 2033
- Table 12: Global Transaction Monitoring Industry Revenue billion Forecast, by Country 2020 & 2033
Frequently Asked Questions
1. What is the projected Compound Annual Growth Rate (CAGR) of the Transaction Monitoring Industry?
The projected CAGR is approximately 16.9%.
2. Which companies are prominent players in the Transaction Monitoring Industry?
Key companies in the market include SAS Institute Inc, Protiviti Inc, Experian PLC, Beam Solutions Inc, IBM Corporation, ACTICO GmbH, Infrasoft Technologies, BAE Systems PLC, Fair Isaac Corporation (FICO), Oracle Corporation, Fidelity National Information Services Inc (FIS).
3. What are the main segments of the Transaction Monitoring Industry?
The market segments include Component.
4. Can you provide details about the market size?
The market size is estimated to be USD 17.7 billion as of 2022.
5. What are some drivers contributing to market growth?
Advancement in Transaction Monitoring Solution incorporating AI and ML; Increasing Stringent Regulatory Compliance.
6. What are the notable trends driving market growth?
Service to Witness the Growth.
7. Are there any restraints impacting market growth?
High Percentage of False Positives with Current Software Solutions.
8. Can you provide examples of recent developments in the market?
Nov 2022: NetGuardians announced that it extended its NG|Screener platform and applied it to money-laundering transaction monitoring. AML transaction monitoring solution integrates both internal and external sources of data to look for anomalies in behavior, where the new solution has the potential to transform the antiquated AML approaches and bring effectiveness and efficiency to financial institutions. In order to increase operational effectiveness and reduce expenses, it monitors massive quantities of transactions with extreme accuracy and a marked reduction in false warnings.
9. What pricing options are available for accessing the report?
Pricing options include single-user, multi-user, and enterprise licenses priced at USD 4750, USD 5250, and USD 8750 respectively.
10. Is the market size provided in terms of value or volume?
The market size is provided in terms of value, measured in billion.
11. Are there any specific market keywords associated with the report?
Yes, the market keyword associated with the report is "Transaction Monitoring Industry," which aids in identifying and referencing the specific market segment covered.
12. How do I determine which pricing option suits my needs best?
The pricing options vary based on user requirements and access needs. Individual users may opt for single-user licenses, while businesses requiring broader access may choose multi-user or enterprise licenses for cost-effective access to the report.
13. Are there any additional resources or data provided in the Transaction Monitoring Industry report?
While the report offers comprehensive insights, it's advisable to review the specific contents or supplementary materials provided to ascertain if additional resources or data are available.
14. How can I stay updated on further developments or reports in the Transaction Monitoring Industry?
To stay informed about further developments, trends, and reports in the Transaction Monitoring Industry, consider subscribing to industry newsletters, following relevant companies and organizations, or regularly checking reputable industry news sources and publications.
Methodology
Step 1 - Identification of Relevant Samples Size from Population Database


Step 2 - Approaches for Defining Global Market Size (Value, Volume* & Price*)

Note*: In applicable scenarios
Step 3 - Data Sources
Primary Research
- Web Analytics
- Survey Reports
- Research Institute
- Latest Research Reports
- Opinion Leaders
Secondary Research
- Annual Reports
- White Paper
- Latest Press Release
- Industry Association
- Paid Database
- Investor Presentations

Step 4 - Data Triangulation
Involves using different sources of information in order to increase the validity of a study
These sources are likely to be stakeholders in a program - participants, other researchers, program staff, other community members, and so on.
Then we put all data in single framework & apply various statistical tools to find out the dynamic on the market.
During the analysis stage, feedback from the stakeholder groups would be compared to determine areas of agreement as well as areas of divergence