

Key Insights
The Urban Rail Vehicle Connector market is experiencing robust growth, driven by the increasing global demand for efficient and sustainable public transportation solutions. With an estimated market size of $1197 million in 2025, the sector is poised for significant expansion, projected to grow at a Compound Annual Growth Rate (CAGR) of 5.7% through 2033. This upward trajectory is largely fueled by substantial investments in urban rail infrastructure projects worldwide, including the development of new metro lines, light rail systems, and high-speed rail networks. The crucial role connectors play in ensuring the reliable operation of critical systems such as optical fiber communication for data transmission, power transmission for traction and auxiliary systems, and signal control for safety and efficiency, makes them indispensable components in modern urban rail vehicles. Emerging economies, particularly in Asia Pacific, are witnessing rapid urbanization and a corresponding surge in rail transit development, acting as a major catalyst for market expansion. Furthermore, advancements in connector technology, focusing on enhanced durability, miniaturization, and improved signal integrity, are also contributing to market dynamism.
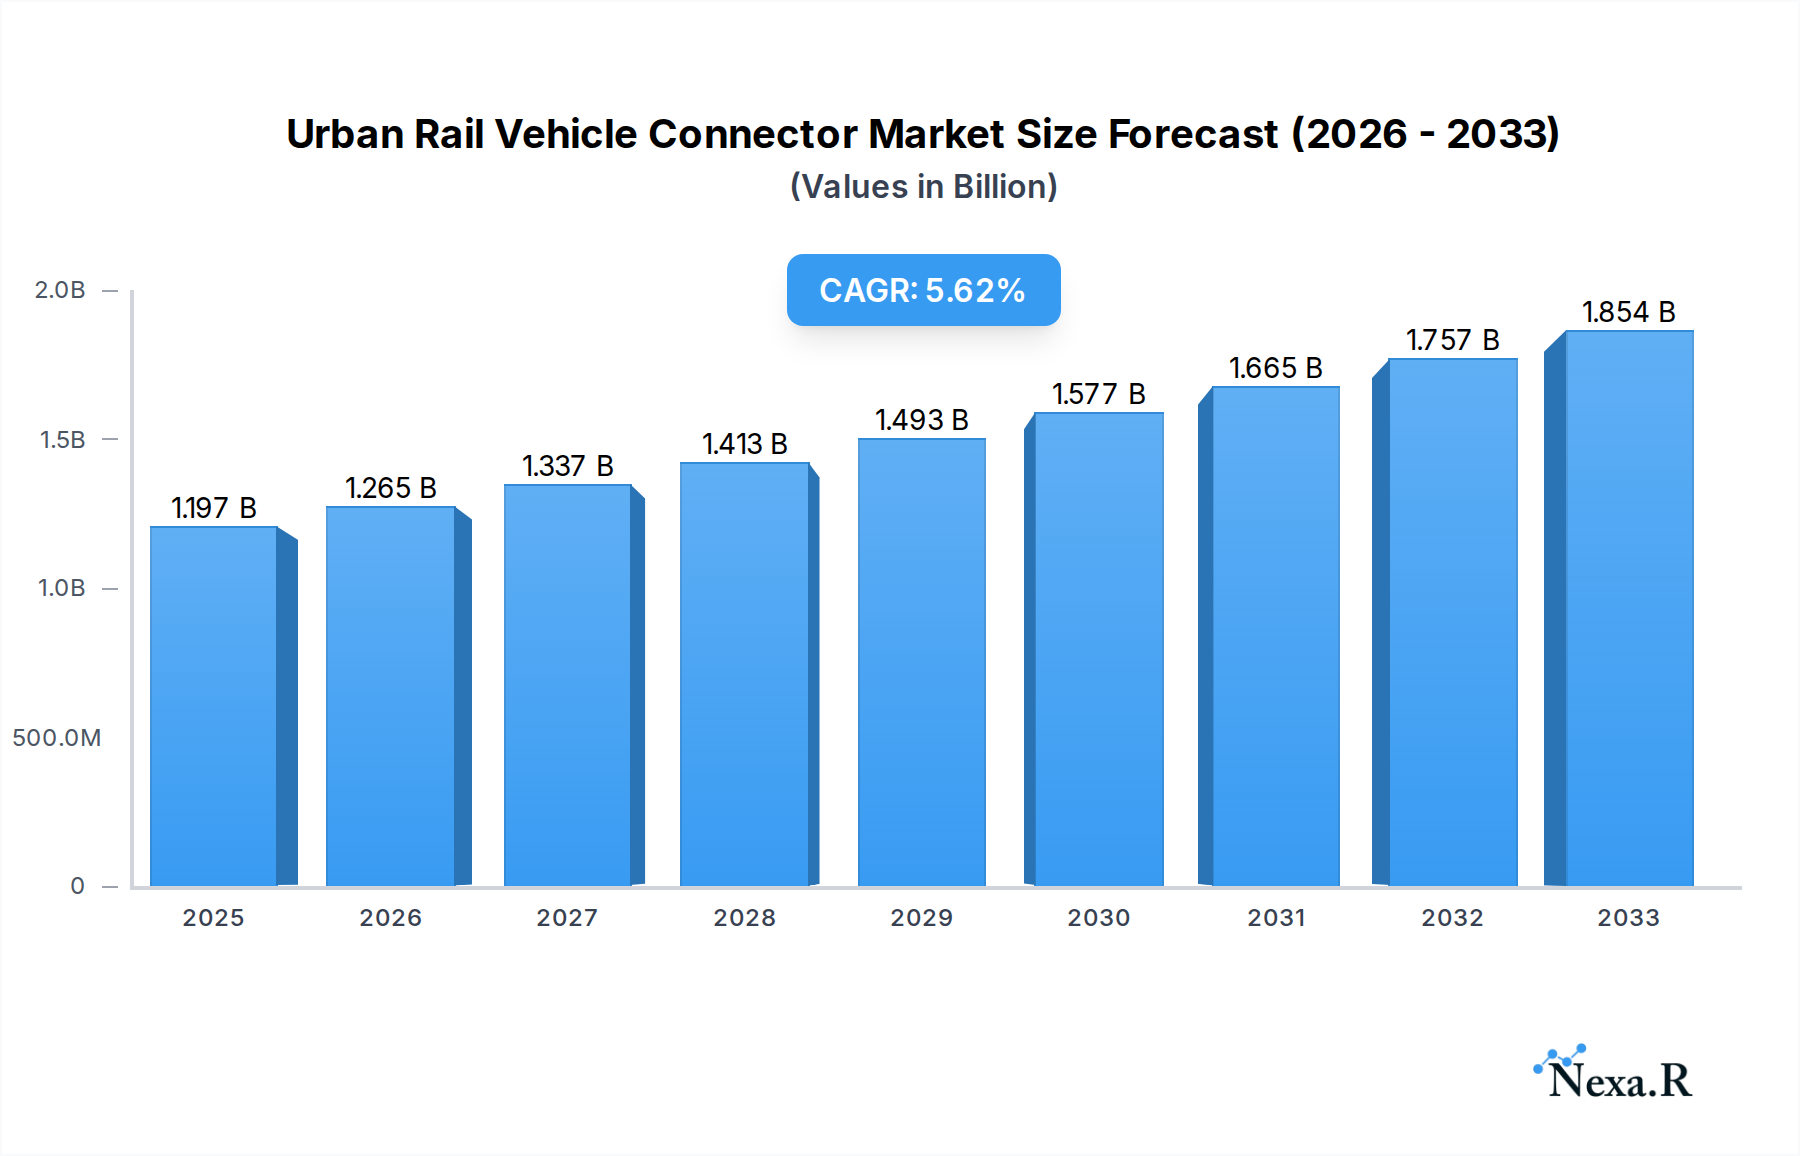
Urban Rail Vehicle Connector Market Size (In Billion)
The market is segmented by application into Optical Fiber Communication, Power Transmission, Signal Control, and Others, with Power Transmission and Optical Fiber Communication expected to dominate due to their critical importance in the functioning of increasingly sophisticated urban rail systems. By type, Power Connectors and Communication Connectors are anticipated to hold significant market share. Key industry players such as TE Connectivity, Molex, Amphenol, and Phoenix Contact are actively engaged in research and development, aiming to offer innovative solutions that meet the stringent demands of the rail industry, including high vibration resistance, extreme temperature tolerance, and electromagnetic compatibility. Geographically, Asia Pacific, led by China and India, is emerging as the largest and fastest-growing market, driven by extensive infrastructure development. North America and Europe also represent mature yet significant markets with ongoing modernization and expansion efforts. Despite the positive outlook, challenges such as the high cost of advanced connector technologies and complex supply chain logistics could pose restraints. However, the overarching trend towards electrification and smart rail technologies is expected to offset these challenges, ensuring continued market prosperity.

Urban Rail Vehicle Connector Company Market Share
Comprehensive Report: Urban Rail Vehicle Connector Market Analysis & Forecast (2019-2033)
This in-depth report provides a strategic overview of the global Urban Rail Vehicle Connector market, encompassing market dynamics, growth trends, regional analysis, product landscape, key drivers, challenges, emerging opportunities, and a detailed competitive analysis. With a study period spanning from 2019 to 2033, including a base year of 2025 and a forecast period from 2025 to 2033, this report offers actionable insights for stakeholders seeking to capitalize on the burgeoning urban transportation infrastructure development. The report delves into both parent and child markets, presenting a holistic view of the industry's trajectory and investment potential.
Urban Rail Vehicle Connector Market Dynamics & Structure
The Urban Rail Vehicle Connector market is characterized by a moderately concentrated structure, with a mix of established global players and emerging regional manufacturers. Technological innovation remains a primary driver, fueled by the increasing demand for high-speed data transmission, enhanced signal integrity, and robust power delivery solutions within modern rail systems. Regulatory frameworks, particularly those focused on safety, interoperability, and environmental standards, significantly influence product development and market entry. Competitive product substitutes, while limited in highly specialized applications, can emerge from advancements in alternative connectivity technologies. End-user demographics, primarily comprised of rail operators, system integrators, and rolling stock manufacturers, are increasingly prioritizing reliability, miniaturization, and lifecycle cost-effectiveness. Mergers and acquisitions (M&A) are a notable trend, with larger companies acquiring smaller, innovative firms to expand their product portfolios and market reach. For instance, the market has witnessed approximately 5-7 significant M&A deals annually in the past two years, with an average deal value in the tens of millions of USD. Innovation barriers include the high cost of R&D, stringent testing and certification processes, and the long product qualification cycles inherent in the rail industry.
- Market Concentration: Moderate, with top 5 players holding an estimated 40-50% of the global market share.
- Technological Innovation Drivers: Demand for 5G integration, advanced driver-assistance systems (ADAS), and electrification.
- Regulatory Frameworks: EN 50155, IEC standards for vibration and shock resistance, and fire safety regulations.
- Competitive Product Substitutes: Advancements in wireless connectivity (though not a direct replacement for critical rail applications).
- End-User Demographics: Focus on reliability, durability, and compliance with international rail standards.
- M&A Trends: Strategic acquisitions to gain access to specialized technologies and expand geographical presence.
Urban Rail Vehicle Connector Growth Trends & Insights
The global Urban Rail Vehicle Connector market is poised for substantial growth, driven by an increasing global investment in urban rail infrastructure expansion and modernization. The market size is projected to grow from an estimated $1,800 million in the base year 2025 to $3,000 million by the end of the forecast period in 2033, exhibiting a Compound Annual Growth Rate (CAGR) of approximately 6.5%. Adoption rates of advanced connector solutions are steadily increasing as rail operators seek to enhance operational efficiency, passenger safety, and onboard connectivity. Technological disruptions, such as the integration of IoT devices for predictive maintenance, the deployment of high-definition passenger information systems, and the ongoing shift towards autonomous train operation, are creating significant demand for specialized, high-performance connectors. Consumer behavior shifts, particularly the expectation for seamless onboard Wi-Fi and advanced infotainment services, are also indirectly influencing the demand for robust communication connectors. The parent market of general industrial connectors is expected to see a CAGR of around 5.8%, with the urban rail vehicle segment outperforming due to its specialized requirements and significant infrastructure investments. Within the child market, power connectors are anticipated to capture the largest share, followed closely by communication connectors, driven by the increasing electrification of rail networks and the proliferation of digital systems. The market penetration of smart connectors, equipped with diagnostic capabilities, is expected to see a significant uptick, moving from approximately 15% in 2025 to over 30% by 2033. The historical period (2019-2024) saw moderate growth, averaging around 4.2% CAGR, primarily driven by initial adoption of digital signaling and electrification projects. The increasing complexity of onboard systems and the trend towards networked rail infrastructure will further accelerate this growth trajectory, making the Urban Rail Vehicle Connector market a highly attractive sector for investment and innovation.
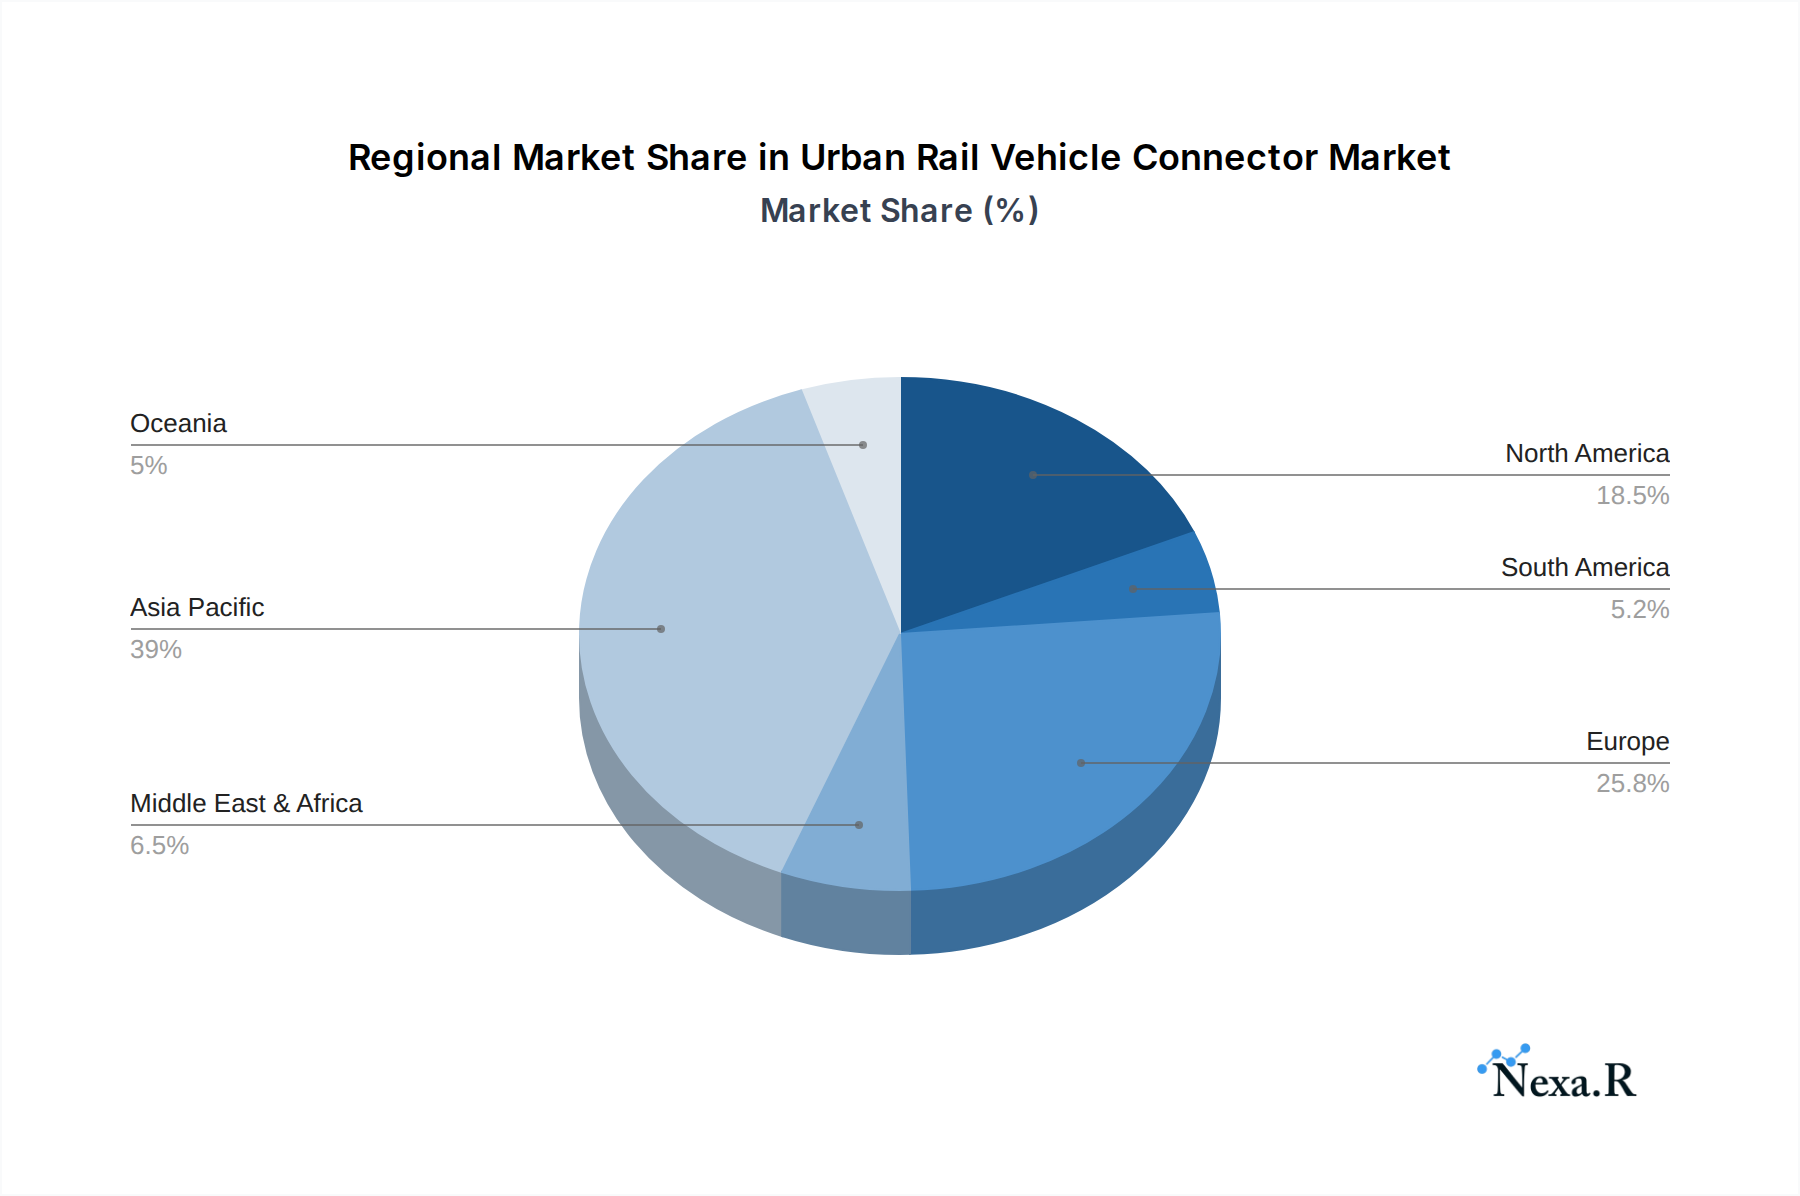
Dominant Regions, Countries, or Segments in Urban Rail Vehicle Connector
Asia Pacific currently stands as the dominant region in the Urban Rail Vehicle Connector market, driven by substantial investments in high-speed rail networks, metro system expansions, and smart city initiatives across countries like China, Japan, and South Korea. The parent market of Rail Infrastructure Connectors in this region is expected to grow at a CAGR of 7.2%, with the urban rail vehicle segment being a key contributor. Within the Applications segment, Power Transmission is a leading driver of market growth, accounting for an estimated 35% of the total market share in 2025. This dominance is attributed to the ongoing electrification of rail fleets, the development of more energy-efficient propulsion systems, and the increasing demand for reliable power distribution to various onboard systems. Countries like China are undertaking massive projects for metro line extensions and high-speed rail development, necessitating a vast supply of high-capacity power connectors.
Dominant Region: Asia Pacific
- Key Drivers: Rapid urbanization, extensive government spending on public transportation infrastructure, technological advancements, and a large manufacturing base.
- Market Share (Estimated 2025): Asia Pacific holding approximately 45-50% of the global market.
- Growth Potential: High, driven by ongoing and planned metro and high-speed rail projects.
Dominant Application Segment: Power Transmission
- Key Drivers: Electrification of rail networks, demand for higher energy efficiency, and the need for robust power solutions for traction systems and auxiliary equipment.
- Market Share (Estimated 2025): Approximately 35% of the total application segment.
- Growth Potential: Strong, fueled by the transition to cleaner energy sources in transportation.
Dominant Type Segment: Power Connector
- Key Drivers: Directly linked to the increasing demand for power transmission and the growing number of electric trains.
- Market Share (Estimated 2025): Estimated to hold around 40% of the connector types market.
- Growth Potential: Substantial, as rail networks continue to transition to electric power.
Economic policies in the region, such as government subsidies for public transport and favorable foreign investment policies, further bolster this dominance. Infrastructure development, including the construction of new metro lines and the upgrading of existing ones, requires a continuous supply of specialized connectors. The high growth potential is further amplified by the trend towards smart and autonomous trains, which will necessitate more sophisticated power management solutions. The child market of high-voltage connectors within power transmission is experiencing particularly rapid growth.
Urban Rail Vehicle Connector Product Landscape
The urban rail vehicle connector product landscape is characterized by innovation focused on enhanced durability, miniaturization, and high-performance capabilities. Key product innovations include advanced shielding for electromagnetic interference (EMI) protection, high-density configurations to save space, and robust environmental sealing against dust, water, and extreme temperatures. Applications range from high-speed data transmission for passenger Wi-Fi and real-time diagnostics to secure power delivery for traction motors and signaling systems. Performance metrics often emphasize vibration resistance exceeding 50g, shock resistance up to 100g, and operating temperature ranges from -40°C to +85°C. Unique selling propositions include modular designs for easy maintenance and upgrades, integrated status monitoring capabilities, and compliance with stringent rail industry standards such as EN 50155. Technological advancements are also seen in materials science, leading to lighter yet stronger connector housings, and in contact technologies for lower signal loss and higher current carrying capacity.
Key Drivers, Barriers & Challenges in Urban Rail Vehicle Connector
Key Drivers: The urban rail vehicle connector market is propelled by several key drivers. Increased global investment in public transportation infrastructure, particularly in developing economies, directly fuels demand. The ongoing trend towards rail network modernization, including the adoption of digital signaling, advanced passenger information systems, and onboard connectivity solutions, necessitates high-performance connectors. The push for electrification of rail fleets to meet environmental regulations and reduce operational costs is a significant growth accelerator. Technological advancements, such as the integration of AI and IoT for predictive maintenance and operational efficiency, also drive the need for sophisticated connector solutions.
Barriers & Challenges: Despite the strong growth trajectory, the market faces several barriers and challenges. Stringent certification processes and long qualification times for rail components can hinder rapid market entry and product adoption. The high cost of R&D and specialized manufacturing processes contributes to higher product prices. Supply chain disruptions, as witnessed in recent global events, can impact the availability and cost of raw materials. Intense competition from both established players and new entrants can put pressure on profit margins. Regulatory changes and evolving safety standards require continuous adaptation and investment in compliance. The parent market for industrial connectors faces similar challenges, but the rail sector's specific demands amplify these constraints.
Emerging Opportunities in Urban Rail Vehicle Connector
Emerging opportunities in the urban rail vehicle connector market lie in the growing demand for highly integrated smart connectors with embedded diagnostic capabilities, enabling real-time condition monitoring and predictive maintenance. The expansion of metro networks in emerging economies presents significant untapped market potential. The development of advanced signaling systems, including the European Train Control System (ETCS) and Communications-Based Train Control (CBTC), will drive demand for specialized communication and control connectors. Evolving consumer preferences for enhanced onboard connectivity, including high-speed Wi-Fi, infotainment systems, and charging ports, create opportunities for suppliers of robust communication and power connectors. The trend towards lightweight materials in rolling stock also opens avenues for connectors offering reduced weight without compromising performance.
Growth Accelerators in the Urban Rail Vehicle Industry
Several catalysts are accelerating the long-term growth of the urban rail vehicle connector industry. Technological breakthroughs in high-density connector designs and miniaturization are enabling more compact and efficient onboard systems. Strategic partnerships between connector manufacturers and rolling stock OEMs or system integrators facilitate faster product development and market penetration. Market expansion strategies, including focusing on emerging markets with significant infrastructure development plans, are crucial for sustained growth. The increasing focus on sustainability and energy efficiency in the transportation sector encourages the development of connectors that contribute to these goals. Furthermore, the growing adoption of modular connector systems allows for easier customization and upgrades, enhancing the lifecycle value of rail assets. The estimated value of the child market for high-bandwidth connectors is projected to grow by 8% annually.
Key Players Shaping the Urban Rail Vehicle Connector Market
- Harting
- Yutaka
- TE Connectivity
- Molex
- Alisun
- Amphenol
- Epic Contact
- ILME
- Lapp
- Phoenix Contact
- weidmuller
- LEMO Connectors
- Pulse Power and Measurement
- Zhejiang Yonggui Electric Equipment
- Sichuan Huafeng Technology
- Shenyang Xinghua Aviation Technology
Notable Milestones in Urban Rail Vehicle Connector Sector
- 2021: TE Connectivity launches a new series of compact, high-power connectors designed for electric traction systems, addressing the growing demand for electrification.
- 2022: Molex announces a strategic partnership with a leading rail signaling provider to develop next-generation communication connectors for advanced train control systems.
- 2022: Phoenix Contact introduces an innovative modular connector system for railway applications, enhancing flexibility and reducing installation time by approximately 20%.
- 2023: Amphenol acquires a specialized manufacturer of harsh-environment connectors, expanding its portfolio for demanding rail applications.
- 2023: Harting showcases its latest generation of high-performance data connectors for onboard network connectivity, supporting higher bandwidth requirements for passenger Wi-Fi and diagnostics.
- 2024: Lapp introduces enhanced cable and connector solutions with superior vibration and shock resistance, exceeding EN 50155 standards for critical rail infrastructure.
In-Depth Urban Rail Vehicle Connector Market Outlook
The future market potential for urban rail vehicle connectors is exceptionally strong, driven by sustained global investment in urban mobility solutions and technological advancements. Growth accelerators, including the increasing demand for electrification, digitalization, and passenger comfort, will continue to shape the market. Strategic opportunities lie in developing highly integrated, intelligent connector solutions that support smart rail operations and predictive maintenance. The expansion into emerging markets with nascent but rapidly growing rail networks offers significant untapped potential. Manufacturers focusing on high-performance, reliable, and environmentally conscious connector solutions are best positioned for success in this dynamic and essential sector of the global transportation industry. The market is anticipated to see continued innovation in areas like signal integrity, power density, and miniaturization, catering to the evolving needs of modern urban rail transportation.
Urban Rail Vehicle Connector Segmentation
-
1. Application
- 1.1. Optical Fiber Communication
- 1.2. Power Transmission
- 1.3. Signal Control
- 1.4. Others
-
2. Types
- 2.1. Power Connector
- 2.2. Communication Connector
- 2.3. Control Connector
- 2.4. Others
Urban Rail Vehicle Connector Segmentation By Geography
-
1. North America
- 1.1. United States
- 1.2. Canada
- 1.3. Mexico
-
2. South America
- 2.1. Brazil
- 2.2. Argentina
- 2.3. Rest of South America
-
3. Europe
- 3.1. United Kingdom
- 3.2. Germany
- 3.3. France
- 3.4. Italy
- 3.5. Spain
- 3.6. Russia
- 3.7. Benelux
- 3.8. Nordics
- 3.9. Rest of Europe
-
4. Middle East & Africa
- 4.1. Turkey
- 4.2. Israel
- 4.3. GCC
- 4.4. North Africa
- 4.5. South Africa
- 4.6. Rest of Middle East & Africa
-
5. Asia Pacific
- 5.1. China
- 5.2. India
- 5.3. Japan
- 5.4. South Korea
- 5.5. ASEAN
- 5.6. Oceania
- 5.7. Rest of Asia Pacific
Urban Rail Vehicle Connector Regional Market Share
Geographic Coverage of Urban Rail Vehicle Connector
Urban Rail Vehicle Connector REPORT HIGHLIGHTS
| Aspects | Details |
|---|---|
| Study Period | 2020-2034 |
| Base Year | 2025 |
| Estimated Year | 2026 |
| Forecast Period | 2026-2034 |
| Historical Period | 2020-2025 |
| Growth Rate | CAGR of 5.7% from 2020-2034 |
| Segmentation |
|
Table of Contents
- 1. Introduction
- 1.1. Research Scope
- 1.2. Market Segmentation
- 1.3. Research Methodology
- 1.4. Definitions and Assumptions
- 2. Executive Summary
- 2.1. Introduction
- 3. Market Dynamics
- 3.1. Introduction
- 3.2. Market Drivers
- 3.3. Market Restrains
- 3.4. Market Trends
- 4. Market Factor Analysis
- 4.1. Porters Five Forces
- 4.2. Supply/Value Chain
- 4.3. PESTEL analysis
- 4.4. Market Entropy
- 4.5. Patent/Trademark Analysis
- 5. Global Urban Rail Vehicle Connector Analysis, Insights and Forecast, 2020-2032
- 5.1. Market Analysis, Insights and Forecast - by Application
- 5.1.1. Optical Fiber Communication
- 5.1.2. Power Transmission
- 5.1.3. Signal Control
- 5.1.4. Others
- 5.2. Market Analysis, Insights and Forecast - by Types
- 5.2.1. Power Connector
- 5.2.2. Communication Connector
- 5.2.3. Control Connector
- 5.2.4. Others
- 5.3. Market Analysis, Insights and Forecast - by Region
- 5.3.1. North America
- 5.3.2. South America
- 5.3.3. Europe
- 5.3.4. Middle East & Africa
- 5.3.5. Asia Pacific
- 5.1. Market Analysis, Insights and Forecast - by Application
- 6. North America Urban Rail Vehicle Connector Analysis, Insights and Forecast, 2020-2032
- 6.1. Market Analysis, Insights and Forecast - by Application
- 6.1.1. Optical Fiber Communication
- 6.1.2. Power Transmission
- 6.1.3. Signal Control
- 6.1.4. Others
- 6.2. Market Analysis, Insights and Forecast - by Types
- 6.2.1. Power Connector
- 6.2.2. Communication Connector
- 6.2.3. Control Connector
- 6.2.4. Others
- 6.1. Market Analysis, Insights and Forecast - by Application
- 7. South America Urban Rail Vehicle Connector Analysis, Insights and Forecast, 2020-2032
- 7.1. Market Analysis, Insights and Forecast - by Application
- 7.1.1. Optical Fiber Communication
- 7.1.2. Power Transmission
- 7.1.3. Signal Control
- 7.1.4. Others
- 7.2. Market Analysis, Insights and Forecast - by Types
- 7.2.1. Power Connector
- 7.2.2. Communication Connector
- 7.2.3. Control Connector
- 7.2.4. Others
- 7.1. Market Analysis, Insights and Forecast - by Application
- 8. Europe Urban Rail Vehicle Connector Analysis, Insights and Forecast, 2020-2032
- 8.1. Market Analysis, Insights and Forecast - by Application
- 8.1.1. Optical Fiber Communication
- 8.1.2. Power Transmission
- 8.1.3. Signal Control
- 8.1.4. Others
- 8.2. Market Analysis, Insights and Forecast - by Types
- 8.2.1. Power Connector
- 8.2.2. Communication Connector
- 8.2.3. Control Connector
- 8.2.4. Others
- 8.1. Market Analysis, Insights and Forecast - by Application
- 9. Middle East & Africa Urban Rail Vehicle Connector Analysis, Insights and Forecast, 2020-2032
- 9.1. Market Analysis, Insights and Forecast - by Application
- 9.1.1. Optical Fiber Communication
- 9.1.2. Power Transmission
- 9.1.3. Signal Control
- 9.1.4. Others
- 9.2. Market Analysis, Insights and Forecast - by Types
- 9.2.1. Power Connector
- 9.2.2. Communication Connector
- 9.2.3. Control Connector
- 9.2.4. Others
- 9.1. Market Analysis, Insights and Forecast - by Application
- 10. Asia Pacific Urban Rail Vehicle Connector Analysis, Insights and Forecast, 2020-2032
- 10.1. Market Analysis, Insights and Forecast - by Application
- 10.1.1. Optical Fiber Communication
- 10.1.2. Power Transmission
- 10.1.3. Signal Control
- 10.1.4. Others
- 10.2. Market Analysis, Insights and Forecast - by Types
- 10.2.1. Power Connector
- 10.2.2. Communication Connector
- 10.2.3. Control Connector
- 10.2.4. Others
- 10.1. Market Analysis, Insights and Forecast - by Application
- 11. Competitive Analysis
- 11.1. Global Market Share Analysis 2025
- 11.2. Company Profiles
- 11.2.1 Harting
- 11.2.1.1. Overview
- 11.2.1.2. Products
- 11.2.1.3. SWOT Analysis
- 11.2.1.4. Recent Developments
- 11.2.1.5. Financials (Based on Availability)
- 11.2.2 Yutaka
- 11.2.2.1. Overview
- 11.2.2.2. Products
- 11.2.2.3. SWOT Analysis
- 11.2.2.4. Recent Developments
- 11.2.2.5. Financials (Based on Availability)
- 11.2.3 TE Connectivity
- 11.2.3.1. Overview
- 11.2.3.2. Products
- 11.2.3.3. SWOT Analysis
- 11.2.3.4. Recent Developments
- 11.2.3.5. Financials (Based on Availability)
- 11.2.4 Molex
- 11.2.4.1. Overview
- 11.2.4.2. Products
- 11.2.4.3. SWOT Analysis
- 11.2.4.4. Recent Developments
- 11.2.4.5. Financials (Based on Availability)
- 11.2.5 Alisun
- 11.2.5.1. Overview
- 11.2.5.2. Products
- 11.2.5.3. SWOT Analysis
- 11.2.5.4. Recent Developments
- 11.2.5.5. Financials (Based on Availability)
- 11.2.6 Amphenol
- 11.2.6.1. Overview
- 11.2.6.2. Products
- 11.2.6.3. SWOT Analysis
- 11.2.6.4. Recent Developments
- 11.2.6.5. Financials (Based on Availability)
- 11.2.7 Epic Contact
- 11.2.7.1. Overview
- 11.2.7.2. Products
- 11.2.7.3. SWOT Analysis
- 11.2.7.4. Recent Developments
- 11.2.7.5. Financials (Based on Availability)
- 11.2.8 ILME
- 11.2.8.1. Overview
- 11.2.8.2. Products
- 11.2.8.3. SWOT Analysis
- 11.2.8.4. Recent Developments
- 11.2.8.5. Financials (Based on Availability)
- 11.2.9 Lapp
- 11.2.9.1. Overview
- 11.2.9.2. Products
- 11.2.9.3. SWOT Analysis
- 11.2.9.4. Recent Developments
- 11.2.9.5. Financials (Based on Availability)
- 11.2.10 Phoenix Contact
- 11.2.10.1. Overview
- 11.2.10.2. Products
- 11.2.10.3. SWOT Analysis
- 11.2.10.4. Recent Developments
- 11.2.10.5. Financials (Based on Availability)
- 11.2.11 weidmuller
- 11.2.11.1. Overview
- 11.2.11.2. Products
- 11.2.11.3. SWOT Analysis
- 11.2.11.4. Recent Developments
- 11.2.11.5. Financials (Based on Availability)
- 11.2.12 LEMO Connectors
- 11.2.12.1. Overview
- 11.2.12.2. Products
- 11.2.12.3. SWOT Analysis
- 11.2.12.4. Recent Developments
- 11.2.12.5. Financials (Based on Availability)
- 11.2.13 Pulse Power and Measurement
- 11.2.13.1. Overview
- 11.2.13.2. Products
- 11.2.13.3. SWOT Analysis
- 11.2.13.4. Recent Developments
- 11.2.13.5. Financials (Based on Availability)
- 11.2.14 Zhejiang Yonggui Electric Equipment
- 11.2.14.1. Overview
- 11.2.14.2. Products
- 11.2.14.3. SWOT Analysis
- 11.2.14.4. Recent Developments
- 11.2.14.5. Financials (Based on Availability)
- 11.2.15 Sichuan Huafeng Technology
- 11.2.15.1. Overview
- 11.2.15.2. Products
- 11.2.15.3. SWOT Analysis
- 11.2.15.4. Recent Developments
- 11.2.15.5. Financials (Based on Availability)
- 11.2.16 Shenyang Xinghua Aviation Technology
- 11.2.16.1. Overview
- 11.2.16.2. Products
- 11.2.16.3. SWOT Analysis
- 11.2.16.4. Recent Developments
- 11.2.16.5. Financials (Based on Availability)
- 11.2.1 Harting
List of Figures
- Figure 1: Global Urban Rail Vehicle Connector Revenue Breakdown (million, %) by Region 2025 & 2033
- Figure 2: Global Urban Rail Vehicle Connector Volume Breakdown (K, %) by Region 2025 & 2033
- Figure 3: North America Urban Rail Vehicle Connector Revenue (million), by Application 2025 & 2033
- Figure 4: North America Urban Rail Vehicle Connector Volume (K), by Application 2025 & 2033
- Figure 5: North America Urban Rail Vehicle Connector Revenue Share (%), by Application 2025 & 2033
- Figure 6: North America Urban Rail Vehicle Connector Volume Share (%), by Application 2025 & 2033
- Figure 7: North America Urban Rail Vehicle Connector Revenue (million), by Types 2025 & 2033
- Figure 8: North America Urban Rail Vehicle Connector Volume (K), by Types 2025 & 2033
- Figure 9: North America Urban Rail Vehicle Connector Revenue Share (%), by Types 2025 & 2033
- Figure 10: North America Urban Rail Vehicle Connector Volume Share (%), by Types 2025 & 2033
- Figure 11: North America Urban Rail Vehicle Connector Revenue (million), by Country 2025 & 2033
- Figure 12: North America Urban Rail Vehicle Connector Volume (K), by Country 2025 & 2033
- Figure 13: North America Urban Rail Vehicle Connector Revenue Share (%), by Country 2025 & 2033
- Figure 14: North America Urban Rail Vehicle Connector Volume Share (%), by Country 2025 & 2033
- Figure 15: South America Urban Rail Vehicle Connector Revenue (million), by Application 2025 & 2033
- Figure 16: South America Urban Rail Vehicle Connector Volume (K), by Application 2025 & 2033
- Figure 17: South America Urban Rail Vehicle Connector Revenue Share (%), by Application 2025 & 2033
- Figure 18: South America Urban Rail Vehicle Connector Volume Share (%), by Application 2025 & 2033
- Figure 19: South America Urban Rail Vehicle Connector Revenue (million), by Types 2025 & 2033
- Figure 20: South America Urban Rail Vehicle Connector Volume (K), by Types 2025 & 2033
- Figure 21: South America Urban Rail Vehicle Connector Revenue Share (%), by Types 2025 & 2033
- Figure 22: South America Urban Rail Vehicle Connector Volume Share (%), by Types 2025 & 2033
- Figure 23: South America Urban Rail Vehicle Connector Revenue (million), by Country 2025 & 2033
- Figure 24: South America Urban Rail Vehicle Connector Volume (K), by Country 2025 & 2033
- Figure 25: South America Urban Rail Vehicle Connector Revenue Share (%), by Country 2025 & 2033
- Figure 26: South America Urban Rail Vehicle Connector Volume Share (%), by Country 2025 & 2033
- Figure 27: Europe Urban Rail Vehicle Connector Revenue (million), by Application 2025 & 2033
- Figure 28: Europe Urban Rail Vehicle Connector Volume (K), by Application 2025 & 2033
- Figure 29: Europe Urban Rail Vehicle Connector Revenue Share (%), by Application 2025 & 2033
- Figure 30: Europe Urban Rail Vehicle Connector Volume Share (%), by Application 2025 & 2033
- Figure 31: Europe Urban Rail Vehicle Connector Revenue (million), by Types 2025 & 2033
- Figure 32: Europe Urban Rail Vehicle Connector Volume (K), by Types 2025 & 2033
- Figure 33: Europe Urban Rail Vehicle Connector Revenue Share (%), by Types 2025 & 2033
- Figure 34: Europe Urban Rail Vehicle Connector Volume Share (%), by Types 2025 & 2033
- Figure 35: Europe Urban Rail Vehicle Connector Revenue (million), by Country 2025 & 2033
- Figure 36: Europe Urban Rail Vehicle Connector Volume (K), by Country 2025 & 2033
- Figure 37: Europe Urban Rail Vehicle Connector Revenue Share (%), by Country 2025 & 2033
- Figure 38: Europe Urban Rail Vehicle Connector Volume Share (%), by Country 2025 & 2033
- Figure 39: Middle East & Africa Urban Rail Vehicle Connector Revenue (million), by Application 2025 & 2033
- Figure 40: Middle East & Africa Urban Rail Vehicle Connector Volume (K), by Application 2025 & 2033
- Figure 41: Middle East & Africa Urban Rail Vehicle Connector Revenue Share (%), by Application 2025 & 2033
- Figure 42: Middle East & Africa Urban Rail Vehicle Connector Volume Share (%), by Application 2025 & 2033
- Figure 43: Middle East & Africa Urban Rail Vehicle Connector Revenue (million), by Types 2025 & 2033
- Figure 44: Middle East & Africa Urban Rail Vehicle Connector Volume (K), by Types 2025 & 2033
- Figure 45: Middle East & Africa Urban Rail Vehicle Connector Revenue Share (%), by Types 2025 & 2033
- Figure 46: Middle East & Africa Urban Rail Vehicle Connector Volume Share (%), by Types 2025 & 2033
- Figure 47: Middle East & Africa Urban Rail Vehicle Connector Revenue (million), by Country 2025 & 2033
- Figure 48: Middle East & Africa Urban Rail Vehicle Connector Volume (K), by Country 2025 & 2033
- Figure 49: Middle East & Africa Urban Rail Vehicle Connector Revenue Share (%), by Country 2025 & 2033
- Figure 50: Middle East & Africa Urban Rail Vehicle Connector Volume Share (%), by Country 2025 & 2033
- Figure 51: Asia Pacific Urban Rail Vehicle Connector Revenue (million), by Application 2025 & 2033
- Figure 52: Asia Pacific Urban Rail Vehicle Connector Volume (K), by Application 2025 & 2033
- Figure 53: Asia Pacific Urban Rail Vehicle Connector Revenue Share (%), by Application 2025 & 2033
- Figure 54: Asia Pacific Urban Rail Vehicle Connector Volume Share (%), by Application 2025 & 2033
- Figure 55: Asia Pacific Urban Rail Vehicle Connector Revenue (million), by Types 2025 & 2033
- Figure 56: Asia Pacific Urban Rail Vehicle Connector Volume (K), by Types 2025 & 2033
- Figure 57: Asia Pacific Urban Rail Vehicle Connector Revenue Share (%), by Types 2025 & 2033
- Figure 58: Asia Pacific Urban Rail Vehicle Connector Volume Share (%), by Types 2025 & 2033
- Figure 59: Asia Pacific Urban Rail Vehicle Connector Revenue (million), by Country 2025 & 2033
- Figure 60: Asia Pacific Urban Rail Vehicle Connector Volume (K), by Country 2025 & 2033
- Figure 61: Asia Pacific Urban Rail Vehicle Connector Revenue Share (%), by Country 2025 & 2033
- Figure 62: Asia Pacific Urban Rail Vehicle Connector Volume Share (%), by Country 2025 & 2033
List of Tables
- Table 1: Global Urban Rail Vehicle Connector Revenue million Forecast, by Application 2020 & 2033
- Table 2: Global Urban Rail Vehicle Connector Volume K Forecast, by Application 2020 & 2033
- Table 3: Global Urban Rail Vehicle Connector Revenue million Forecast, by Types 2020 & 2033
- Table 4: Global Urban Rail Vehicle Connector Volume K Forecast, by Types 2020 & 2033
- Table 5: Global Urban Rail Vehicle Connector Revenue million Forecast, by Region 2020 & 2033
- Table 6: Global Urban Rail Vehicle Connector Volume K Forecast, by Region 2020 & 2033
- Table 7: Global Urban Rail Vehicle Connector Revenue million Forecast, by Application 2020 & 2033
- Table 8: Global Urban Rail Vehicle Connector Volume K Forecast, by Application 2020 & 2033
- Table 9: Global Urban Rail Vehicle Connector Revenue million Forecast, by Types 2020 & 2033
- Table 10: Global Urban Rail Vehicle Connector Volume K Forecast, by Types 2020 & 2033
- Table 11: Global Urban Rail Vehicle Connector Revenue million Forecast, by Country 2020 & 2033
- Table 12: Global Urban Rail Vehicle Connector Volume K Forecast, by Country 2020 & 2033
- Table 13: United States Urban Rail Vehicle Connector Revenue (million) Forecast, by Application 2020 & 2033
- Table 14: United States Urban Rail Vehicle Connector Volume (K) Forecast, by Application 2020 & 2033
- Table 15: Canada Urban Rail Vehicle Connector Revenue (million) Forecast, by Application 2020 & 2033
- Table 16: Canada Urban Rail Vehicle Connector Volume (K) Forecast, by Application 2020 & 2033
- Table 17: Mexico Urban Rail Vehicle Connector Revenue (million) Forecast, by Application 2020 & 2033
- Table 18: Mexico Urban Rail Vehicle Connector Volume (K) Forecast, by Application 2020 & 2033
- Table 19: Global Urban Rail Vehicle Connector Revenue million Forecast, by Application 2020 & 2033
- Table 20: Global Urban Rail Vehicle Connector Volume K Forecast, by Application 2020 & 2033
- Table 21: Global Urban Rail Vehicle Connector Revenue million Forecast, by Types 2020 & 2033
- Table 22: Global Urban Rail Vehicle Connector Volume K Forecast, by Types 2020 & 2033
- Table 23: Global Urban Rail Vehicle Connector Revenue million Forecast, by Country 2020 & 2033
- Table 24: Global Urban Rail Vehicle Connector Volume K Forecast, by Country 2020 & 2033
- Table 25: Brazil Urban Rail Vehicle Connector Revenue (million) Forecast, by Application 2020 & 2033
- Table 26: Brazil Urban Rail Vehicle Connector Volume (K) Forecast, by Application 2020 & 2033
- Table 27: Argentina Urban Rail Vehicle Connector Revenue (million) Forecast, by Application 2020 & 2033
- Table 28: Argentina Urban Rail Vehicle Connector Volume (K) Forecast, by Application 2020 & 2033
- Table 29: Rest of South America Urban Rail Vehicle Connector Revenue (million) Forecast, by Application 2020 & 2033
- Table 30: Rest of South America Urban Rail Vehicle Connector Volume (K) Forecast, by Application 2020 & 2033
- Table 31: Global Urban Rail Vehicle Connector Revenue million Forecast, by Application 2020 & 2033
- Table 32: Global Urban Rail Vehicle Connector Volume K Forecast, by Application 2020 & 2033
- Table 33: Global Urban Rail Vehicle Connector Revenue million Forecast, by Types 2020 & 2033
- Table 34: Global Urban Rail Vehicle Connector Volume K Forecast, by Types 2020 & 2033
- Table 35: Global Urban Rail Vehicle Connector Revenue million Forecast, by Country 2020 & 2033
- Table 36: Global Urban Rail Vehicle Connector Volume K Forecast, by Country 2020 & 2033
- Table 37: United Kingdom Urban Rail Vehicle Connector Revenue (million) Forecast, by Application 2020 & 2033
- Table 38: United Kingdom Urban Rail Vehicle Connector Volume (K) Forecast, by Application 2020 & 2033
- Table 39: Germany Urban Rail Vehicle Connector Revenue (million) Forecast, by Application 2020 & 2033
- Table 40: Germany Urban Rail Vehicle Connector Volume (K) Forecast, by Application 2020 & 2033
- Table 41: France Urban Rail Vehicle Connector Revenue (million) Forecast, by Application 2020 & 2033
- Table 42: France Urban Rail Vehicle Connector Volume (K) Forecast, by Application 2020 & 2033
- Table 43: Italy Urban Rail Vehicle Connector Revenue (million) Forecast, by Application 2020 & 2033
- Table 44: Italy Urban Rail Vehicle Connector Volume (K) Forecast, by Application 2020 & 2033
- Table 45: Spain Urban Rail Vehicle Connector Revenue (million) Forecast, by Application 2020 & 2033
- Table 46: Spain Urban Rail Vehicle Connector Volume (K) Forecast, by Application 2020 & 2033
- Table 47: Russia Urban Rail Vehicle Connector Revenue (million) Forecast, by Application 2020 & 2033
- Table 48: Russia Urban Rail Vehicle Connector Volume (K) Forecast, by Application 2020 & 2033
- Table 49: Benelux Urban Rail Vehicle Connector Revenue (million) Forecast, by Application 2020 & 2033
- Table 50: Benelux Urban Rail Vehicle Connector Volume (K) Forecast, by Application 2020 & 2033
- Table 51: Nordics Urban Rail Vehicle Connector Revenue (million) Forecast, by Application 2020 & 2033
- Table 52: Nordics Urban Rail Vehicle Connector Volume (K) Forecast, by Application 2020 & 2033
- Table 53: Rest of Europe Urban Rail Vehicle Connector Revenue (million) Forecast, by Application 2020 & 2033
- Table 54: Rest of Europe Urban Rail Vehicle Connector Volume (K) Forecast, by Application 2020 & 2033
- Table 55: Global Urban Rail Vehicle Connector Revenue million Forecast, by Application 2020 & 2033
- Table 56: Global Urban Rail Vehicle Connector Volume K Forecast, by Application 2020 & 2033
- Table 57: Global Urban Rail Vehicle Connector Revenue million Forecast, by Types 2020 & 2033
- Table 58: Global Urban Rail Vehicle Connector Volume K Forecast, by Types 2020 & 2033
- Table 59: Global Urban Rail Vehicle Connector Revenue million Forecast, by Country 2020 & 2033
- Table 60: Global Urban Rail Vehicle Connector Volume K Forecast, by Country 2020 & 2033
- Table 61: Turkey Urban Rail Vehicle Connector Revenue (million) Forecast, by Application 2020 & 2033
- Table 62: Turkey Urban Rail Vehicle Connector Volume (K) Forecast, by Application 2020 & 2033
- Table 63: Israel Urban Rail Vehicle Connector Revenue (million) Forecast, by Application 2020 & 2033
- Table 64: Israel Urban Rail Vehicle Connector Volume (K) Forecast, by Application 2020 & 2033
- Table 65: GCC Urban Rail Vehicle Connector Revenue (million) Forecast, by Application 2020 & 2033
- Table 66: GCC Urban Rail Vehicle Connector Volume (K) Forecast, by Application 2020 & 2033
- Table 67: North Africa Urban Rail Vehicle Connector Revenue (million) Forecast, by Application 2020 & 2033
- Table 68: North Africa Urban Rail Vehicle Connector Volume (K) Forecast, by Application 2020 & 2033
- Table 69: South Africa Urban Rail Vehicle Connector Revenue (million) Forecast, by Application 2020 & 2033
- Table 70: South Africa Urban Rail Vehicle Connector Volume (K) Forecast, by Application 2020 & 2033
- Table 71: Rest of Middle East & Africa Urban Rail Vehicle Connector Revenue (million) Forecast, by Application 2020 & 2033
- Table 72: Rest of Middle East & Africa Urban Rail Vehicle Connector Volume (K) Forecast, by Application 2020 & 2033
- Table 73: Global Urban Rail Vehicle Connector Revenue million Forecast, by Application 2020 & 2033
- Table 74: Global Urban Rail Vehicle Connector Volume K Forecast, by Application 2020 & 2033
- Table 75: Global Urban Rail Vehicle Connector Revenue million Forecast, by Types 2020 & 2033
- Table 76: Global Urban Rail Vehicle Connector Volume K Forecast, by Types 2020 & 2033
- Table 77: Global Urban Rail Vehicle Connector Revenue million Forecast, by Country 2020 & 2033
- Table 78: Global Urban Rail Vehicle Connector Volume K Forecast, by Country 2020 & 2033
- Table 79: China Urban Rail Vehicle Connector Revenue (million) Forecast, by Application 2020 & 2033
- Table 80: China Urban Rail Vehicle Connector Volume (K) Forecast, by Application 2020 & 2033
- Table 81: India Urban Rail Vehicle Connector Revenue (million) Forecast, by Application 2020 & 2033
- Table 82: India Urban Rail Vehicle Connector Volume (K) Forecast, by Application 2020 & 2033
- Table 83: Japan Urban Rail Vehicle Connector Revenue (million) Forecast, by Application 2020 & 2033
- Table 84: Japan Urban Rail Vehicle Connector Volume (K) Forecast, by Application 2020 & 2033
- Table 85: South Korea Urban Rail Vehicle Connector Revenue (million) Forecast, by Application 2020 & 2033
- Table 86: South Korea Urban Rail Vehicle Connector Volume (K) Forecast, by Application 2020 & 2033
- Table 87: ASEAN Urban Rail Vehicle Connector Revenue (million) Forecast, by Application 2020 & 2033
- Table 88: ASEAN Urban Rail Vehicle Connector Volume (K) Forecast, by Application 2020 & 2033
- Table 89: Oceania Urban Rail Vehicle Connector Revenue (million) Forecast, by Application 2020 & 2033
- Table 90: Oceania Urban Rail Vehicle Connector Volume (K) Forecast, by Application 2020 & 2033
- Table 91: Rest of Asia Pacific Urban Rail Vehicle Connector Revenue (million) Forecast, by Application 2020 & 2033
- Table 92: Rest of Asia Pacific Urban Rail Vehicle Connector Volume (K) Forecast, by Application 2020 & 2033
Frequently Asked Questions
1. What is the projected Compound Annual Growth Rate (CAGR) of the Urban Rail Vehicle Connector?
The projected CAGR is approximately 5.7%.
2. Which companies are prominent players in the Urban Rail Vehicle Connector?
Key companies in the market include Harting, Yutaka, TE Connectivity, Molex, Alisun, Amphenol, Epic Contact, ILME, Lapp, Phoenix Contact, weidmuller, LEMO Connectors, Pulse Power and Measurement, Zhejiang Yonggui Electric Equipment, Sichuan Huafeng Technology, Shenyang Xinghua Aviation Technology.
3. What are the main segments of the Urban Rail Vehicle Connector?
The market segments include Application, Types.
4. Can you provide details about the market size?
The market size is estimated to be USD 1197 million as of 2022.
5. What are some drivers contributing to market growth?
N/A
6. What are the notable trends driving market growth?
N/A
7. Are there any restraints impacting market growth?
N/A
8. Can you provide examples of recent developments in the market?
N/A
9. What pricing options are available for accessing the report?
Pricing options include single-user, multi-user, and enterprise licenses priced at USD 3950.00, USD 5925.00, and USD 7900.00 respectively.
10. Is the market size provided in terms of value or volume?
The market size is provided in terms of value, measured in million and volume, measured in K.
11. Are there any specific market keywords associated with the report?
Yes, the market keyword associated with the report is "Urban Rail Vehicle Connector," which aids in identifying and referencing the specific market segment covered.
12. How do I determine which pricing option suits my needs best?
The pricing options vary based on user requirements and access needs. Individual users may opt for single-user licenses, while businesses requiring broader access may choose multi-user or enterprise licenses for cost-effective access to the report.
13. Are there any additional resources or data provided in the Urban Rail Vehicle Connector report?
While the report offers comprehensive insights, it's advisable to review the specific contents or supplementary materials provided to ascertain if additional resources or data are available.
14. How can I stay updated on further developments or reports in the Urban Rail Vehicle Connector?
To stay informed about further developments, trends, and reports in the Urban Rail Vehicle Connector, consider subscribing to industry newsletters, following relevant companies and organizations, or regularly checking reputable industry news sources and publications.
Methodology
Step 1 - Identification of Relevant Samples Size from Population Database


Step 2 - Approaches for Defining Global Market Size (Value, Volume* & Price*)

Note*: In applicable scenarios
Step 3 - Data Sources
Primary Research
- Web Analytics
- Survey Reports
- Research Institute
- Latest Research Reports
- Opinion Leaders
Secondary Research
- Annual Reports
- White Paper
- Latest Press Release
- Industry Association
- Paid Database
- Investor Presentations

Step 4 - Data Triangulation
Involves using different sources of information in order to increase the validity of a study
These sources are likely to be stakeholders in a program - participants, other researchers, program staff, other community members, and so on.
Then we put all data in single framework & apply various statistical tools to find out the dynamic on the market.
During the analysis stage, feedback from the stakeholder groups would be compared to determine areas of agreement as well as areas of divergence