

Key Insights
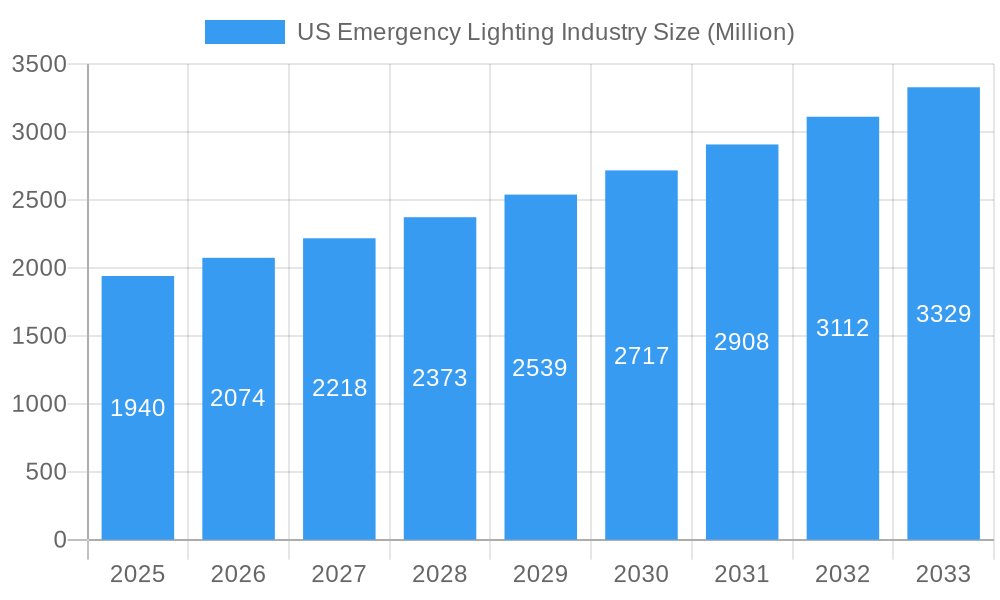
The US emergency lighting market, valued at approximately $1.94 billion in 2025, is poised for robust growth, exhibiting a Compound Annual Growth Rate (CAGR) of 6.84% from 2025 to 2033. This expansion is driven by several key factors. Stringent building codes and safety regulations across commercial, industrial, healthcare, and educational sectors mandate the installation of reliable emergency lighting systems, fueling market demand. Furthermore, increasing awareness of workplace safety and the need for effective evacuation strategies in case of power outages are significant contributors to market growth. Technological advancements, such as the incorporation of LED technology offering enhanced energy efficiency and longer lifespan, are also driving adoption. The market is segmented by type (self-sustained and centrally supplied) and end-user (commercial, industrial, educational, healthcare, and others). The self-sustained segment is likely to dominate due to its ease of installation and independent operation. Among end-users, the commercial sector currently holds a significant share, followed by industrial and healthcare sectors, with anticipated growth in all sectors owing to rising infrastructure development and modernization efforts. However, the market may face some constraints, including high initial investment costs for advanced systems and potential competition from alternative power solutions. Nevertheless, the overall outlook for the US emergency lighting market remains positive, with consistent growth projected throughout the forecast period.
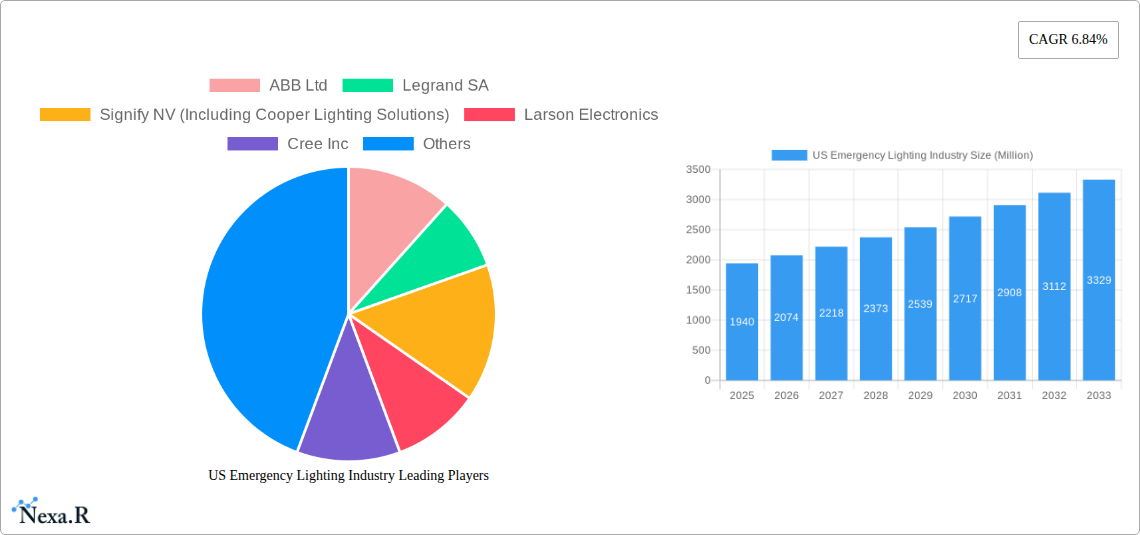
US Emergency Lighting Industry Market Size (In Billion)
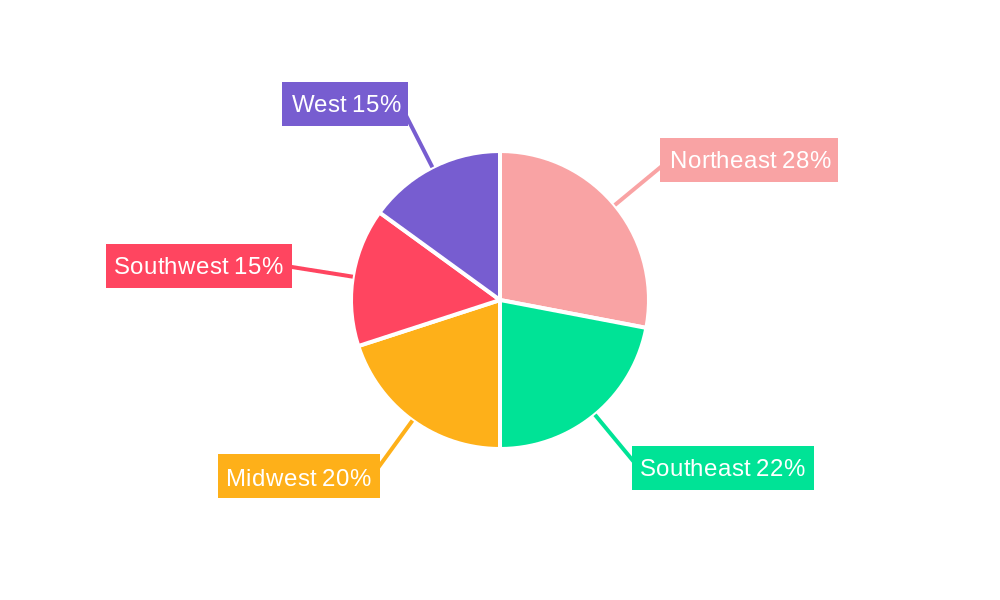
Growth will be influenced by regional variations. The Northeast and West regions are anticipated to experience faster growth rates compared to other regions due to higher adoption rates in commercial and industrial sectors and stringent building codes. The Midwest and Southeast regions, while exhibiting slower growth, still present significant opportunities due to increasing infrastructure development and government initiatives promoting safety standards. Major players such as ABB Ltd, Legrand SA, and Signify NV are actively shaping the market landscape through innovation and strategic partnerships, focusing on providing sophisticated, energy-efficient, and technologically advanced emergency lighting solutions. The competitive landscape is characterized by both established players and emerging technology companies, leading to increased product differentiation and market diversification. Continued technological advancements and a focus on providing integrated safety solutions will further drive the market's growth in the coming years.
US Emergency Lighting Industry Company Market Share
This comprehensive report provides an in-depth analysis of the US emergency lighting industry, encompassing market dynamics, growth trends, key players, and future outlook. With a focus on both parent and child markets, this report is an essential resource for industry professionals, investors, and strategic decision-makers. The study period covers 2019-2033, with 2025 as the base and estimated year.
US Emergency Lighting Industry Market Dynamics & Structure
The US emergency lighting market, valued at xx million units in 2024, is characterized by moderate market concentration with several key players holding significant market share. Technological innovation, driven by advancements in LED technology and smart lighting systems, is a primary growth driver. Stringent safety regulations and building codes mandate the use of emergency lighting across various sectors, shaping market demand. Competitive substitutes include traditional incandescent and fluorescent lighting, although their market share is declining due to higher energy efficiency and longer lifespan of LED-based emergency lighting. The end-user demographics are diverse, encompassing commercial, industrial, healthcare, educational, and other sectors, each with unique lighting requirements. The industry has witnessed several mergers and acquisitions (M&A) activities, indicating consolidation and strategic expansion.
- Market Concentration: Moderately concentrated, with top 5 players holding approximately xx% market share in 2024.
- Technological Innovation: Strong emphasis on LED technology, smart lighting, and battery advancements.
- Regulatory Framework: Stringent safety and building codes drive market demand.
- Competitive Substitutes: Traditional lighting technologies, gradually losing market share.
- End-User Demographics: Diverse, including commercial (xx million units), industrial (xx million units), healthcare (xx million units), educational (xx million units), and other end-users (xx million units).
- M&A Trends: Moderate activity, indicating consolidation and strategic expansion within the sector. For example, xx number of M&A deals were recorded between 2019 and 2024.
US Emergency Lighting Industry Growth Trends & Insights
The US emergency lighting market exhibited a CAGR of xx% during the historical period (2019-2024), driven by increasing adoption of energy-efficient LED lighting, stringent building codes, and rising safety concerns across various sectors. The market is expected to continue its growth trajectory during the forecast period (2025-2033), with a projected CAGR of xx%. Technological disruptions, including the integration of IoT and smart features in emergency lighting systems, are enhancing market appeal. Consumer behavior shifts towards sustainability and energy efficiency further bolster market growth. Market penetration of LED-based emergency lighting systems is expected to reach xx% by 2033, significantly higher than the xx% recorded in 2024. Growth is also influenced by increasing government initiatives promoting energy efficiency and building safety.
Dominant Regions, Countries, or Segments in US Emergency Lighting Industry
The commercial sector dominates the US emergency lighting market, accounting for approximately xx% of total market volume in 2024. This is driven by the large number of commercial buildings and stringent safety regulations requiring emergency lighting. The 'Centrally Supplied' type segment also holds a significant market share, representing approximately xx% of the total market, due to cost-effectiveness in large-scale installations. California and New York are the leading states in terms of market size, benefiting from robust construction activity and a higher concentration of commercial and industrial establishments.
- Key Drivers: Stringent building codes, growing commercial construction, increasing emphasis on energy efficiency, and robust government initiatives.
- Dominance Factors: High concentration of commercial buildings, cost-effectiveness of centrally supplied systems, and stringent regulations in key states.
US Emergency Lighting Industry Product Landscape
The US emergency lighting market offers a diverse range of products, including self-sustained and centrally supplied units, featuring various designs, functionalities, and energy sources. LED-based emergency lights are rapidly gaining popularity due to their energy efficiency, longer lifespan, and superior performance compared to traditional technologies. Innovative features such as wireless connectivity, remote monitoring capabilities, and smart control systems are enhancing product appeal and creating new opportunities for market growth. Manufacturers are focusing on enhanced safety features, improved battery life, and aesthetically pleasing designs to cater to diverse customer preferences.
Key Drivers, Barriers & Challenges in US Emergency Lighting Industry
Key Drivers: Stringent safety regulations, growing adoption of energy-efficient LED technology, increasing awareness of building safety, and rising demand from various end-user sectors.
Key Challenges: High initial investment costs for advanced systems, potential supply chain disruptions, competition from cheaper substitutes, and complexity in integrating smart features into existing infrastructure. Supply chain issues have caused price increases of xx% in certain components between 2022 and 2024.
Emerging Opportunities in US Emergency Lighting Industry
Significant opportunities exist in integrating smart features and IoT technology into emergency lighting systems, enabling remote monitoring, predictive maintenance, and energy optimization. The adoption of advanced lighting control systems provides cost savings and improved operational efficiency. Furthermore, the growing focus on sustainable and eco-friendly solutions is creating opportunities for high-efficiency LED lighting and energy-harvesting technologies. Untapped markets include smaller businesses and residential sectors, which present significant growth potential.
Growth Accelerators in the US Emergency Lighting Industry Industry
Technological advancements in LED technology, battery life, and smart functionalities are driving significant growth. Strategic partnerships between lighting manufacturers and building automation companies are creating innovative solutions, fostering market expansion. Government incentives and tax breaks for energy-efficient lighting systems are further propelling market growth. The increasing focus on building safety and compliance with safety standards provides a solid foundation for continued expansion.
Key Players Shaping the US Emergency Lighting Industry Market
- ABB Ltd
- Legrand SA
- Signify NV (Including Cooper Lighting Solutions)
- Larson Electronics
- Cree Inc
- Hubbell Incorporated
- Encore Lighting
- Emerson Electric Co
- Eaton Corporation PLC
- Acuity Brands Inc
- Myers Emergency Power Systems
- Digital Lumens Inc
Notable Milestones in US Emergency Lighting Industry Sector
- June 2021: Eaton acquired Cobham Mission Systems, expanding its aerospace and defense offerings.
- June 2020: Emerson Appleton launched the Appleton Contender LED Luminaires, offering significant energy savings for retrofitting HID lighting systems.
In-Depth US Emergency Lighting Industry Market Outlook
The US emergency lighting market is poised for robust growth in the coming years, driven by sustained demand from various sectors, technological advancements, and supportive government policies. The integration of smart technologies, the increasing adoption of LED lighting, and a focus on sustainability will continue to shape the market landscape. Strategic partnerships and investments in R&D will play a crucial role in driving innovation and creating new growth opportunities for key players. The market is expected to reach xx million units by 2033, representing a significant expansion from its 2024 levels.
US Emergency Lighting Industry Segmentation
-
1. Type
- 1.1. Self-sustained
- 1.2. Centrally Supplied
-
2. End User
- 2.1. Commercial
- 2.2. Industrial
- 2.3. Educational
- 2.4. Healthcare
- 2.5. Other End Users
US Emergency Lighting Industry Segmentation By Geography
-
1. North America
- 1.1. United States
- 1.2. Canada
- 1.3. Mexico
-
2. South America
- 2.1. Brazil
- 2.2. Argentina
- 2.3. Rest of South America
-
3. Europe
- 3.1. United Kingdom
- 3.2. Germany
- 3.3. France
- 3.4. Italy
- 3.5. Spain
- 3.6. Russia
- 3.7. Benelux
- 3.8. Nordics
- 3.9. Rest of Europe
-
4. Middle East & Africa
- 4.1. Turkey
- 4.2. Israel
- 4.3. GCC
- 4.4. North Africa
- 4.5. South Africa
- 4.6. Rest of Middle East & Africa
-
5. Asia Pacific
- 5.1. China
- 5.2. India
- 5.3. Japan
- 5.4. South Korea
- 5.5. ASEAN
- 5.6. Oceania
- 5.7. Rest of Asia Pacific
US Emergency Lighting Industry Regional Market Share
Geographic Coverage of US Emergency Lighting Industry
US Emergency Lighting Industry REPORT HIGHLIGHTS
| Aspects | Details |
|---|---|
| Study Period | 2020-2034 |
| Base Year | 2025 |
| Estimated Year | 2026 |
| Forecast Period | 2026-2034 |
| Historical Period | 2020-2025 |
| Growth Rate | CAGR of 6.84% from 2020-2034 |
| Segmentation |
|
Table of Contents
- 1. Introduction
- 1.1. Research Scope
- 1.2. Market Segmentation
- 1.3. Research Methodology
- 1.4. Definitions and Assumptions
- 2. Executive Summary
- 2.1. Introduction
- 3. Market Dynamics
- 3.1. Introduction
- 3.2. Market Drivers
- 3.2.1. Increase in Need for Energy-efficient Lighting Systems and Favorable Government Regulations; Declining Prices of LED Products
- 3.3. Market Restrains
- 3.3.1. ; Lack of Awareness Regarding Installation Costs and Payback Periods
- 3.4. Market Trends
- 3.4.1. Development of Connected Systems and Internet of Things (IoT) and Declining Prices of LED to Drive the Market
- 4. Market Factor Analysis
- 4.1. Porters Five Forces
- 4.2. Supply/Value Chain
- 4.3. PESTEL analysis
- 4.4. Market Entropy
- 4.5. Patent/Trademark Analysis
- 5. Global US Emergency Lighting Industry Analysis, Insights and Forecast, 2020-2032
- 5.1. Market Analysis, Insights and Forecast - by Type
- 5.1.1. Self-sustained
- 5.1.2. Centrally Supplied
- 5.2. Market Analysis, Insights and Forecast - by End User
- 5.2.1. Commercial
- 5.2.2. Industrial
- 5.2.3. Educational
- 5.2.4. Healthcare
- 5.2.5. Other End Users
- 5.3. Market Analysis, Insights and Forecast - by Region
- 5.3.1. North America
- 5.3.2. South America
- 5.3.3. Europe
- 5.3.4. Middle East & Africa
- 5.3.5. Asia Pacific
- 5.1. Market Analysis, Insights and Forecast - by Type
- 6. North America US Emergency Lighting Industry Analysis, Insights and Forecast, 2020-2032
- 6.1. Market Analysis, Insights and Forecast - by Type
- 6.1.1. Self-sustained
- 6.1.2. Centrally Supplied
- 6.2. Market Analysis, Insights and Forecast - by End User
- 6.2.1. Commercial
- 6.2.2. Industrial
- 6.2.3. Educational
- 6.2.4. Healthcare
- 6.2.5. Other End Users
- 6.1. Market Analysis, Insights and Forecast - by Type
- 7. South America US Emergency Lighting Industry Analysis, Insights and Forecast, 2020-2032
- 7.1. Market Analysis, Insights and Forecast - by Type
- 7.1.1. Self-sustained
- 7.1.2. Centrally Supplied
- 7.2. Market Analysis, Insights and Forecast - by End User
- 7.2.1. Commercial
- 7.2.2. Industrial
- 7.2.3. Educational
- 7.2.4. Healthcare
- 7.2.5. Other End Users
- 7.1. Market Analysis, Insights and Forecast - by Type
- 8. Europe US Emergency Lighting Industry Analysis, Insights and Forecast, 2020-2032
- 8.1. Market Analysis, Insights and Forecast - by Type
- 8.1.1. Self-sustained
- 8.1.2. Centrally Supplied
- 8.2. Market Analysis, Insights and Forecast - by End User
- 8.2.1. Commercial
- 8.2.2. Industrial
- 8.2.3. Educational
- 8.2.4. Healthcare
- 8.2.5. Other End Users
- 8.1. Market Analysis, Insights and Forecast - by Type
- 9. Middle East & Africa US Emergency Lighting Industry Analysis, Insights and Forecast, 2020-2032
- 9.1. Market Analysis, Insights and Forecast - by Type
- 9.1.1. Self-sustained
- 9.1.2. Centrally Supplied
- 9.2. Market Analysis, Insights and Forecast - by End User
- 9.2.1. Commercial
- 9.2.2. Industrial
- 9.2.3. Educational
- 9.2.4. Healthcare
- 9.2.5. Other End Users
- 9.1. Market Analysis, Insights and Forecast - by Type
- 10. Asia Pacific US Emergency Lighting Industry Analysis, Insights and Forecast, 2020-2032
- 10.1. Market Analysis, Insights and Forecast - by Type
- 10.1.1. Self-sustained
- 10.1.2. Centrally Supplied
- 10.2. Market Analysis, Insights and Forecast - by End User
- 10.2.1. Commercial
- 10.2.2. Industrial
- 10.2.3. Educational
- 10.2.4. Healthcare
- 10.2.5. Other End Users
- 10.1. Market Analysis, Insights and Forecast - by Type
- 11. Competitive Analysis
- 11.1. Global Market Share Analysis 2025
- 11.2. Company Profiles
- 11.2.1 ABB Ltd
- 11.2.1.1. Overview
- 11.2.1.2. Products
- 11.2.1.3. SWOT Analysis
- 11.2.1.4. Recent Developments
- 11.2.1.5. Financials (Based on Availability)
- 11.2.2 Legrand SA
- 11.2.2.1. Overview
- 11.2.2.2. Products
- 11.2.2.3. SWOT Analysis
- 11.2.2.4. Recent Developments
- 11.2.2.5. Financials (Based on Availability)
- 11.2.3 Signify NV (Including Cooper Lighting Solutions)
- 11.2.3.1. Overview
- 11.2.3.2. Products
- 11.2.3.3. SWOT Analysis
- 11.2.3.4. Recent Developments
- 11.2.3.5. Financials (Based on Availability)
- 11.2.4 Larson Electronics
- 11.2.4.1. Overview
- 11.2.4.2. Products
- 11.2.4.3. SWOT Analysis
- 11.2.4.4. Recent Developments
- 11.2.4.5. Financials (Based on Availability)
- 11.2.5 Cree Inc
- 11.2.5.1. Overview
- 11.2.5.2. Products
- 11.2.5.3. SWOT Analysis
- 11.2.5.4. Recent Developments
- 11.2.5.5. Financials (Based on Availability)
- 11.2.6 Hubbell Incorporated
- 11.2.6.1. Overview
- 11.2.6.2. Products
- 11.2.6.3. SWOT Analysis
- 11.2.6.4. Recent Developments
- 11.2.6.5. Financials (Based on Availability)
- 11.2.7 Encore Lighting
- 11.2.7.1. Overview
- 11.2.7.2. Products
- 11.2.7.3. SWOT Analysis
- 11.2.7.4. Recent Developments
- 11.2.7.5. Financials (Based on Availability)
- 11.2.8 Emerson Electric Co
- 11.2.8.1. Overview
- 11.2.8.2. Products
- 11.2.8.3. SWOT Analysis
- 11.2.8.4. Recent Developments
- 11.2.8.5. Financials (Based on Availability)
- 11.2.9 Eaton Corporation PLC
- 11.2.9.1. Overview
- 11.2.9.2. Products
- 11.2.9.3. SWOT Analysis
- 11.2.9.4. Recent Developments
- 11.2.9.5. Financials (Based on Availability)
- 11.2.10 Acuity Brands Inc
- 11.2.10.1. Overview
- 11.2.10.2. Products
- 11.2.10.3. SWOT Analysis
- 11.2.10.4. Recent Developments
- 11.2.10.5. Financials (Based on Availability)
- 11.2.11 Myers Emergency Power Systems
- 11.2.11.1. Overview
- 11.2.11.2. Products
- 11.2.11.3. SWOT Analysis
- 11.2.11.4. Recent Developments
- 11.2.11.5. Financials (Based on Availability)
- 11.2.12 Digital Lumens Inc
- 11.2.12.1. Overview
- 11.2.12.2. Products
- 11.2.12.3. SWOT Analysis
- 11.2.12.4. Recent Developments
- 11.2.12.5. Financials (Based on Availability)
- 11.2.1 ABB Ltd
List of Figures
- Figure 1: Global US Emergency Lighting Industry Revenue Breakdown (Million, %) by Region 2025 & 2033
- Figure 2: Global US Emergency Lighting Industry Volume Breakdown (K Unit, %) by Region 2025 & 2033
- Figure 3: North America US Emergency Lighting Industry Revenue (Million), by Type 2025 & 2033
- Figure 4: North America US Emergency Lighting Industry Volume (K Unit), by Type 2025 & 2033
- Figure 5: North America US Emergency Lighting Industry Revenue Share (%), by Type 2025 & 2033
- Figure 6: North America US Emergency Lighting Industry Volume Share (%), by Type 2025 & 2033
- Figure 7: North America US Emergency Lighting Industry Revenue (Million), by End User 2025 & 2033
- Figure 8: North America US Emergency Lighting Industry Volume (K Unit), by End User 2025 & 2033
- Figure 9: North America US Emergency Lighting Industry Revenue Share (%), by End User 2025 & 2033
- Figure 10: North America US Emergency Lighting Industry Volume Share (%), by End User 2025 & 2033
- Figure 11: North America US Emergency Lighting Industry Revenue (Million), by Country 2025 & 2033
- Figure 12: North America US Emergency Lighting Industry Volume (K Unit), by Country 2025 & 2033
- Figure 13: North America US Emergency Lighting Industry Revenue Share (%), by Country 2025 & 2033
- Figure 14: North America US Emergency Lighting Industry Volume Share (%), by Country 2025 & 2033
- Figure 15: South America US Emergency Lighting Industry Revenue (Million), by Type 2025 & 2033
- Figure 16: South America US Emergency Lighting Industry Volume (K Unit), by Type 2025 & 2033
- Figure 17: South America US Emergency Lighting Industry Revenue Share (%), by Type 2025 & 2033
- Figure 18: South America US Emergency Lighting Industry Volume Share (%), by Type 2025 & 2033
- Figure 19: South America US Emergency Lighting Industry Revenue (Million), by End User 2025 & 2033
- Figure 20: South America US Emergency Lighting Industry Volume (K Unit), by End User 2025 & 2033
- Figure 21: South America US Emergency Lighting Industry Revenue Share (%), by End User 2025 & 2033
- Figure 22: South America US Emergency Lighting Industry Volume Share (%), by End User 2025 & 2033
- Figure 23: South America US Emergency Lighting Industry Revenue (Million), by Country 2025 & 2033
- Figure 24: South America US Emergency Lighting Industry Volume (K Unit), by Country 2025 & 2033
- Figure 25: South America US Emergency Lighting Industry Revenue Share (%), by Country 2025 & 2033
- Figure 26: South America US Emergency Lighting Industry Volume Share (%), by Country 2025 & 2033
- Figure 27: Europe US Emergency Lighting Industry Revenue (Million), by Type 2025 & 2033
- Figure 28: Europe US Emergency Lighting Industry Volume (K Unit), by Type 2025 & 2033
- Figure 29: Europe US Emergency Lighting Industry Revenue Share (%), by Type 2025 & 2033
- Figure 30: Europe US Emergency Lighting Industry Volume Share (%), by Type 2025 & 2033
- Figure 31: Europe US Emergency Lighting Industry Revenue (Million), by End User 2025 & 2033
- Figure 32: Europe US Emergency Lighting Industry Volume (K Unit), by End User 2025 & 2033
- Figure 33: Europe US Emergency Lighting Industry Revenue Share (%), by End User 2025 & 2033
- Figure 34: Europe US Emergency Lighting Industry Volume Share (%), by End User 2025 & 2033
- Figure 35: Europe US Emergency Lighting Industry Revenue (Million), by Country 2025 & 2033
- Figure 36: Europe US Emergency Lighting Industry Volume (K Unit), by Country 2025 & 2033
- Figure 37: Europe US Emergency Lighting Industry Revenue Share (%), by Country 2025 & 2033
- Figure 38: Europe US Emergency Lighting Industry Volume Share (%), by Country 2025 & 2033
- Figure 39: Middle East & Africa US Emergency Lighting Industry Revenue (Million), by Type 2025 & 2033
- Figure 40: Middle East & Africa US Emergency Lighting Industry Volume (K Unit), by Type 2025 & 2033
- Figure 41: Middle East & Africa US Emergency Lighting Industry Revenue Share (%), by Type 2025 & 2033
- Figure 42: Middle East & Africa US Emergency Lighting Industry Volume Share (%), by Type 2025 & 2033
- Figure 43: Middle East & Africa US Emergency Lighting Industry Revenue (Million), by End User 2025 & 2033
- Figure 44: Middle East & Africa US Emergency Lighting Industry Volume (K Unit), by End User 2025 & 2033
- Figure 45: Middle East & Africa US Emergency Lighting Industry Revenue Share (%), by End User 2025 & 2033
- Figure 46: Middle East & Africa US Emergency Lighting Industry Volume Share (%), by End User 2025 & 2033
- Figure 47: Middle East & Africa US Emergency Lighting Industry Revenue (Million), by Country 2025 & 2033
- Figure 48: Middle East & Africa US Emergency Lighting Industry Volume (K Unit), by Country 2025 & 2033
- Figure 49: Middle East & Africa US Emergency Lighting Industry Revenue Share (%), by Country 2025 & 2033
- Figure 50: Middle East & Africa US Emergency Lighting Industry Volume Share (%), by Country 2025 & 2033
- Figure 51: Asia Pacific US Emergency Lighting Industry Revenue (Million), by Type 2025 & 2033
- Figure 52: Asia Pacific US Emergency Lighting Industry Volume (K Unit), by Type 2025 & 2033
- Figure 53: Asia Pacific US Emergency Lighting Industry Revenue Share (%), by Type 2025 & 2033
- Figure 54: Asia Pacific US Emergency Lighting Industry Volume Share (%), by Type 2025 & 2033
- Figure 55: Asia Pacific US Emergency Lighting Industry Revenue (Million), by End User 2025 & 2033
- Figure 56: Asia Pacific US Emergency Lighting Industry Volume (K Unit), by End User 2025 & 2033
- Figure 57: Asia Pacific US Emergency Lighting Industry Revenue Share (%), by End User 2025 & 2033
- Figure 58: Asia Pacific US Emergency Lighting Industry Volume Share (%), by End User 2025 & 2033
- Figure 59: Asia Pacific US Emergency Lighting Industry Revenue (Million), by Country 2025 & 2033
- Figure 60: Asia Pacific US Emergency Lighting Industry Volume (K Unit), by Country 2025 & 2033
- Figure 61: Asia Pacific US Emergency Lighting Industry Revenue Share (%), by Country 2025 & 2033
- Figure 62: Asia Pacific US Emergency Lighting Industry Volume Share (%), by Country 2025 & 2033
List of Tables
- Table 1: Global US Emergency Lighting Industry Revenue Million Forecast, by Type 2020 & 2033
- Table 2: Global US Emergency Lighting Industry Volume K Unit Forecast, by Type 2020 & 2033
- Table 3: Global US Emergency Lighting Industry Revenue Million Forecast, by End User 2020 & 2033
- Table 4: Global US Emergency Lighting Industry Volume K Unit Forecast, by End User 2020 & 2033
- Table 5: Global US Emergency Lighting Industry Revenue Million Forecast, by Region 2020 & 2033
- Table 6: Global US Emergency Lighting Industry Volume K Unit Forecast, by Region 2020 & 2033
- Table 7: Global US Emergency Lighting Industry Revenue Million Forecast, by Type 2020 & 2033
- Table 8: Global US Emergency Lighting Industry Volume K Unit Forecast, by Type 2020 & 2033
- Table 9: Global US Emergency Lighting Industry Revenue Million Forecast, by End User 2020 & 2033
- Table 10: Global US Emergency Lighting Industry Volume K Unit Forecast, by End User 2020 & 2033
- Table 11: Global US Emergency Lighting Industry Revenue Million Forecast, by Country 2020 & 2033
- Table 12: Global US Emergency Lighting Industry Volume K Unit Forecast, by Country 2020 & 2033
- Table 13: United States US Emergency Lighting Industry Revenue (Million) Forecast, by Application 2020 & 2033
- Table 14: United States US Emergency Lighting Industry Volume (K Unit) Forecast, by Application 2020 & 2033
- Table 15: Canada US Emergency Lighting Industry Revenue (Million) Forecast, by Application 2020 & 2033
- Table 16: Canada US Emergency Lighting Industry Volume (K Unit) Forecast, by Application 2020 & 2033
- Table 17: Mexico US Emergency Lighting Industry Revenue (Million) Forecast, by Application 2020 & 2033
- Table 18: Mexico US Emergency Lighting Industry Volume (K Unit) Forecast, by Application 2020 & 2033
- Table 19: Global US Emergency Lighting Industry Revenue Million Forecast, by Type 2020 & 2033
- Table 20: Global US Emergency Lighting Industry Volume K Unit Forecast, by Type 2020 & 2033
- Table 21: Global US Emergency Lighting Industry Revenue Million Forecast, by End User 2020 & 2033
- Table 22: Global US Emergency Lighting Industry Volume K Unit Forecast, by End User 2020 & 2033
- Table 23: Global US Emergency Lighting Industry Revenue Million Forecast, by Country 2020 & 2033
- Table 24: Global US Emergency Lighting Industry Volume K Unit Forecast, by Country 2020 & 2033
- Table 25: Brazil US Emergency Lighting Industry Revenue (Million) Forecast, by Application 2020 & 2033
- Table 26: Brazil US Emergency Lighting Industry Volume (K Unit) Forecast, by Application 2020 & 2033
- Table 27: Argentina US Emergency Lighting Industry Revenue (Million) Forecast, by Application 2020 & 2033
- Table 28: Argentina US Emergency Lighting Industry Volume (K Unit) Forecast, by Application 2020 & 2033
- Table 29: Rest of South America US Emergency Lighting Industry Revenue (Million) Forecast, by Application 2020 & 2033
- Table 30: Rest of South America US Emergency Lighting Industry Volume (K Unit) Forecast, by Application 2020 & 2033
- Table 31: Global US Emergency Lighting Industry Revenue Million Forecast, by Type 2020 & 2033
- Table 32: Global US Emergency Lighting Industry Volume K Unit Forecast, by Type 2020 & 2033
- Table 33: Global US Emergency Lighting Industry Revenue Million Forecast, by End User 2020 & 2033
- Table 34: Global US Emergency Lighting Industry Volume K Unit Forecast, by End User 2020 & 2033
- Table 35: Global US Emergency Lighting Industry Revenue Million Forecast, by Country 2020 & 2033
- Table 36: Global US Emergency Lighting Industry Volume K Unit Forecast, by Country 2020 & 2033
- Table 37: United Kingdom US Emergency Lighting Industry Revenue (Million) Forecast, by Application 2020 & 2033
- Table 38: United Kingdom US Emergency Lighting Industry Volume (K Unit) Forecast, by Application 2020 & 2033
- Table 39: Germany US Emergency Lighting Industry Revenue (Million) Forecast, by Application 2020 & 2033
- Table 40: Germany US Emergency Lighting Industry Volume (K Unit) Forecast, by Application 2020 & 2033
- Table 41: France US Emergency Lighting Industry Revenue (Million) Forecast, by Application 2020 & 2033
- Table 42: France US Emergency Lighting Industry Volume (K Unit) Forecast, by Application 2020 & 2033
- Table 43: Italy US Emergency Lighting Industry Revenue (Million) Forecast, by Application 2020 & 2033
- Table 44: Italy US Emergency Lighting Industry Volume (K Unit) Forecast, by Application 2020 & 2033
- Table 45: Spain US Emergency Lighting Industry Revenue (Million) Forecast, by Application 2020 & 2033
- Table 46: Spain US Emergency Lighting Industry Volume (K Unit) Forecast, by Application 2020 & 2033
- Table 47: Russia US Emergency Lighting Industry Revenue (Million) Forecast, by Application 2020 & 2033
- Table 48: Russia US Emergency Lighting Industry Volume (K Unit) Forecast, by Application 2020 & 2033
- Table 49: Benelux US Emergency Lighting Industry Revenue (Million) Forecast, by Application 2020 & 2033
- Table 50: Benelux US Emergency Lighting Industry Volume (K Unit) Forecast, by Application 2020 & 2033
- Table 51: Nordics US Emergency Lighting Industry Revenue (Million) Forecast, by Application 2020 & 2033
- Table 52: Nordics US Emergency Lighting Industry Volume (K Unit) Forecast, by Application 2020 & 2033
- Table 53: Rest of Europe US Emergency Lighting Industry Revenue (Million) Forecast, by Application 2020 & 2033
- Table 54: Rest of Europe US Emergency Lighting Industry Volume (K Unit) Forecast, by Application 2020 & 2033
- Table 55: Global US Emergency Lighting Industry Revenue Million Forecast, by Type 2020 & 2033
- Table 56: Global US Emergency Lighting Industry Volume K Unit Forecast, by Type 2020 & 2033
- Table 57: Global US Emergency Lighting Industry Revenue Million Forecast, by End User 2020 & 2033
- Table 58: Global US Emergency Lighting Industry Volume K Unit Forecast, by End User 2020 & 2033
- Table 59: Global US Emergency Lighting Industry Revenue Million Forecast, by Country 2020 & 2033
- Table 60: Global US Emergency Lighting Industry Volume K Unit Forecast, by Country 2020 & 2033
- Table 61: Turkey US Emergency Lighting Industry Revenue (Million) Forecast, by Application 2020 & 2033
- Table 62: Turkey US Emergency Lighting Industry Volume (K Unit) Forecast, by Application 2020 & 2033
- Table 63: Israel US Emergency Lighting Industry Revenue (Million) Forecast, by Application 2020 & 2033
- Table 64: Israel US Emergency Lighting Industry Volume (K Unit) Forecast, by Application 2020 & 2033
- Table 65: GCC US Emergency Lighting Industry Revenue (Million) Forecast, by Application 2020 & 2033
- Table 66: GCC US Emergency Lighting Industry Volume (K Unit) Forecast, by Application 2020 & 2033
- Table 67: North Africa US Emergency Lighting Industry Revenue (Million) Forecast, by Application 2020 & 2033
- Table 68: North Africa US Emergency Lighting Industry Volume (K Unit) Forecast, by Application 2020 & 2033
- Table 69: South Africa US Emergency Lighting Industry Revenue (Million) Forecast, by Application 2020 & 2033
- Table 70: South Africa US Emergency Lighting Industry Volume (K Unit) Forecast, by Application 2020 & 2033
- Table 71: Rest of Middle East & Africa US Emergency Lighting Industry Revenue (Million) Forecast, by Application 2020 & 2033
- Table 72: Rest of Middle East & Africa US Emergency Lighting Industry Volume (K Unit) Forecast, by Application 2020 & 2033
- Table 73: Global US Emergency Lighting Industry Revenue Million Forecast, by Type 2020 & 2033
- Table 74: Global US Emergency Lighting Industry Volume K Unit Forecast, by Type 2020 & 2033
- Table 75: Global US Emergency Lighting Industry Revenue Million Forecast, by End User 2020 & 2033
- Table 76: Global US Emergency Lighting Industry Volume K Unit Forecast, by End User 2020 & 2033
- Table 77: Global US Emergency Lighting Industry Revenue Million Forecast, by Country 2020 & 2033
- Table 78: Global US Emergency Lighting Industry Volume K Unit Forecast, by Country 2020 & 2033
- Table 79: China US Emergency Lighting Industry Revenue (Million) Forecast, by Application 2020 & 2033
- Table 80: China US Emergency Lighting Industry Volume (K Unit) Forecast, by Application 2020 & 2033
- Table 81: India US Emergency Lighting Industry Revenue (Million) Forecast, by Application 2020 & 2033
- Table 82: India US Emergency Lighting Industry Volume (K Unit) Forecast, by Application 2020 & 2033
- Table 83: Japan US Emergency Lighting Industry Revenue (Million) Forecast, by Application 2020 & 2033
- Table 84: Japan US Emergency Lighting Industry Volume (K Unit) Forecast, by Application 2020 & 2033
- Table 85: South Korea US Emergency Lighting Industry Revenue (Million) Forecast, by Application 2020 & 2033
- Table 86: South Korea US Emergency Lighting Industry Volume (K Unit) Forecast, by Application 2020 & 2033
- Table 87: ASEAN US Emergency Lighting Industry Revenue (Million) Forecast, by Application 2020 & 2033
- Table 88: ASEAN US Emergency Lighting Industry Volume (K Unit) Forecast, by Application 2020 & 2033
- Table 89: Oceania US Emergency Lighting Industry Revenue (Million) Forecast, by Application 2020 & 2033
- Table 90: Oceania US Emergency Lighting Industry Volume (K Unit) Forecast, by Application 2020 & 2033
- Table 91: Rest of Asia Pacific US Emergency Lighting Industry Revenue (Million) Forecast, by Application 2020 & 2033
- Table 92: Rest of Asia Pacific US Emergency Lighting Industry Volume (K Unit) Forecast, by Application 2020 & 2033
Frequently Asked Questions
1. What is the projected Compound Annual Growth Rate (CAGR) of the US Emergency Lighting Industry?
The projected CAGR is approximately 6.84%.
2. Which companies are prominent players in the US Emergency Lighting Industry?
Key companies in the market include ABB Ltd, Legrand SA, Signify NV (Including Cooper Lighting Solutions), Larson Electronics, Cree Inc, Hubbell Incorporated, Encore Lighting, Emerson Electric Co, Eaton Corporation PLC, Acuity Brands Inc, Myers Emergency Power Systems, Digital Lumens Inc.
3. What are the main segments of the US Emergency Lighting Industry?
The market segments include Type, End User.
4. Can you provide details about the market size?
The market size is estimated to be USD 1.94 Million as of 2022.
5. What are some drivers contributing to market growth?
Increase in Need for Energy-efficient Lighting Systems and Favorable Government Regulations; Declining Prices of LED Products.
6. What are the notable trends driving market growth?
Development of Connected Systems and Internet of Things (IoT) and Declining Prices of LED to Drive the Market.
7. Are there any restraints impacting market growth?
; Lack of Awareness Regarding Installation Costs and Payback Periods.
8. Can you provide examples of recent developments in the market?
June 2021 - Eaton acquired Cobham Mission Systems. Cobham is a manufacturer of air-to-air refueling systems, environmental systems, and actuation, primarily for defense markets. This acquisition will help to expand Eaton Aerospace's fuel systems offerings and other defense-related offerings.
9. What pricing options are available for accessing the report?
Pricing options include single-user, multi-user, and enterprise licenses priced at USD 3800, USD 4500, and USD 5800 respectively.
10. Is the market size provided in terms of value or volume?
The market size is provided in terms of value, measured in Million and volume, measured in K Unit.
11. Are there any specific market keywords associated with the report?
Yes, the market keyword associated with the report is "US Emergency Lighting Industry," which aids in identifying and referencing the specific market segment covered.
12. How do I determine which pricing option suits my needs best?
The pricing options vary based on user requirements and access needs. Individual users may opt for single-user licenses, while businesses requiring broader access may choose multi-user or enterprise licenses for cost-effective access to the report.
13. Are there any additional resources or data provided in the US Emergency Lighting Industry report?
While the report offers comprehensive insights, it's advisable to review the specific contents or supplementary materials provided to ascertain if additional resources or data are available.
14. How can I stay updated on further developments or reports in the US Emergency Lighting Industry?
To stay informed about further developments, trends, and reports in the US Emergency Lighting Industry, consider subscribing to industry newsletters, following relevant companies and organizations, or regularly checking reputable industry news sources and publications.
Methodology
Step 1 - Identification of Relevant Samples Size from Population Database


Step 2 - Approaches for Defining Global Market Size (Value, Volume* & Price*)

Note*: In applicable scenarios
Step 3 - Data Sources
Primary Research
- Web Analytics
- Survey Reports
- Research Institute
- Latest Research Reports
- Opinion Leaders
Secondary Research
- Annual Reports
- White Paper
- Latest Press Release
- Industry Association
- Paid Database
- Investor Presentations

Step 4 - Data Triangulation
Involves using different sources of information in order to increase the validity of a study
These sources are likely to be stakeholders in a program - participants, other researchers, program staff, other community members, and so on.
Then we put all data in single framework & apply various statistical tools to find out the dynamic on the market.
During the analysis stage, feedback from the stakeholder groups would be compared to determine areas of agreement as well as areas of divergence