

Key Insights
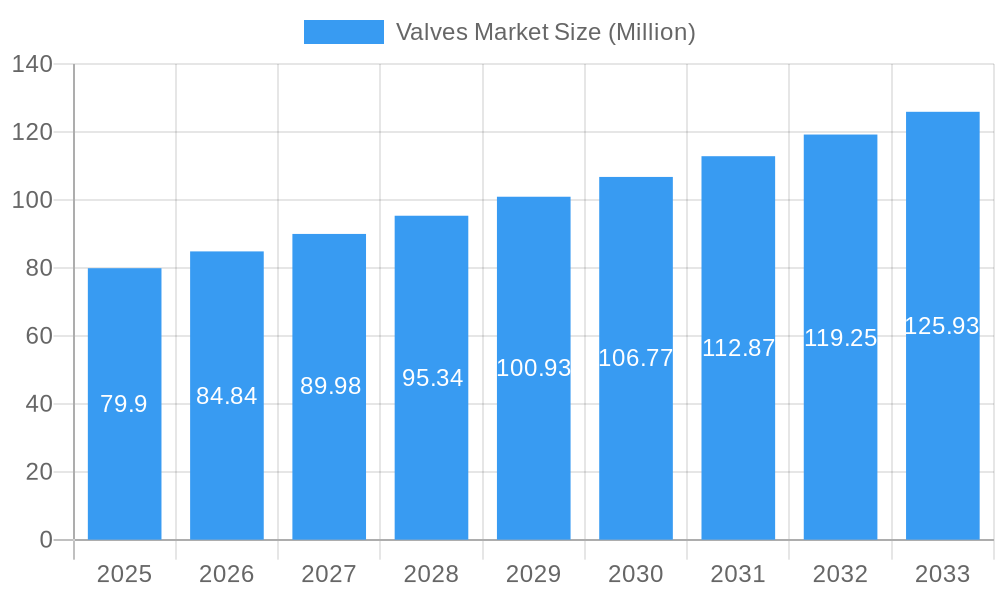
The global Valves Market is projected to reach a substantial USD 79.90 million in 2025, driven by an anticipated Compound Annual Growth Rate (CAGR) of 6.25% throughout the forecast period (2025-2033). This robust growth is propelled by critical demand across key industrial sectors, most notably Oil & Gas, Power Generation, and Chemical processing. These industries rely heavily on a diverse range of valve types, including Ball, Butterfly, Gate, Globe, Check, and Plug valves, to ensure operational efficiency, safety, and environmental compliance. The increasing global energy demand, coupled with significant investments in infrastructure development and stringent regulations regarding emissions and process control, are fundamental drivers for the expansion of the valves market. Furthermore, the growing emphasis on smart manufacturing and the integration of IoT in industrial automation is fostering the adoption of advanced control valves, contributing to market dynamism.
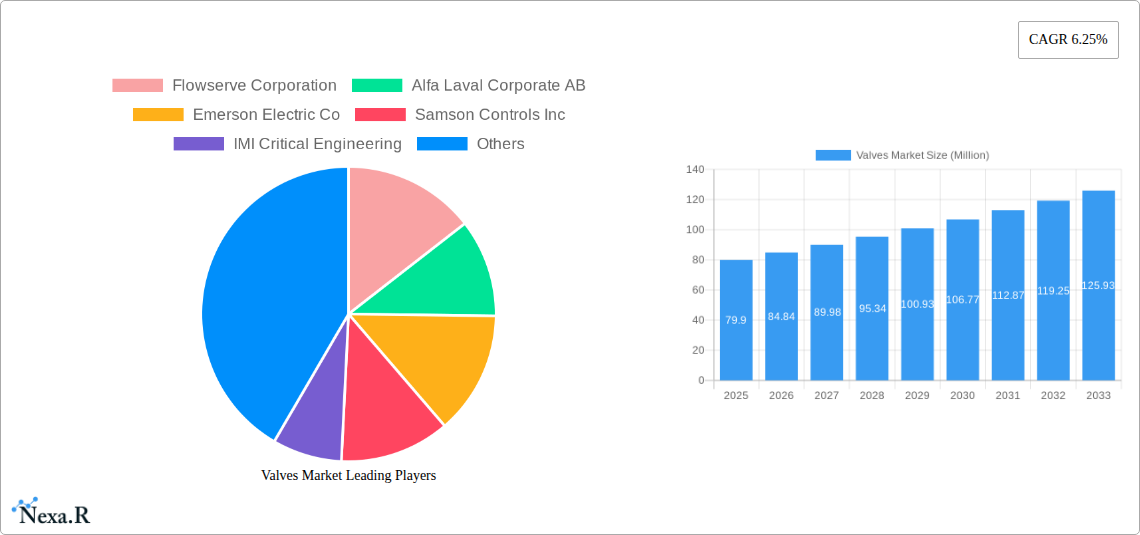
Valves Market Market Size (In Million)
The market's trajectory is also shaped by evolving trends such as the increasing adoption of corrosion-resistant and high-performance valves designed for extreme operating conditions. This is particularly evident in the chemical and power generation sectors, where harsh environments necessitate specialized valve solutions. While the market presents considerable opportunities, certain restraints, such as fluctuating raw material prices and intense competition among established players like Flowserve Corporation, Alfa Laval Corporate AB, and Emerson Electric Co., could pose challenges. However, the inherent necessity of valves in controlling fluid and gas flow across a multitude of industrial applications, from water and wastewater treatment to mining operations, ensures sustained demand. The Asia Pacific region is expected to emerge as a significant growth engine due to rapid industrialization and burgeoning infrastructure projects.
Valves Market Company Market Share
Unlocking the Global Valves Market: A Comprehensive Analysis (2019-2033)
This in-depth report provides a strategic analysis of the global Valves Market, offering critical insights into its dynamics, growth trajectories, and future potential. Delving into parent and child market segments, this study equips industry stakeholders with the data and foresight needed to navigate this complex and evolving landscape. The report meticulously covers the period from 2019 to 2033, with a base year of 2025 and a detailed forecast period from 2025 to 2033. Values are presented in Million Units for precise understanding.
Valves Market Dynamics & Structure
The global Valves Market exhibits a dynamic and moderately consolidated structure, influenced by a confluence of technological advancements, stringent regulatory frameworks, and evolving end-user demands. Innovation remains a key driver, with manufacturers continuously investing in smart valve technologies, advanced materials, and enhanced automation capabilities to improve efficiency, safety, and reliability. The growing emphasis on industrial automation and the Industrial Internet of Things (IIoT) is significantly reshaping product development and market strategies. Regulatory compliance, particularly concerning environmental standards and safety protocols in sectors like oil and gas and chemical processing, imposes significant influence on product design and market entry. Competitive product substitutes, while present in niche applications, are largely overcome by the specialized functionalities and robust performance offered by various valve types. End-user demographics are shifting, with increasing demand from burgeoning economies and a growing preference for sustainable and energy-efficient solutions. Mergers and Acquisitions (M&A) trends indicate a strategic consolidation, with larger players acquiring innovative smaller companies to expand their product portfolios and geographical reach.
- Market Concentration: Moderate, with a few key global players dominating significant market share, alongside a competitive landscape of regional and specialized manufacturers.
- Technological Innovation: Driven by smart valve technology, IIoT integration, advanced material science, and energy-efficient designs.
- Regulatory Frameworks: Strict regulations concerning safety, emissions, and operational efficiency across various end-user verticals, particularly in oil & gas and chemical industries.
- Competitive Product Substitutes: Limited in specialized applications due to the inherent functional advantages of dedicated valve types.
- End-User Demographics: Shifting towards emerging economies and a growing demand for sustainable and digitally integrated solutions.
- M&A Trends: Strategic acquisitions aimed at expanding product offerings, technological capabilities, and market presence.
Valves Market Growth Trends & Insights
The Valves Market is poised for robust growth, driven by escalating industrialization, infrastructure development, and the persistent demand for efficient fluid control across diverse sectors. The study period, encompassing 2019-2033, will witness a significant market size evolution, fueled by the increasing adoption of advanced valve technologies and the growing emphasis on operational efficiency and safety. The historical period (2019-2024) has laid the groundwork for this expansion, with steady demand from core industries. The base year, 2025, marks a pivotal point, with estimated growth reflecting ongoing trends. By 2025, the market is projected to reach significant figures, with the forecast period (2025-2033) anticipating a sustained Compound Annual Growth Rate (CAGR) of approximately 5.5%. This expansion is underpinned by rising adoption rates of automated and intelligent valves, which offer enhanced control, diagnostics, and remote monitoring capabilities. Technological disruptions, such as the integration of AI and machine learning in valve diagnostics and predictive maintenance, are expected to further accelerate market penetration, optimizing operational uptime and reducing maintenance costs. Consumer behavior shifts are also playing a crucial role, with end-users increasingly prioritizing long-term value, total cost of ownership, and sustainable operational practices. The demand for high-performance valves in critical applications within the oil and gas sector, coupled with the expansion of power generation facilities and the increasing need for advanced water and wastewater treatment solutions, will collectively contribute to the market's upward trajectory. The mining industry's growing reliance on efficient material handling and the chemical sector's continuous need for precise process control further solidify the market's growth outlook. The development of specialized valve solutions for emerging applications, such as renewable energy systems and advanced manufacturing processes, will also contribute to market diversification and sustained growth.
Dominant Regions, Countries, or Segments in Valves Market
The Valves Market is witnessing dominance driven by a combination of economic prowess, industrial intensity, and strategic investments in infrastructure and technological advancements. Within the End-User Vertical segment, Oil and Gas remains a primary growth driver, accounting for an estimated 30% of the global market value in 2025. This dominance is propelled by ongoing exploration and production activities, the need for robust pipeline infrastructure, and the increasing demand for valves in refining and petrochemical operations. The Power Generation sector also represents a significant and growing segment, projected to contribute approximately 20% of the market by 2025, fueled by the global shift towards both traditional and renewable energy sources, requiring a wide array of specialized valves for efficient operation and safety. The Chemical industry, another substantial vertical, is estimated to hold a 18% market share in 2025, driven by complex process control requirements and the demand for corrosion-resistant and high-purity valves.
Geographically, North America is anticipated to be a dominant region, holding an estimated 35% market share in 2025, with the United States leading due to its established oil and gas industry, significant investments in infrastructure upgrades, and a strong focus on technological innovation in valve manufacturing. Asia Pacific is emerging as a rapidly growing region, projected to capture approximately 25% of the market by 2025, with countries like China and India spearheading this expansion through massive industrialization, urbanization, and substantial government initiatives in infrastructure development and manufacturing.
Among the Type segments, Ball Valves and Gate/Globe/Check Valves collectively command a significant market share, estimated to be around 40% in 2025, due to their widespread application across various industries and their reliability in critical fluid control applications. Control Valves are also a crucial and growing segment, expected to represent 25% of the market by 2025, driven by the increasing demand for precise process automation and optimization.
- Dominant End-User Vertical: Oil and Gas, driven by exploration, production, and downstream processing.
- Key Drivers in Oil and Gas: Pipeline integrity, refining efficiency, and deep-sea exploration.
- Dominant End-User Vertical: Power Generation, fueled by the expansion of both fossil fuel and renewable energy infrastructure.
- Key Drivers in Power Generation: Turbine control, steam management, and water treatment for plants.
- Dominant End-User Vertical: Chemical, driven by stringent process control and safety requirements.
- Key Drivers in Chemical: Corrosive fluid handling, precise dosing, and hazardous material containment.
- Dominant Region: North America, led by the United States, due to its mature industrial base and technological leadership.
- Key Drivers in North America: Advanced manufacturing, infrastructure modernization, and energy sector demand.
- Emerging Region: Asia Pacific, driven by rapid industrialization and infrastructure development in China and India.
- Key Drivers in Asia Pacific: Urbanization, manufacturing growth, and energy security needs.
- Dominant Valve Type: Ball Valves and Gate/Globe/Check Valves, due to their versatility and widespread application.
- Key Drivers for Ball/Gate/Globe/Check Valves: Durability, cost-effectiveness, and broad applicability.
- Growing Valve Type: Control Valves, driven by the increasing need for automation and precision in industrial processes.
- Key Drivers for Control Valves: Process optimization, energy efficiency, and automated system integration.
Valves Market Product Landscape
The Valves Market product landscape is characterized by continuous innovation in materials science, intelligent functionality, and application-specific designs. Manufacturers are increasingly focusing on developing valves with enhanced corrosion resistance, higher pressure and temperature ratings, and improved sealing capabilities to meet the stringent demands of various industries. Smart valves, integrated with sensors and communication modules, are gaining traction, offering real-time data on performance, diagnostics, and predictive maintenance. Innovations in butterfly valves are leading to lighter-weight designs and improved flow characteristics. Gate, globe, and check valves are seeing advancements in sealing technologies and reduced torque requirements for easier operation. Control valves are benefiting from more sophisticated actuator technologies and digital positioners, enabling precise and responsive process control. Plug valves are being developed for specialized applications requiring tight shut-off and quick operation. The increasing emphasis on sustainability is driving the development of energy-efficient valve designs that minimize leakage and reduce energy consumption.
Key Drivers, Barriers & Challenges in Valves Market
Key Drivers:
- Growing Industrial Automation: The surge in automation across manufacturing, oil & gas, and power sectors is a primary driver for advanced valve technologies.
- Infrastructure Development: Significant global investments in new infrastructure projects, including pipelines, power plants, and water treatment facilities, are boosting demand.
- Technological Advancements: The integration of IIoT, AI, and smart sensors is enhancing valve performance, diagnostics, and predictive maintenance capabilities.
- Energy Efficiency Initiatives: Increasing focus on reducing energy consumption and emissions across industries necessitates the adoption of efficient valve solutions.
- Stringent Safety and Environmental Regulations: Compliance with evolving regulations in critical sectors like oil & gas and chemicals drives demand for high-performance, leak-proof valves.
Barriers & Challenges:
- Supply Chain Disruptions: Geopolitical factors, raw material availability, and logistics challenges can impact production and delivery timelines.
- High Initial Investment Costs: Advanced and specialized valve technologies often come with a higher upfront cost, posing a challenge for smaller enterprises.
- Intense Competition: The market is characterized by numerous players, leading to price pressures and the need for continuous product differentiation.
- Skilled Workforce Shortage: A lack of skilled labor for manufacturing, installation, and maintenance of complex valve systems can hinder growth.
- Cybersecurity Concerns: The increasing digitalization of valves raises concerns about potential cyber threats and the need for robust security measures.
Emerging Opportunities in Valves Market
Emerging opportunities in the Valves Market lie in the burgeoning sectors of renewable energy, advanced manufacturing, and the increasing adoption of smart city initiatives. The expansion of the hydrogen economy presents a significant opportunity for specialized valves designed for high-pressure and corrosive environments. The growing demand for sophisticated water and wastewater treatment solutions, particularly in developing economies, opens avenues for innovative and sustainable valve technologies. Furthermore, the adoption of predictive maintenance solutions powered by AI and machine learning in existing industrial infrastructure offers a substantial growth area for smart valve manufacturers. The trend towards modularization and digitalization in manufacturing processes will also drive the demand for compact, intelligent, and easily integrated valve systems.
Growth Accelerators in the Valves Market Industry
Several factors are acting as significant growth accelerators for the Valves Market. The relentless push towards digital transformation and the adoption of Industry 4.0 principles are driving the integration of smart valves with advanced control systems and data analytics platforms. Strategic partnerships and collaborations between valve manufacturers and technology providers are accelerating the development and deployment of innovative solutions. The growing emphasis on asset integrity management and operational efficiency across industries is prompting greater investment in high-performance and low-maintenance valve technologies. Furthermore, the increasing globalization of manufacturing and the expansion of emerging economies present vast untapped markets and opportunities for market expansion strategies, including localized production and tailored product offerings.
Key Players Shaping the Valves Market Market
- Flowserve Corporation
- Alfa Laval Corporate AB
- Emerson Electric Co
- Samson Controls Inc
- IMI Critical Engineering
- Crane Co
- Rotork plc
- Schlumberger Limited
- Spirax Sarco Limited
- KITZ Corporation
Notable Milestones in Valves Market Sector
- 2021: Launch of advanced digital valve controllers with predictive maintenance capabilities by Emerson Electric Co.
- 2022: Alfa Laval Corporate AB expands its portfolio of hygienic valves for the biopharmaceutical industry.
- 2022: IMI Critical Engineering secures significant contracts for valves in major offshore oil and gas projects.
- 2023: Flowserve Corporation introduces a new generation of intelligent actuators designed for enhanced efficiency and reliability.
- 2023: Rotork plc announces a strategic acquisition to strengthen its presence in the digital valve actuation market.
- 2024: KITZ Corporation unveils a new range of environmentally friendly valves with reduced emissions.
- 2024: Crane Co expands its valve offerings for the growing renewable energy sector.
In-Depth Valves Market Market Outlook
The future outlook for the Valves Market is exceptionally promising, fueled by the sustained global drive towards industrial modernization, energy transition, and stringent environmental compliance. Growth accelerators such as the pervasive adoption of Industry 4.0 technologies, including AI-powered diagnostics and IoT integration, will continue to reshape product development and market strategies. Strategic partnerships and increasing investments in research and development will unlock new product innovations and application areas, particularly in sectors like renewable energy, advanced materials, and sustainable infrastructure. The ongoing expansion of emerging economies and the relentless pursuit of operational efficiency and safety across all industrial verticals will ensure a robust and consistent demand for advanced valve solutions, positioning the market for significant and sustained growth in the coming years.
Valves Market Segmentation
-
1. Type
- 1.1. Ball
- 1.2. Butterfly
- 1.3. Gate/Globe/Check
- 1.4. Plug
- 1.5. Control
- 1.6. Other Types
-
2. End-User Vertical
- 2.1. Oil and Gas
- 2.2. Power Generation
- 2.3. Chemical
- 2.4. Water and Wastewater
- 2.5. Mining
- 2.6. Other End User Verticals
Valves Market Segmentation By Geography
- 1. North America
- 2. Europe
- 3. Asia Pacific
- 4. Latin America
- 5. Middle East and Africa
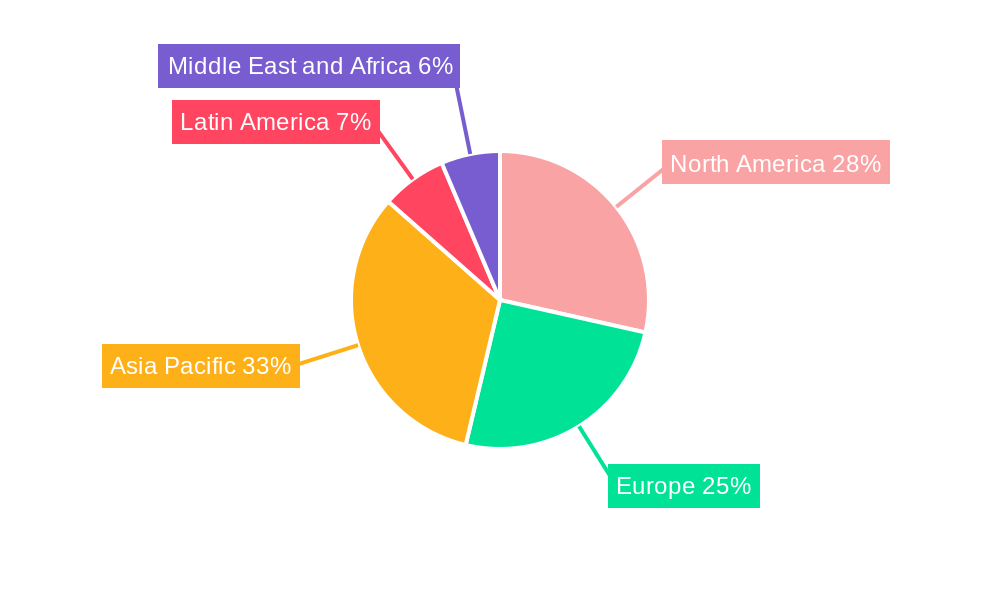
Valves Market Regional Market Share
Geographic Coverage of Valves Market
Valves Market REPORT HIGHLIGHTS
| Aspects | Details |
|---|---|
| Study Period | 2020-2034 |
| Base Year | 2025 |
| Estimated Year | 2026 |
| Forecast Period | 2026-2034 |
| Historical Period | 2020-2025 |
| Growth Rate | CAGR of 6.25% from 2020-2034 |
| Segmentation |
|
Table of Contents
- 1. Introduction
- 1.1. Research Scope
- 1.2. Market Segmentation
- 1.3. Research Methodology
- 1.4. Definitions and Assumptions
- 2. Executive Summary
- 2.1. Introduction
- 3. Market Dynamics
- 3.1. Introduction
- 3.2. Market Drivers
- 3.2.1. Rise in Infrastructure-Related Developments; Adoption of Emerging Technologies
- 3.3. Market Restrains
- 3.3.1. ; High Capital Investment and Increasing Use of Fiber Optic Transmission Cables; Regulatory Constraints and Limited Orbital Locations
- 3.4. Market Trends
- 3.4.1. Oil and Gas Vertical Accounts for a Major Market Share
- 4. Market Factor Analysis
- 4.1. Porters Five Forces
- 4.2. Supply/Value Chain
- 4.3. PESTEL analysis
- 4.4. Market Entropy
- 4.5. Patent/Trademark Analysis
- 5. Global Valves Market Analysis, Insights and Forecast, 2020-2032
- 5.1. Market Analysis, Insights and Forecast - by Type
- 5.1.1. Ball
- 5.1.2. Butterfly
- 5.1.3. Gate/Globe/Check
- 5.1.4. Plug
- 5.1.5. Control
- 5.1.6. Other Types
- 5.2. Market Analysis, Insights and Forecast - by End-User Vertical
- 5.2.1. Oil and Gas
- 5.2.2. Power Generation
- 5.2.3. Chemical
- 5.2.4. Water and Wastewater
- 5.2.5. Mining
- 5.2.6. Other End User Verticals
- 5.3. Market Analysis, Insights and Forecast - by Region
- 5.3.1. North America
- 5.3.2. Europe
- 5.3.3. Asia Pacific
- 5.3.4. Latin America
- 5.3.5. Middle East and Africa
- 5.1. Market Analysis, Insights and Forecast - by Type
- 6. North America Valves Market Analysis, Insights and Forecast, 2020-2032
- 6.1. Market Analysis, Insights and Forecast - by Type
- 6.1.1. Ball
- 6.1.2. Butterfly
- 6.1.3. Gate/Globe/Check
- 6.1.4. Plug
- 6.1.5. Control
- 6.1.6. Other Types
- 6.2. Market Analysis, Insights and Forecast - by End-User Vertical
- 6.2.1. Oil and Gas
- 6.2.2. Power Generation
- 6.2.3. Chemical
- 6.2.4. Water and Wastewater
- 6.2.5. Mining
- 6.2.6. Other End User Verticals
- 6.1. Market Analysis, Insights and Forecast - by Type
- 7. Europe Valves Market Analysis, Insights and Forecast, 2020-2032
- 7.1. Market Analysis, Insights and Forecast - by Type
- 7.1.1. Ball
- 7.1.2. Butterfly
- 7.1.3. Gate/Globe/Check
- 7.1.4. Plug
- 7.1.5. Control
- 7.1.6. Other Types
- 7.2. Market Analysis, Insights and Forecast - by End-User Vertical
- 7.2.1. Oil and Gas
- 7.2.2. Power Generation
- 7.2.3. Chemical
- 7.2.4. Water and Wastewater
- 7.2.5. Mining
- 7.2.6. Other End User Verticals
- 7.1. Market Analysis, Insights and Forecast - by Type
- 8. Asia Pacific Valves Market Analysis, Insights and Forecast, 2020-2032
- 8.1. Market Analysis, Insights and Forecast - by Type
- 8.1.1. Ball
- 8.1.2. Butterfly
- 8.1.3. Gate/Globe/Check
- 8.1.4. Plug
- 8.1.5. Control
- 8.1.6. Other Types
- 8.2. Market Analysis, Insights and Forecast - by End-User Vertical
- 8.2.1. Oil and Gas
- 8.2.2. Power Generation
- 8.2.3. Chemical
- 8.2.4. Water and Wastewater
- 8.2.5. Mining
- 8.2.6. Other End User Verticals
- 8.1. Market Analysis, Insights and Forecast - by Type
- 9. Latin America Valves Market Analysis, Insights and Forecast, 2020-2032
- 9.1. Market Analysis, Insights and Forecast - by Type
- 9.1.1. Ball
- 9.1.2. Butterfly
- 9.1.3. Gate/Globe/Check
- 9.1.4. Plug
- 9.1.5. Control
- 9.1.6. Other Types
- 9.2. Market Analysis, Insights and Forecast - by End-User Vertical
- 9.2.1. Oil and Gas
- 9.2.2. Power Generation
- 9.2.3. Chemical
- 9.2.4. Water and Wastewater
- 9.2.5. Mining
- 9.2.6. Other End User Verticals
- 9.1. Market Analysis, Insights and Forecast - by Type
- 10. Middle East and Africa Valves Market Analysis, Insights and Forecast, 2020-2032
- 10.1. Market Analysis, Insights and Forecast - by Type
- 10.1.1. Ball
- 10.1.2. Butterfly
- 10.1.3. Gate/Globe/Check
- 10.1.4. Plug
- 10.1.5. Control
- 10.1.6. Other Types
- 10.2. Market Analysis, Insights and Forecast - by End-User Vertical
- 10.2.1. Oil and Gas
- 10.2.2. Power Generation
- 10.2.3. Chemical
- 10.2.4. Water and Wastewater
- 10.2.5. Mining
- 10.2.6. Other End User Verticals
- 10.1. Market Analysis, Insights and Forecast - by Type
- 11. Competitive Analysis
- 11.1. Global Market Share Analysis 2025
- 11.2. Company Profiles
- 11.2.1 Flowserve Corporation
- 11.2.1.1. Overview
- 11.2.1.2. Products
- 11.2.1.3. SWOT Analysis
- 11.2.1.4. Recent Developments
- 11.2.1.5. Financials (Based on Availability)
- 11.2.2 Alfa Laval Corporate AB
- 11.2.2.1. Overview
- 11.2.2.2. Products
- 11.2.2.3. SWOT Analysis
- 11.2.2.4. Recent Developments
- 11.2.2.5. Financials (Based on Availability)
- 11.2.3 Emerson Electric Co
- 11.2.3.1. Overview
- 11.2.3.2. Products
- 11.2.3.3. SWOT Analysis
- 11.2.3.4. Recent Developments
- 11.2.3.5. Financials (Based on Availability)
- 11.2.4 Samson Controls Inc
- 11.2.4.1. Overview
- 11.2.4.2. Products
- 11.2.4.3. SWOT Analysis
- 11.2.4.4. Recent Developments
- 11.2.4.5. Financials (Based on Availability)
- 11.2.5 IMI Critical Engineering
- 11.2.5.1. Overview
- 11.2.5.2. Products
- 11.2.5.3. SWOT Analysis
- 11.2.5.4. Recent Developments
- 11.2.5.5. Financials (Based on Availability)
- 11.2.6 Crane Co
- 11.2.6.1. Overview
- 11.2.6.2. Products
- 11.2.6.3. SWOT Analysis
- 11.2.6.4. Recent Developments
- 11.2.6.5. Financials (Based on Availability)
- 11.2.7 Rotork plc
- 11.2.7.1. Overview
- 11.2.7.2. Products
- 11.2.7.3. SWOT Analysis
- 11.2.7.4. Recent Developments
- 11.2.7.5. Financials (Based on Availability)
- 11.2.8 Schlumberger Limited
- 11.2.8.1. Overview
- 11.2.8.2. Products
- 11.2.8.3. SWOT Analysis
- 11.2.8.4. Recent Developments
- 11.2.8.5. Financials (Based on Availability)
- 11.2.9 Spirax Sarco Limited
- 11.2.9.1. Overview
- 11.2.9.2. Products
- 11.2.9.3. SWOT Analysis
- 11.2.9.4. Recent Developments
- 11.2.9.5. Financials (Based on Availability)
- 11.2.10 KITZ Corporation
- 11.2.10.1. Overview
- 11.2.10.2. Products
- 11.2.10.3. SWOT Analysis
- 11.2.10.4. Recent Developments
- 11.2.10.5. Financials (Based on Availability)
- 11.2.1 Flowserve Corporation
List of Figures
- Figure 1: Global Valves Market Revenue Breakdown (Million, %) by Region 2025 & 2033
- Figure 2: North America Valves Market Revenue (Million), by Type 2025 & 2033
- Figure 3: North America Valves Market Revenue Share (%), by Type 2025 & 2033
- Figure 4: North America Valves Market Revenue (Million), by End-User Vertical 2025 & 2033
- Figure 5: North America Valves Market Revenue Share (%), by End-User Vertical 2025 & 2033
- Figure 6: North America Valves Market Revenue (Million), by Country 2025 & 2033
- Figure 7: North America Valves Market Revenue Share (%), by Country 2025 & 2033
- Figure 8: Europe Valves Market Revenue (Million), by Type 2025 & 2033
- Figure 9: Europe Valves Market Revenue Share (%), by Type 2025 & 2033
- Figure 10: Europe Valves Market Revenue (Million), by End-User Vertical 2025 & 2033
- Figure 11: Europe Valves Market Revenue Share (%), by End-User Vertical 2025 & 2033
- Figure 12: Europe Valves Market Revenue (Million), by Country 2025 & 2033
- Figure 13: Europe Valves Market Revenue Share (%), by Country 2025 & 2033
- Figure 14: Asia Pacific Valves Market Revenue (Million), by Type 2025 & 2033
- Figure 15: Asia Pacific Valves Market Revenue Share (%), by Type 2025 & 2033
- Figure 16: Asia Pacific Valves Market Revenue (Million), by End-User Vertical 2025 & 2033
- Figure 17: Asia Pacific Valves Market Revenue Share (%), by End-User Vertical 2025 & 2033
- Figure 18: Asia Pacific Valves Market Revenue (Million), by Country 2025 & 2033
- Figure 19: Asia Pacific Valves Market Revenue Share (%), by Country 2025 & 2033
- Figure 20: Latin America Valves Market Revenue (Million), by Type 2025 & 2033
- Figure 21: Latin America Valves Market Revenue Share (%), by Type 2025 & 2033
- Figure 22: Latin America Valves Market Revenue (Million), by End-User Vertical 2025 & 2033
- Figure 23: Latin America Valves Market Revenue Share (%), by End-User Vertical 2025 & 2033
- Figure 24: Latin America Valves Market Revenue (Million), by Country 2025 & 2033
- Figure 25: Latin America Valves Market Revenue Share (%), by Country 2025 & 2033
- Figure 26: Middle East and Africa Valves Market Revenue (Million), by Type 2025 & 2033
- Figure 27: Middle East and Africa Valves Market Revenue Share (%), by Type 2025 & 2033
- Figure 28: Middle East and Africa Valves Market Revenue (Million), by End-User Vertical 2025 & 2033
- Figure 29: Middle East and Africa Valves Market Revenue Share (%), by End-User Vertical 2025 & 2033
- Figure 30: Middle East and Africa Valves Market Revenue (Million), by Country 2025 & 2033
- Figure 31: Middle East and Africa Valves Market Revenue Share (%), by Country 2025 & 2033
List of Tables
- Table 1: Global Valves Market Revenue Million Forecast, by Type 2020 & 2033
- Table 2: Global Valves Market Revenue Million Forecast, by End-User Vertical 2020 & 2033
- Table 3: Global Valves Market Revenue Million Forecast, by Region 2020 & 2033
- Table 4: Global Valves Market Revenue Million Forecast, by Type 2020 & 2033
- Table 5: Global Valves Market Revenue Million Forecast, by End-User Vertical 2020 & 2033
- Table 6: Global Valves Market Revenue Million Forecast, by Country 2020 & 2033
- Table 7: Global Valves Market Revenue Million Forecast, by Type 2020 & 2033
- Table 8: Global Valves Market Revenue Million Forecast, by End-User Vertical 2020 & 2033
- Table 9: Global Valves Market Revenue Million Forecast, by Country 2020 & 2033
- Table 10: Global Valves Market Revenue Million Forecast, by Type 2020 & 2033
- Table 11: Global Valves Market Revenue Million Forecast, by End-User Vertical 2020 & 2033
- Table 12: Global Valves Market Revenue Million Forecast, by Country 2020 & 2033
- Table 13: Global Valves Market Revenue Million Forecast, by Type 2020 & 2033
- Table 14: Global Valves Market Revenue Million Forecast, by End-User Vertical 2020 & 2033
- Table 15: Global Valves Market Revenue Million Forecast, by Country 2020 & 2033
- Table 16: Global Valves Market Revenue Million Forecast, by Type 2020 & 2033
- Table 17: Global Valves Market Revenue Million Forecast, by End-User Vertical 2020 & 2033
- Table 18: Global Valves Market Revenue Million Forecast, by Country 2020 & 2033
Frequently Asked Questions
1. What is the projected Compound Annual Growth Rate (CAGR) of the Valves Market?
The projected CAGR is approximately 6.25%.
2. Which companies are prominent players in the Valves Market?
Key companies in the market include Flowserve Corporation, Alfa Laval Corporate AB, Emerson Electric Co, Samson Controls Inc, IMI Critical Engineering, Crane Co, Rotork plc, Schlumberger Limited, Spirax Sarco Limited, KITZ Corporation.
3. What are the main segments of the Valves Market?
The market segments include Type, End-User Vertical.
4. Can you provide details about the market size?
The market size is estimated to be USD 79.90 Million as of 2022.
5. What are some drivers contributing to market growth?
Rise in Infrastructure-Related Developments; Adoption of Emerging Technologies.
6. What are the notable trends driving market growth?
Oil and Gas Vertical Accounts for a Major Market Share.
7. Are there any restraints impacting market growth?
; High Capital Investment and Increasing Use of Fiber Optic Transmission Cables; Regulatory Constraints and Limited Orbital Locations.
8. Can you provide examples of recent developments in the market?
N/A
9. What pricing options are available for accessing the report?
Pricing options include single-user, multi-user, and enterprise licenses priced at USD 4750, USD 5250, and USD 8750 respectively.
10. Is the market size provided in terms of value or volume?
The market size is provided in terms of value, measured in Million.
11. Are there any specific market keywords associated with the report?
Yes, the market keyword associated with the report is "Valves Market," which aids in identifying and referencing the specific market segment covered.
12. How do I determine which pricing option suits my needs best?
The pricing options vary based on user requirements and access needs. Individual users may opt for single-user licenses, while businesses requiring broader access may choose multi-user or enterprise licenses for cost-effective access to the report.
13. Are there any additional resources or data provided in the Valves Market report?
While the report offers comprehensive insights, it's advisable to review the specific contents or supplementary materials provided to ascertain if additional resources or data are available.
14. How can I stay updated on further developments or reports in the Valves Market?
To stay informed about further developments, trends, and reports in the Valves Market, consider subscribing to industry newsletters, following relevant companies and organizations, or regularly checking reputable industry news sources and publications.
Methodology
Step 1 - Identification of Relevant Samples Size from Population Database


Step 2 - Approaches for Defining Global Market Size (Value, Volume* & Price*)

Note*: In applicable scenarios
Step 3 - Data Sources
Primary Research
- Web Analytics
- Survey Reports
- Research Institute
- Latest Research Reports
- Opinion Leaders
Secondary Research
- Annual Reports
- White Paper
- Latest Press Release
- Industry Association
- Paid Database
- Investor Presentations

Step 4 - Data Triangulation
Involves using different sources of information in order to increase the validity of a study
These sources are likely to be stakeholders in a program - participants, other researchers, program staff, other community members, and so on.
Then we put all data in single framework & apply various statistical tools to find out the dynamic on the market.
During the analysis stage, feedback from the stakeholder groups would be compared to determine areas of agreement as well as areas of divergence